- Best of All
- Best Miami Luxury Condos
- Most popular
- Relocating to Miami
- Private Schools
- Investments
- Gated communities
- Waterfront information
- Luxury homes
- Luxury Condos
- New Construction Condos in South Florida
- Independent Pre-Construction condo reviews for Miami
- Independent Pre-Construction condo reviews for Fort Lauderdale
Miami Real Estate Market Predictions 2022 / 2023 (Part 1)
Part 1 | Miami Real Estate Market Predictions 2022. Full Data and Analysis.
The introduction video for our Miami real estate market forecast 2022/2023
Introduction to our Miami Real Estate Market Predictions 2022 / 2023.
Miami Real Estate Market Predictions 2022 and 2023 are what we are closely analyzing in this report. Starting in May 2022, various sectors of the economy went down: the bond market, the stock market, and Crypto. At the same time, interest rates went up. With many people feeling the economy is not looking so rosy for the rest of 2022 and into 2023, we considered it relevant to address the logical question: “What about the Miami real estate market?” This report will address the key influencers that affect our South Florida real estate market and report on the signals and statistics we are now seeing, which point us to a Crash, Correction, or Continued growth.
The report provides grassroots observations, covering 12 different residential neighborhoods in Miami. The report discusses both condos and houses with five price points and in four separate parts:
Four Parts to our 2022 Miami Real Estate Report
- Part 1 Miami Real Estate 2022 Data, Miami Real Estate Market Predictions for 2022, Analysis and Forecasting into 2023. In this section we cover 3 key periods: 2015-2020, 2020-2022, Q2 2022 & 2023 predictions. We discuss Miami real estate market trends in the past years to better forecast what is happening to Miami real estate in the years to come.
- Part 2 Miami Residential Investments. We cover the rental market and address the relationship between the rental market and the sales market.
- Part 3 Miami Real Estate Economic forces at play. This is the ‘why’ to part 1’s ‘what’.
- Part 4 Miami Real Estate Market Forecast and Predictions with advice to buyers, sellers, renters, and investors.
Neighborhood Analysis 2015-2020
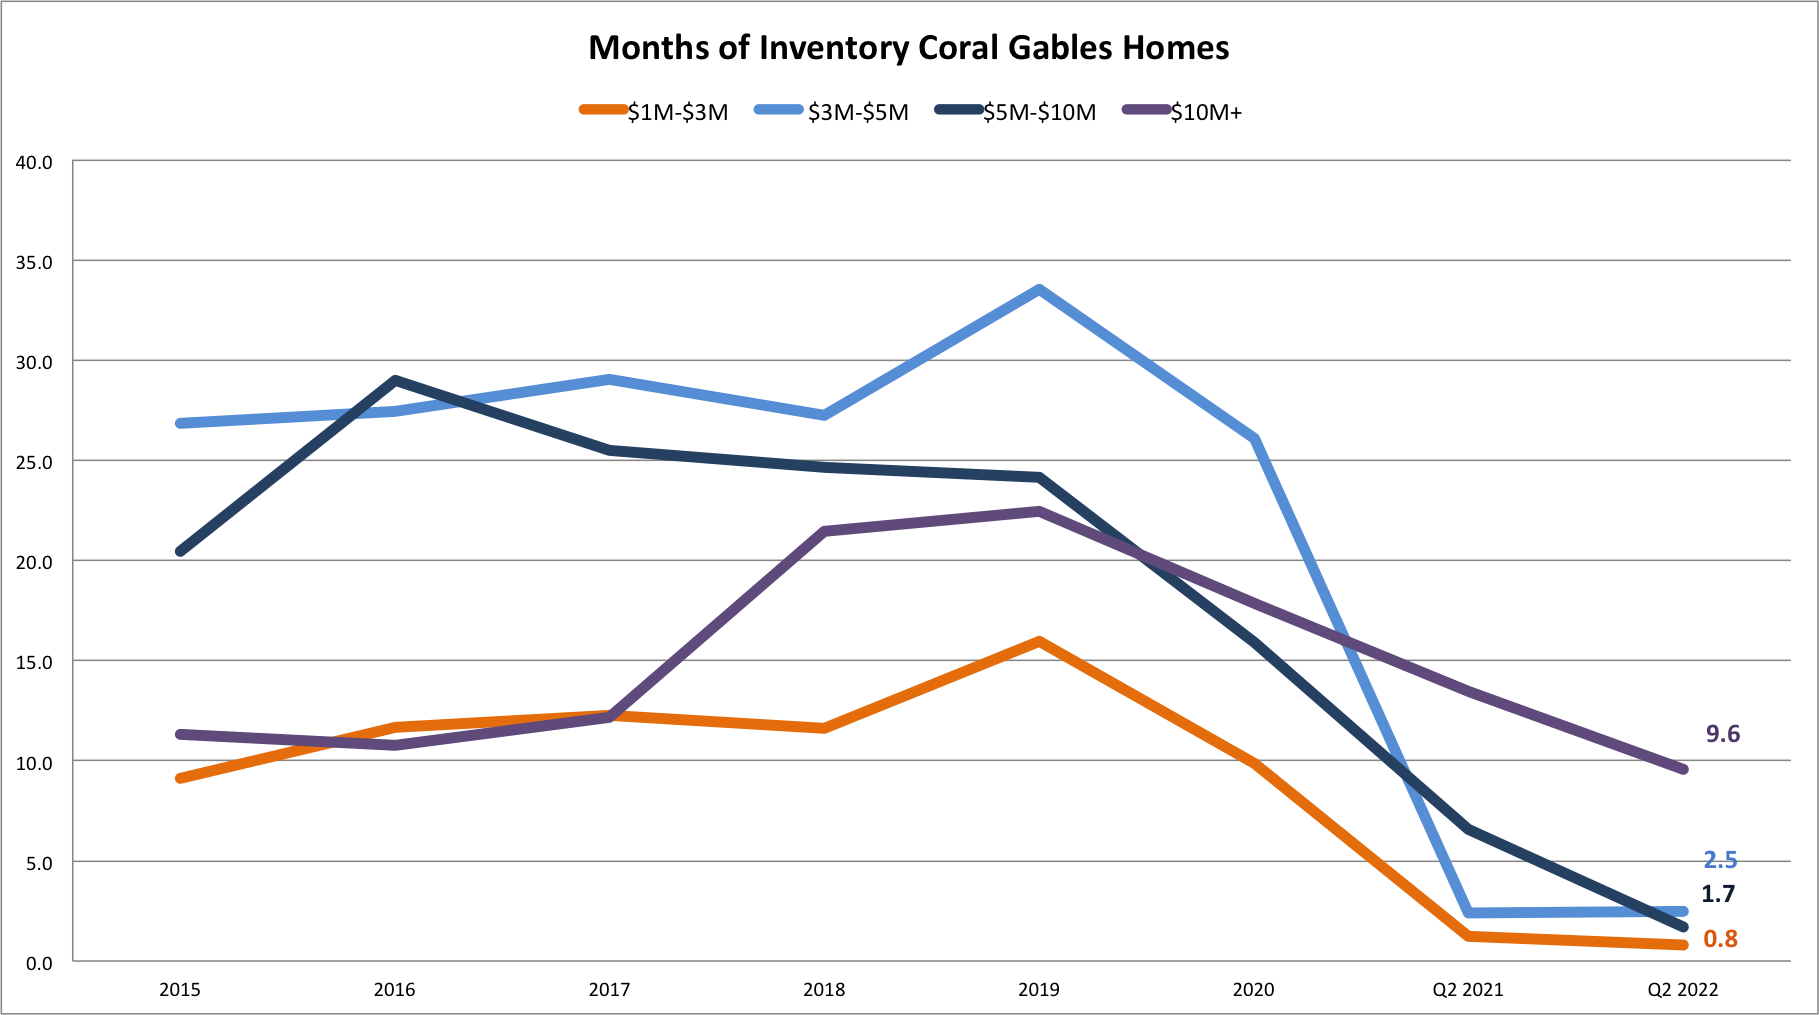
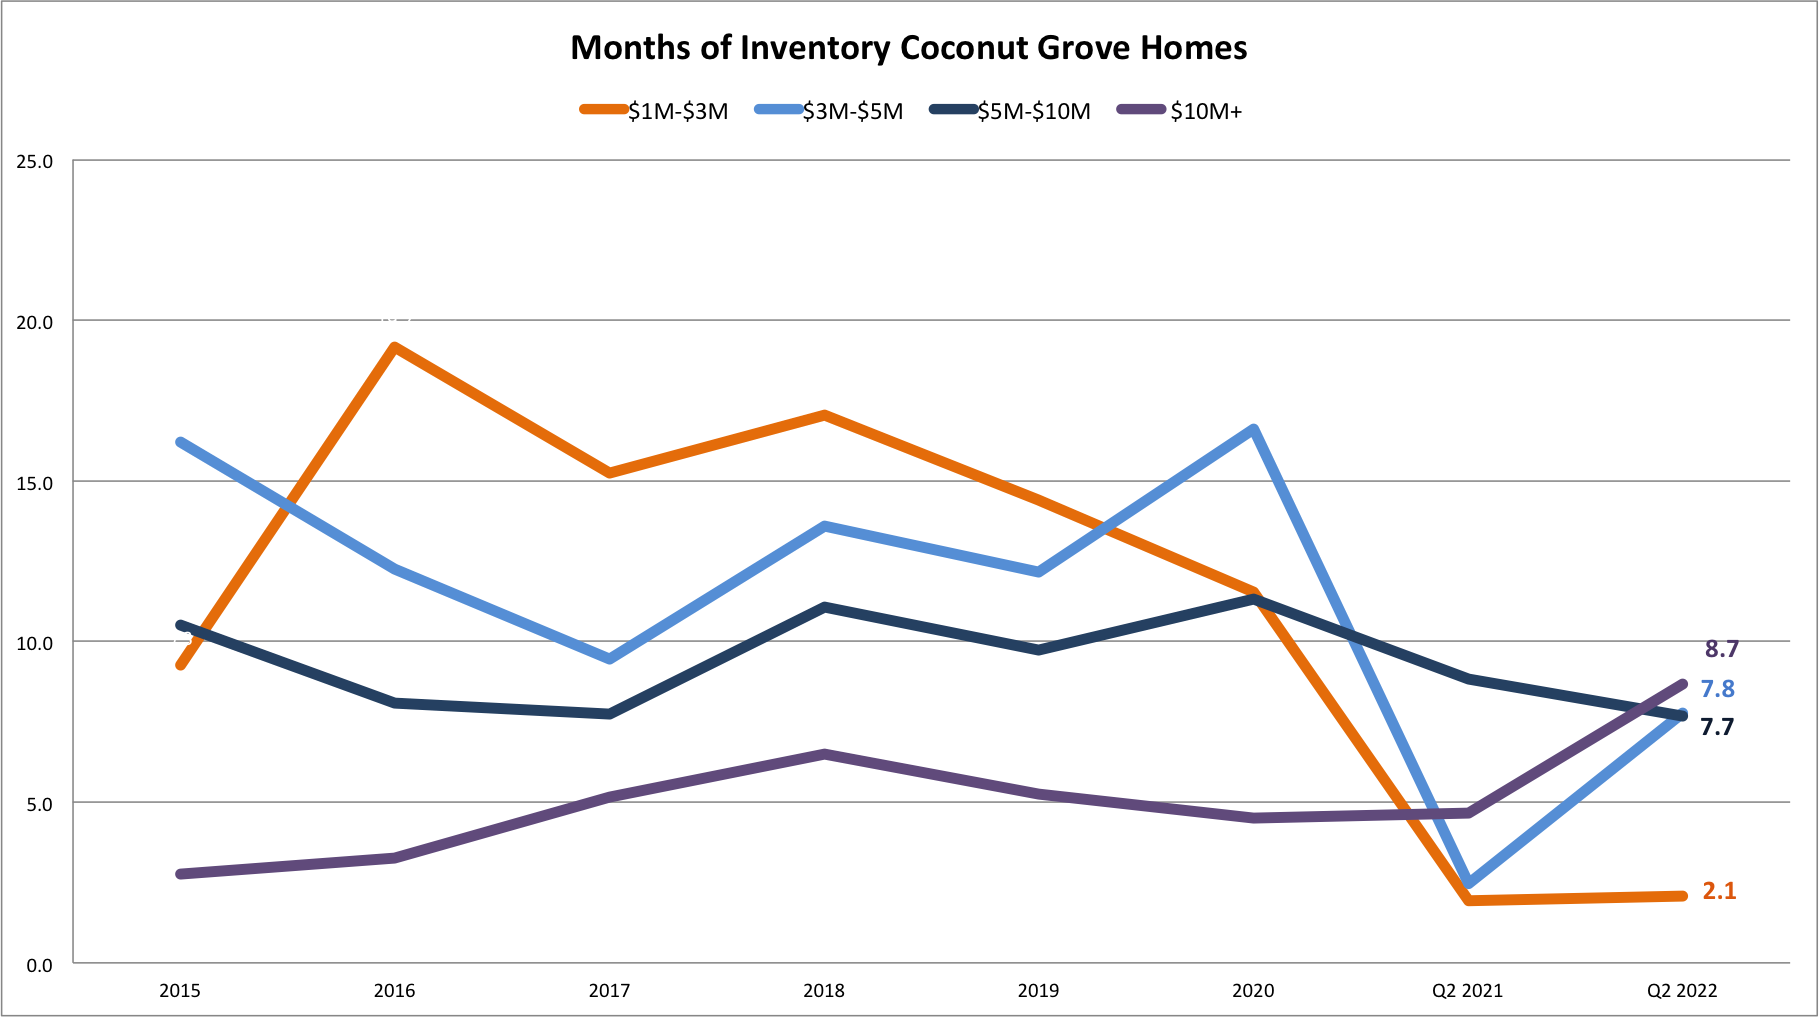
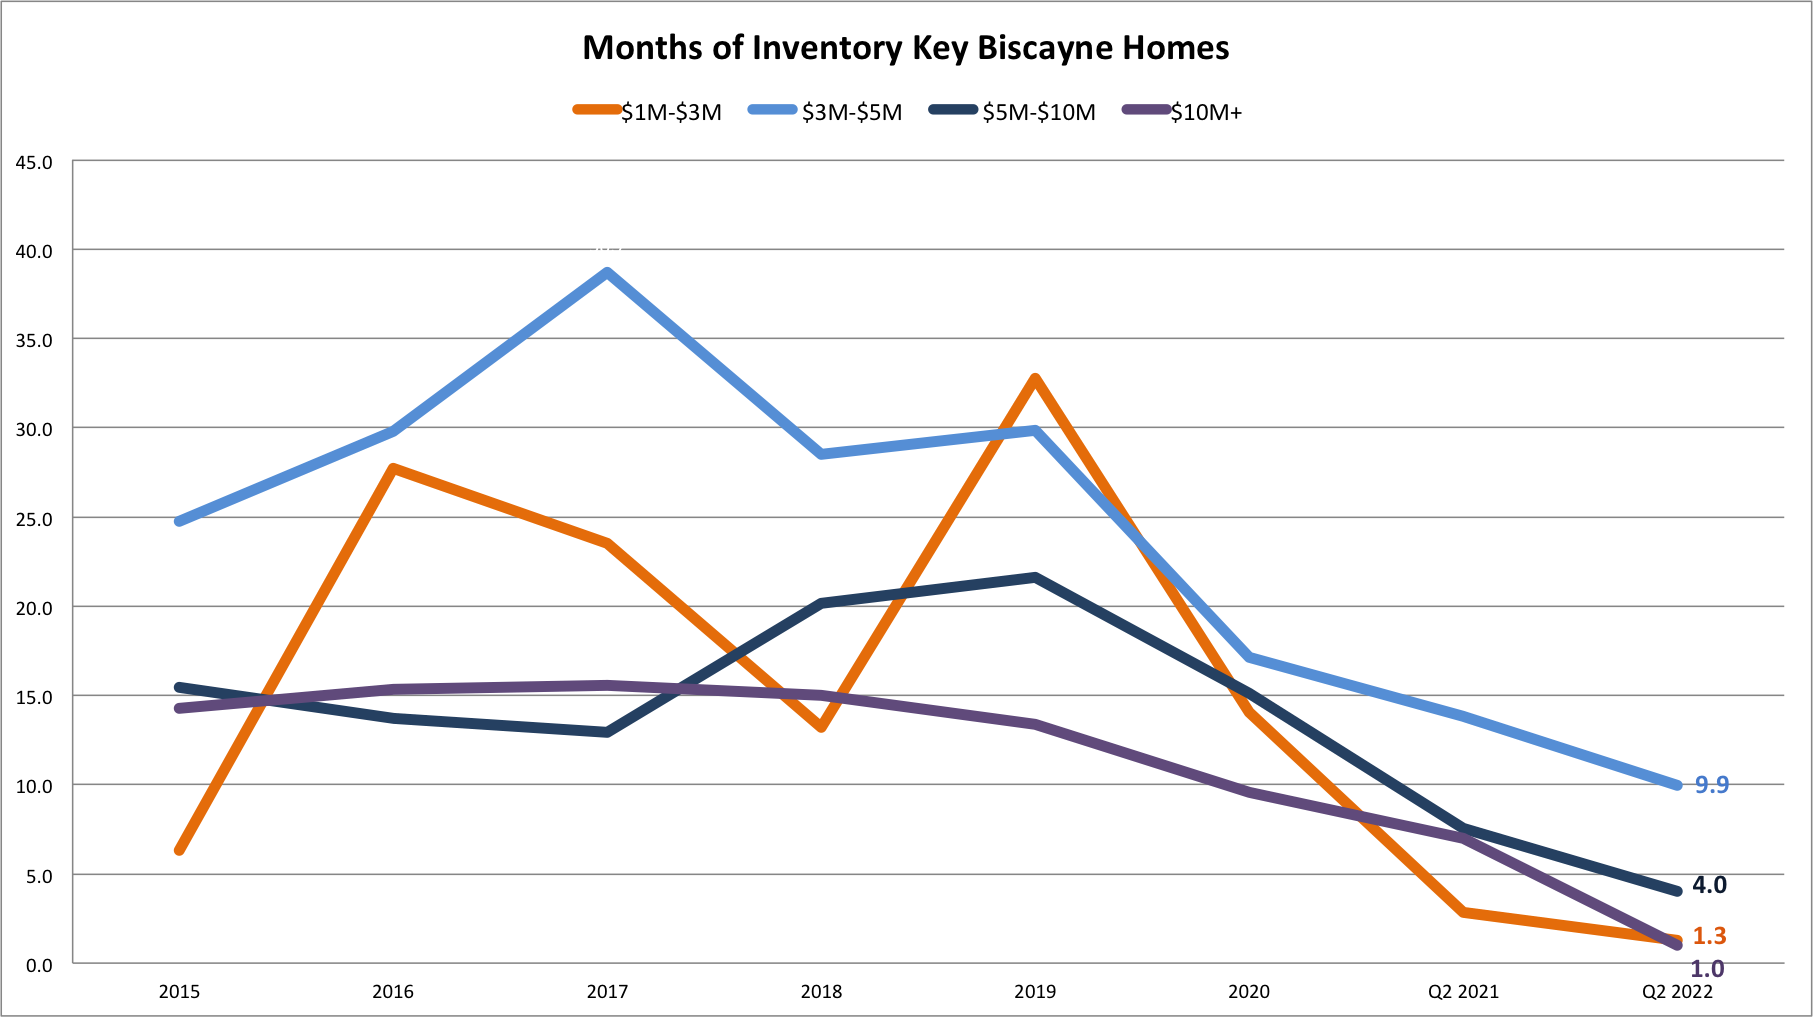
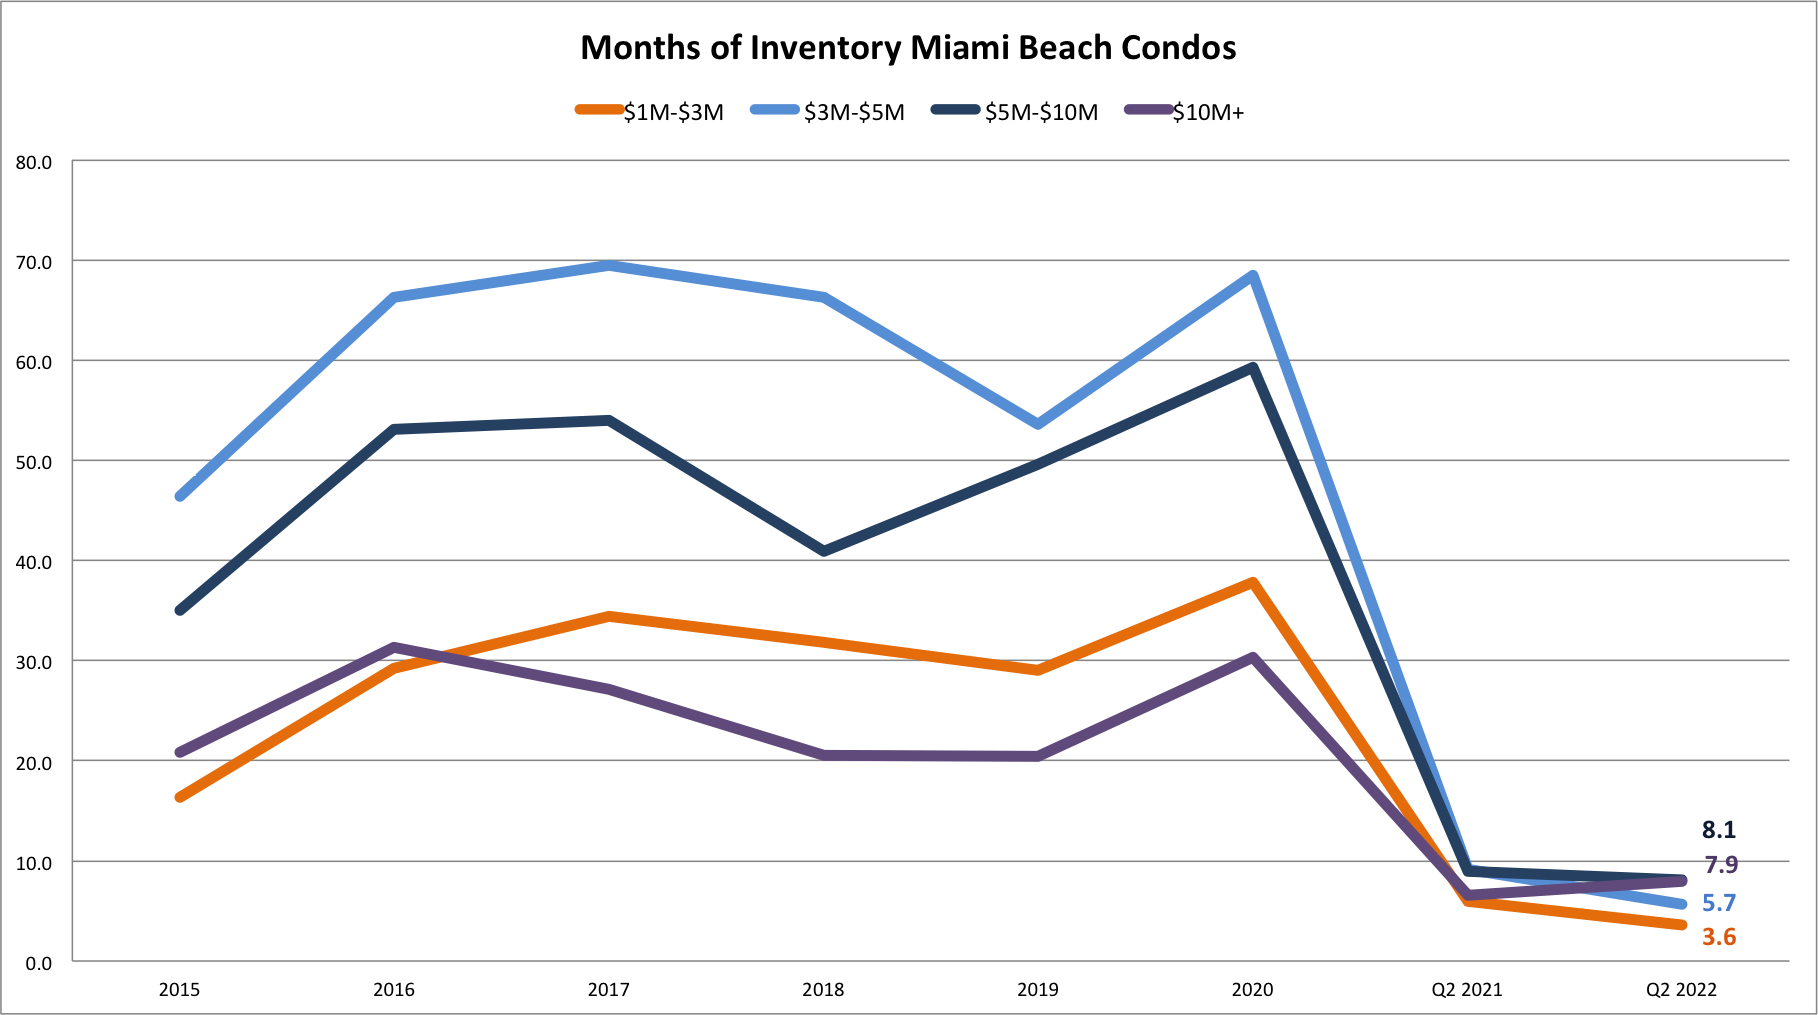
To appreciate the ‘months of inventory’ graph, you should know that nine months of inventory or less means you are in a seller’s market. More than nine months of inventory indicates you are in a buyer’s market.
So, just to set the scene, let’s start with a recollection of what happened between 2015 and 2020. History does not necessarily repeat itself, but it rhymes! Pay attention to some of the more ‘fragile’ or weaker markets that showed very high inventory between 2015-2020, as it will become relevant when you see their changing performance in the last six months, revealed later in Part 1.
Observations
The housing market
The housing market moved at a steady rate between 2015 and 2020. By 2020 the average dollar per SF price jumped by a little over 10% across the primary single-family neighborhoods. By Q3 and Q4 of 2020, inventory had dropped to all-time lows.
Getting more granular with single-family homes, the most popular single-family home neighborhoods of Coral Gables and Pinecrest have performed the best over the 2015-2020 period. Primary markets where families live all year round have performed more stably than secondary markets.
More expensive and luxury home markets, which were firmly in the buyers’ favor up to 2020, suddenly saw massive drops in inventory. For the first time in a decade, the luxury market became a seller’s market, where sellers benefit from inventory levels below five months.
The condo market
The condo market dropped over the five years between 2015 and 2020. At the same time, the condo market was illustrating some more volatile swings in inventory. As a result of many new condo listings, either resale or condos or new construction condos, the years 2016, 2018, and 2020 saw spikes in inventory.
From 2019-2020 we saw aggressive increases in inventory in the condo market. Then in 2020, inventory nose-dived as buyers flocked to buy condos. This decrease might be due to two factors. Firstly, condo prices had dropped and therefore posed good value. Secondly, the housing market saw limited inventory and got very expensive. The changes in the housing market resulted in condos becoming an attractive deal again.
Some neighborhoods were more volatile, to begin with (pre-Covid), or suffered due to very high amounts of inventory. Inventory in Brickell for the dominant $1m-$3m range was up to 100 months by 2020, a dangerous level. Sunny Isles, until 2020, had 50 to 80 months of inventory across almost all sectors apart from the $10m+ market. This amount of unsold product created a disadvantageous situation for sellers but was advantageous to buyers.
The $10m+ range shows low inventory levels because there was simply not much $10m+ product available. Most of the condos that sold did so in pre-construction deals. Today, the market shows 41 months of inventory in the $5-$10m range. Remarkably this is unlike Bal Harbour and Surfside, which have only five months of product for the same price point. These neighborhoods are right next to each other, but it shows the importance of specificity for locational performance.
Neighborhood Analysis 2020-2022
Not all markets behave the same. The most significant difference exists between two different groups: primary and secondary owners. Primary markets are neighborhoods or communities where properties are predominantly primary; residents own and live in these residences all year round. Secondary markets are neighborhoods or communities dominated by investors. These markets experience high numbers of rentals and second homeowners. A non-essential luxury for the wealthy and ultra-wealthy.
It is important to know that pockets of primary and secondary properties can exist in the same neighborhood. Within the condo market, some buildings have a higher ratio of renters to owners and are thus more secondary and vice versa. For more granular statistics, go to Condo Geeks or call me.
Observations
Primary and Secondary Markets
Both did well over the last two years. The primary markets started with a much lower inventory and remained stable. The secondary markets, as history has shown, tend to oscillate more.
Condo Market Inventory
The condo market has plummeted over the last two years. Coming from a dangerously high 90 months of inventory in May 2020, this inventory dropped to record lows by 2021. Over the last year, it has since oscillated slightly. With that said, the ultra-luxury sector of the condo market ($10m+), offering the best condos in Miami, did very well over 2020 and 2021 and has continued to do so over 2022.
Condo market prices across Miami have unbelievably increased at an average of 30% over the last two years. Some products and neighborhoods increased even more in value. The last time we saw this was coming out of the last recession between 2009-2011 when prices rebounded at a similar rate. An appropriate question is whether these increases can be sustained or will correct, as they did in previous cycles. For a more precise analysis, visit my Condo Geeks software.
New Construction Condos prices – These data tables do not include new construction condo sales, but I can tell you from an ‘on-the ground’ viewpoint that these also did extremely well. Several new construction condos (Mr. C Coconut Grove, Elysee) completely sold out during this period, and many got to 50% of sales in a record-breaking time. With that said, developers hide their sales numbers because they will increase prices as projects progress. They do not want to jeopardize remaining sales if those buyers know about the ‘better deal’ previous purchasers locked in. If you want a sense of accurate prices, please call me as I do call around other agents to see what deals they got their clients and reference my own.
Housing Market
Inventory started at much lower levels with 18 months of inventory. Since January 2021, inventory has kept far below what is considered a balanced market. With inventory levels below five months, bidding wars from a feeding frenzy of relocating buyers (previously explained in detail within our 2021 Report) made this 100% a seller’s market.
Housing market prices (home prices and prices per sqft) have performed best of all markets! The housing market started with a much healthier inventory. This already stable performance of this market went supersonic with mass migrating families. These migrating families, from the North East and California, were desperate to get their kids into schools and away from unstable social and economic environments. Dollar per sqft prices rose on average 55% over the two years.
I can tell you from first-hand experience that in the luxury and ultra-luxury sectors, I have seen sales increase much more than this, with a few examples of 100% profit flips occurring. For more specific neighborhood performance, please read the neighborhood reports or give me a call.
Our Neighborhood Market Predictions for Q3/Q4 of 2022 and 2023.
Let’s get into some key pending data points. Most notably the changing absorption rates. This is the ‘predictive’ part of the analytics, which will forecast where the market is going. If you cross reference the ’last 30-day absorption information’ (properties listed in the last 30 days to those that went pending in the last 30 days) against ‘current months of inventory (which is the number of active listings against closed sales) then we start to see the pattern of where we are going over the next quarter.
We also explore the percentage discounts from the asking price to the sales price. We have noticed since May how the days on the market are increasing, pending sales are dropping, and new listings are increasing in several neighborhoods.
Our live analytics ‘Condo Geeks’ or ‘Home Geeks’ tools will track monthly inventory changes. These are powerful tools to stay on top of the statistics! There is currently no other realtor in Miami that has a live monthly system! A powerful tool to stay one step ahead. Forewarned is forearmed!
Observations
Overall
The first three or four months of 2022 felt like business as usual, for most of the Miami neighborhoods. Sales were still going strong, and desire was still running high. The lack of inventory was the only thing that felt like it was starting to slow our market down. If you look at the graphs, you can see that this was true.
Single Family Homes
For those of you searching for single-family homes in the $1-3m range, if you feel it has been difficult, you can now see why! We currently see below two months of inventory; that is 25% of what listings we would expect to see in a ‘balanced market. However, you cannot assume that all single-family markets are systematically going to lean advantageously toward sellers for the rest of the year. Inventory is increasing in the $3M-$5M range and even the $5-$10M range. If you look at the chart, you can see that the $5-$10m range shows the highest level of increasing inventory. If you prefer to get granular, you should look at our specific neighborhood reports. By the end of the summer, four of the seven single-family neighborhoods will lean into a buyer’s market.
Luxury Single Family Homes. In a specific ‘Gated Communities and Ultra Prime Neighborhood Report’, you can see how the ultra-luxury home market is alive and well. Inventory is overall still low, although now rising, and please bear in mind this is also a much smaller data set.
Over the last two years, we have seen our relatively limited supply of ultra-luxury products absorbed by the market. The shifted demographic of ultra-wealthy buyers who have dominantly migrated from NYC and California dried up our luxury market.
In part three we delve into the evolving demographic of Miami and explain this phenomenon. With supply chain issues, the future production of the more ultra-luxury single-family product has been slow, which makes the existing product all the more desirable.
The condo market
Performance over the last six months has been good. With that said, the $1-3m price range shows inventory IS now rising. We do not expect the inventory levels in the short term (the next three month-period) to increase at such speed that it will impact sellers. It is possible, however, to see the sellers’ advantage change by Q1 of 2023, given the aggressive rise in inventory in neighborhoods like Brickell and Downtown (22% increase in the last 60 days).
It is in the $5m-$10m price range (much like single-family homes) that we start to see potential problems. Neighborhoods with future high inventory level projections: Brickell and Downtown (24 months), Edgewater (36 months), and Sunny Isles Beach (56 months). These all illicit signs of an imbalance between supply and demand, which needs to be watched. If you refer back to the 2015-2020 performance, you can see how these specific neighborhoods, which were the most densely packed with new and luxury condos, got into trouble and saw price drops with high inventory levels. History does not repeat itself, but it rhymes!
The Luxury Condo Market. Bal Harbour and South of Fifth, Miami’s most luxurious condo neighborhoods, remain strong at the $5m – $10m range and even more so at the $10m+ range with low inventory levels.
For further granular analysis, read our specific last 60-day neighborhood reports.
Our Territory Managers reports provide very granular Neighborhood reports of the last six months and notably the last 60 days, so please refer to these also to get more granular analysis of the specific market that applies to you.
FAQ
These are the most commonly asked Google Real Estate Related questions
1. What are the Current Best New Condos in Miami?
If you want to hear in more details our opinions on the best new Miami new construction condos. Please read this article:Best New Construction Condos 2022-2023.
2. What is the best New Construction Condo in Fort Lauderdale?
In our opinion, the Residences at Pier Sixty-six are certainly the most interesting and unique. Already well underway this 32 Acre project will be home to the first of its kind Marina where owners will be able to anchor up vessels up to a staggering 400 ft! For specifics of this project see our independent review of this project.
3. How can I compare the new luxury construction Condos to the best existing Luxury Condos in Miami?
Our Best Luxury Condos in Miami article will prove to be very useful to those looking to compare the existing to the new. You may also want to watch this video which shows the performance of the best Condos in Miami over the last 15 years!
Please fill in your details and David Siddons will contact you
- Get our Newsletter
- Subscribe
- No Thanks
Get the latest news from Miami Real Estate News
Edit Search
Recomend this to a friend, just enter their email below.
 COMPARE WITH CONDOGEEKS


