- Best of All
- Best Miami Luxury Condos
- Most popular
- Relocating to Miami
- Private Schools
- Investments
- Gated communities
- Waterfront information
- Luxury homes
- Luxury Condos
- New Construction Condos in South Florida
- Independent Pre-Construction condo reviews for Miami
- Independent Pre-Construction condo reviews for Fort Lauderdale
The Q1 2020 Miami Real Estate Report: How did every Miami Neighborhood Perform in Q1 2020?
Part 7: How did every Miami Neighborhood Perform in Q1 2020?
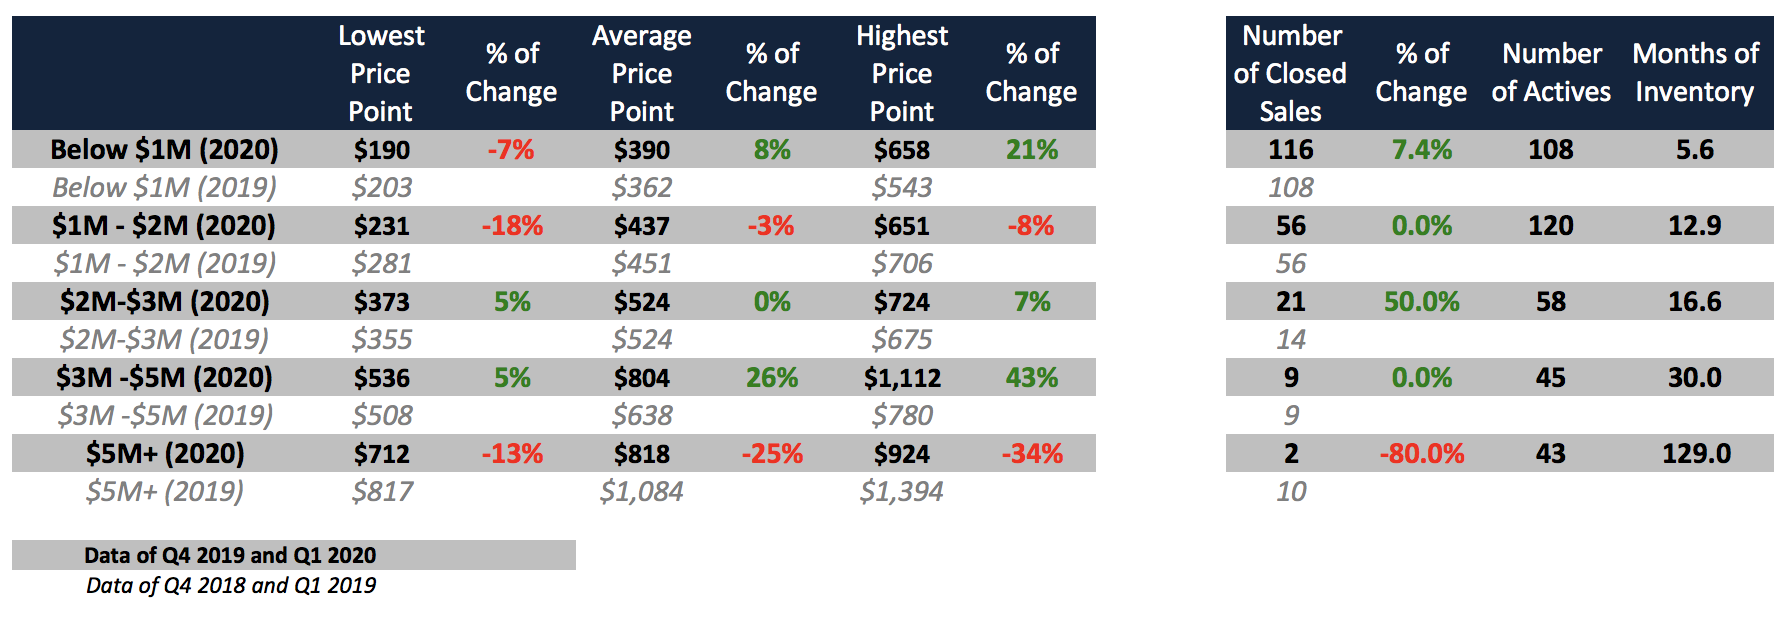
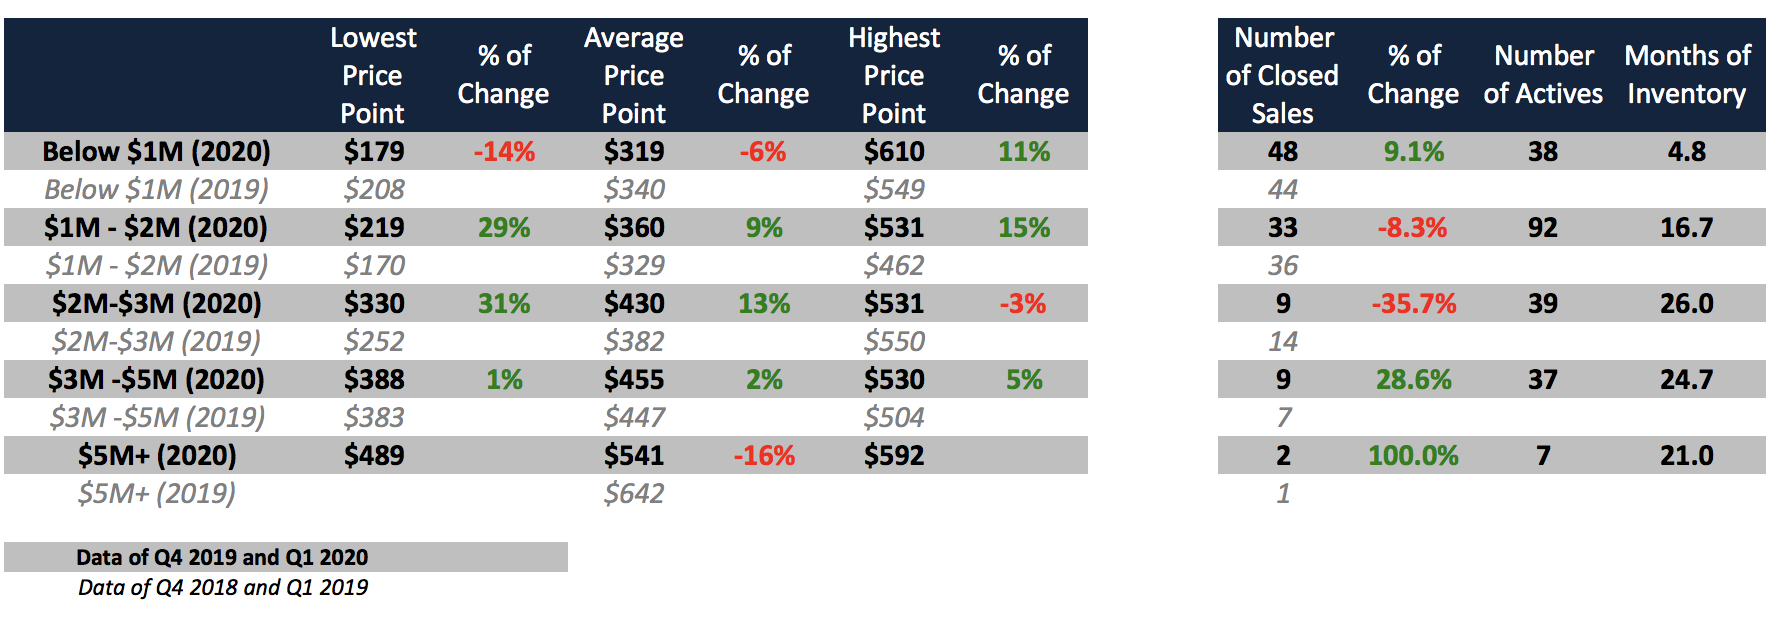
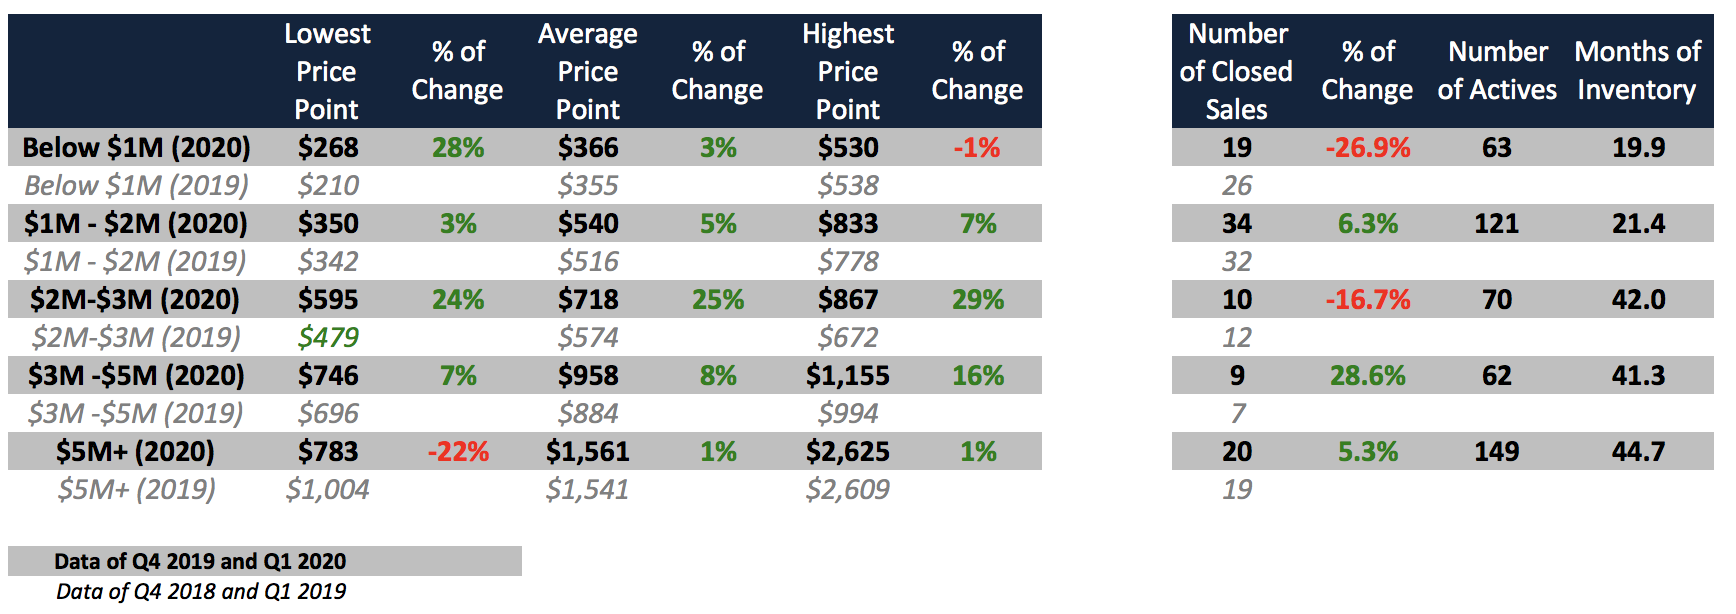
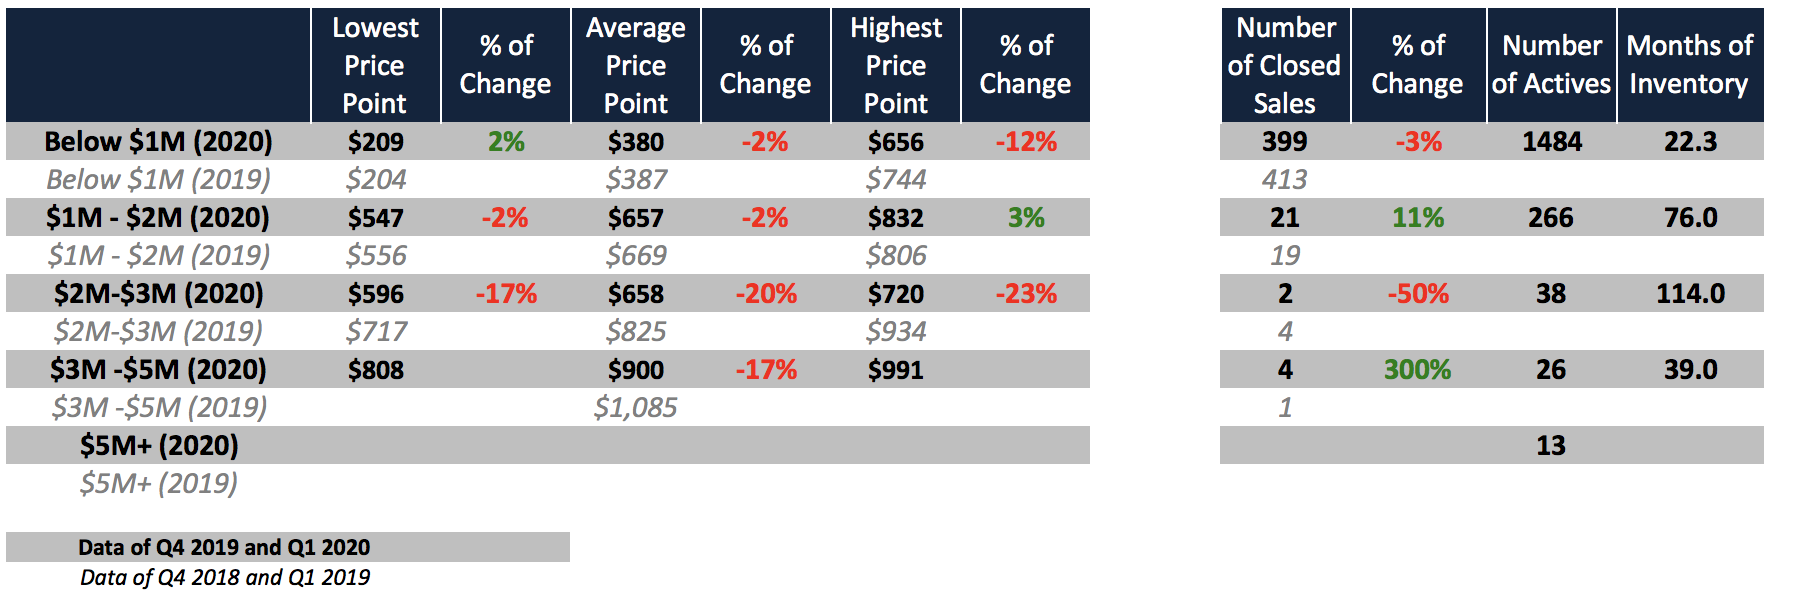
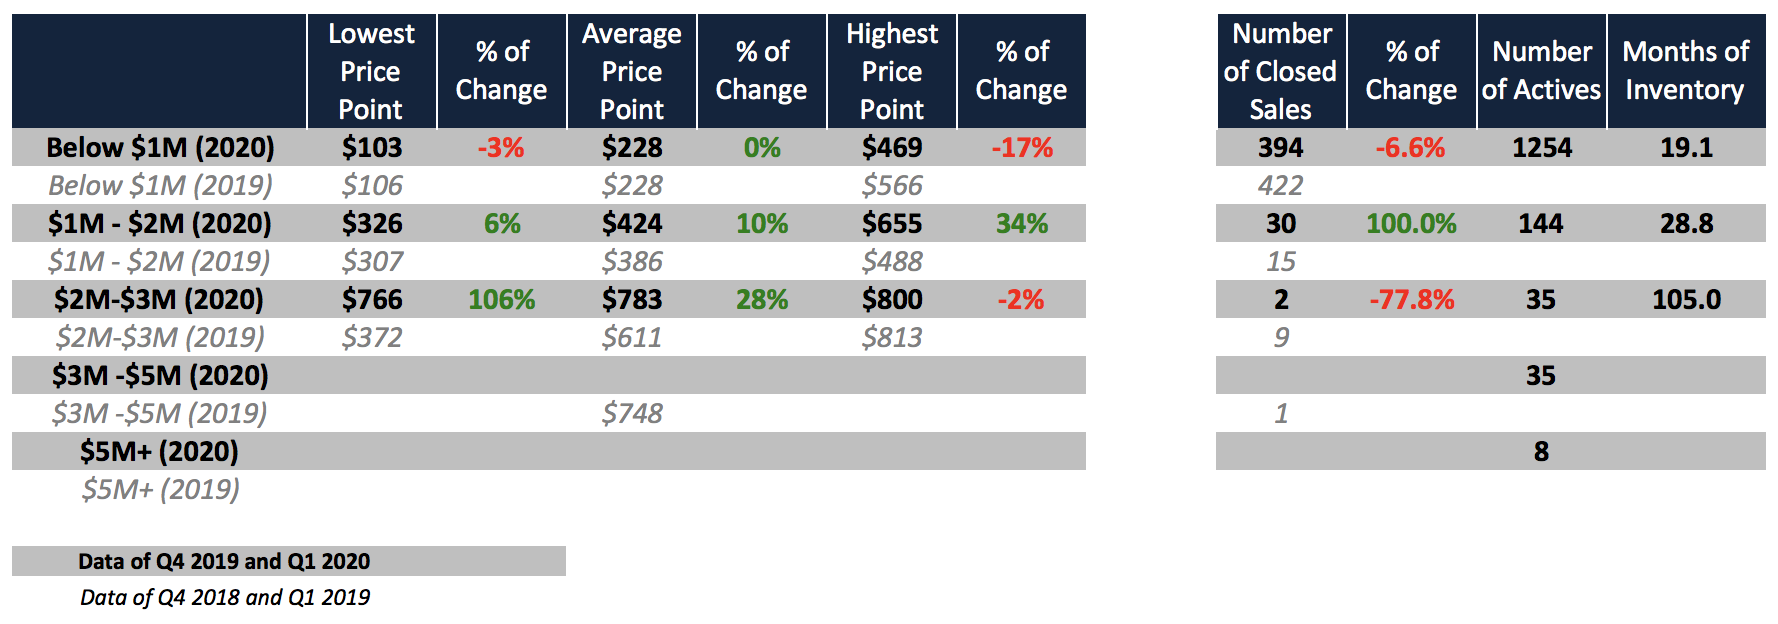
In this part (part 7) of the ‘Q1 2020 Miami Real Estate report’ we take a moment to delve into each and every single market, which means every neighborhood and every price point is covered. We ask ourselves: How did every Miami Neighborhood Perform in Q1 2020? We have also provided an overview table at the beginning to make it easier. Whether you are reading the report in full or just scanning in parts, this report is designed to be relevant to you and help you make a better decision on both buying and selling. Please bear in mind that this is really the opener to a bigger conversation, and I could have (if given the time) written pages and pages on each and every price point in each and every neighborhood! It will give you the framework of each market, but we don’t cover everything, so I would urge any reader to pick up the phone and call me: 305 508 0899.
If you are discovering this part of the full report first then please do go back and read the first 6 parts as these will also be very helpful. What I hope as a reader you do realize is that we have this incredible software that updates by the day and allows reports to work as evergreen material. So if you are reading this at the end of 2020 you will still find it highly valuable, as the software we use to generate the stats will be updating every quarter. So, let’s now dive in and understand the market movements of Q1 2020 for the Miami Real Estate Market!
How did every Miami Neighborhood Perform in Q1 2020?
Coconut Grove Homes and Condos in Q1 2020
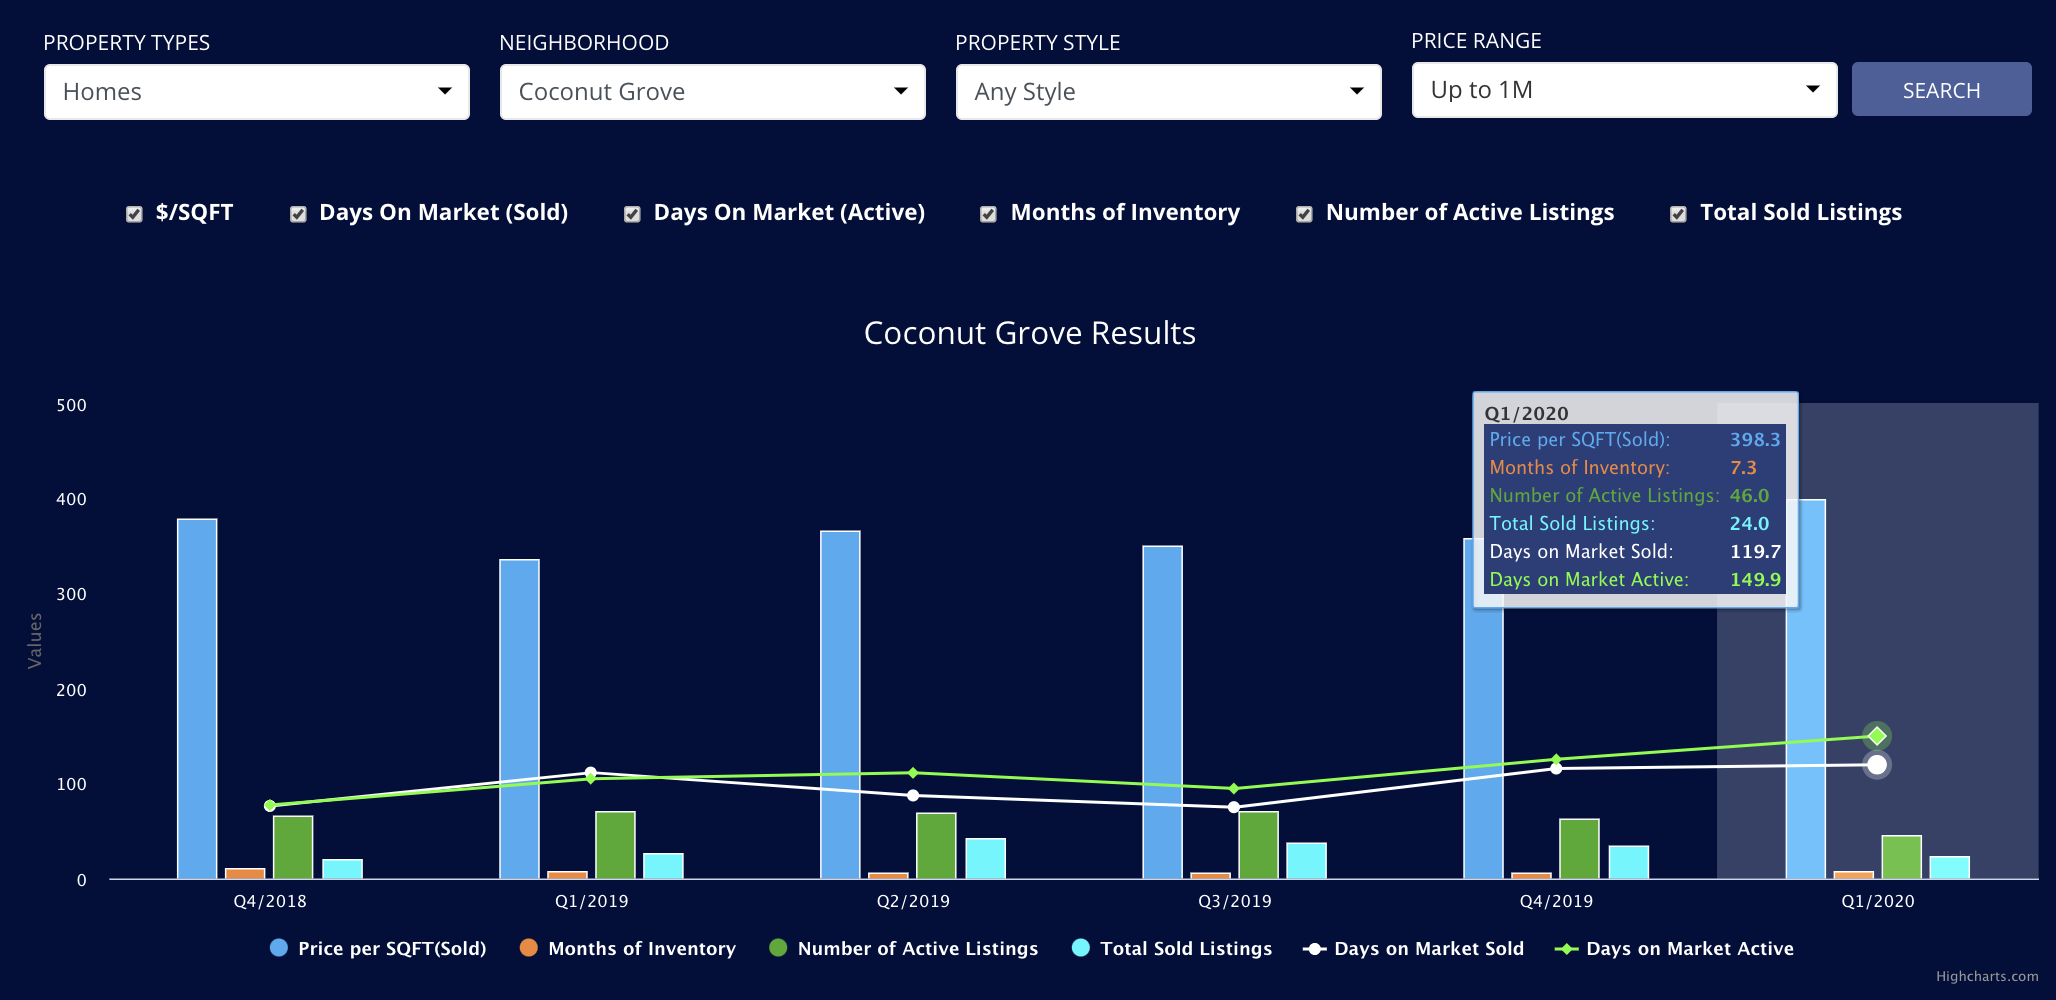
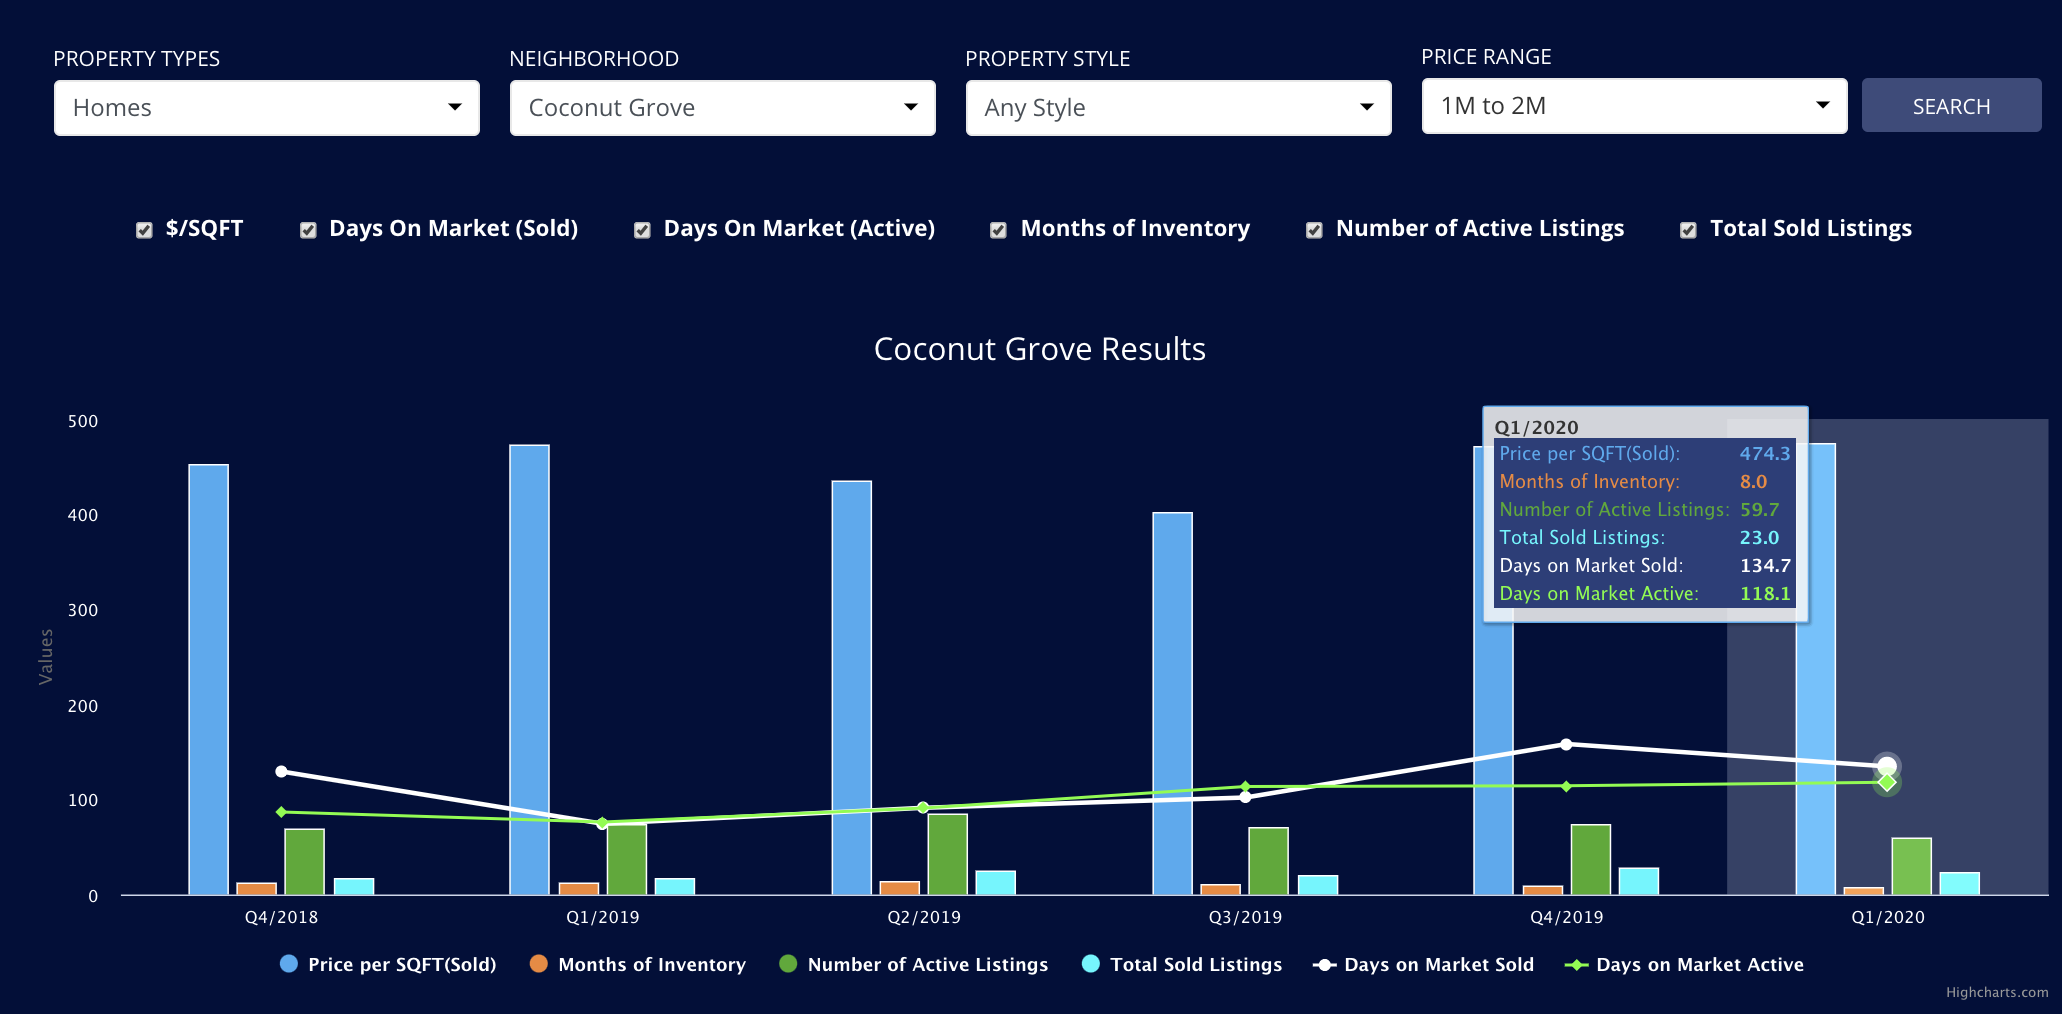
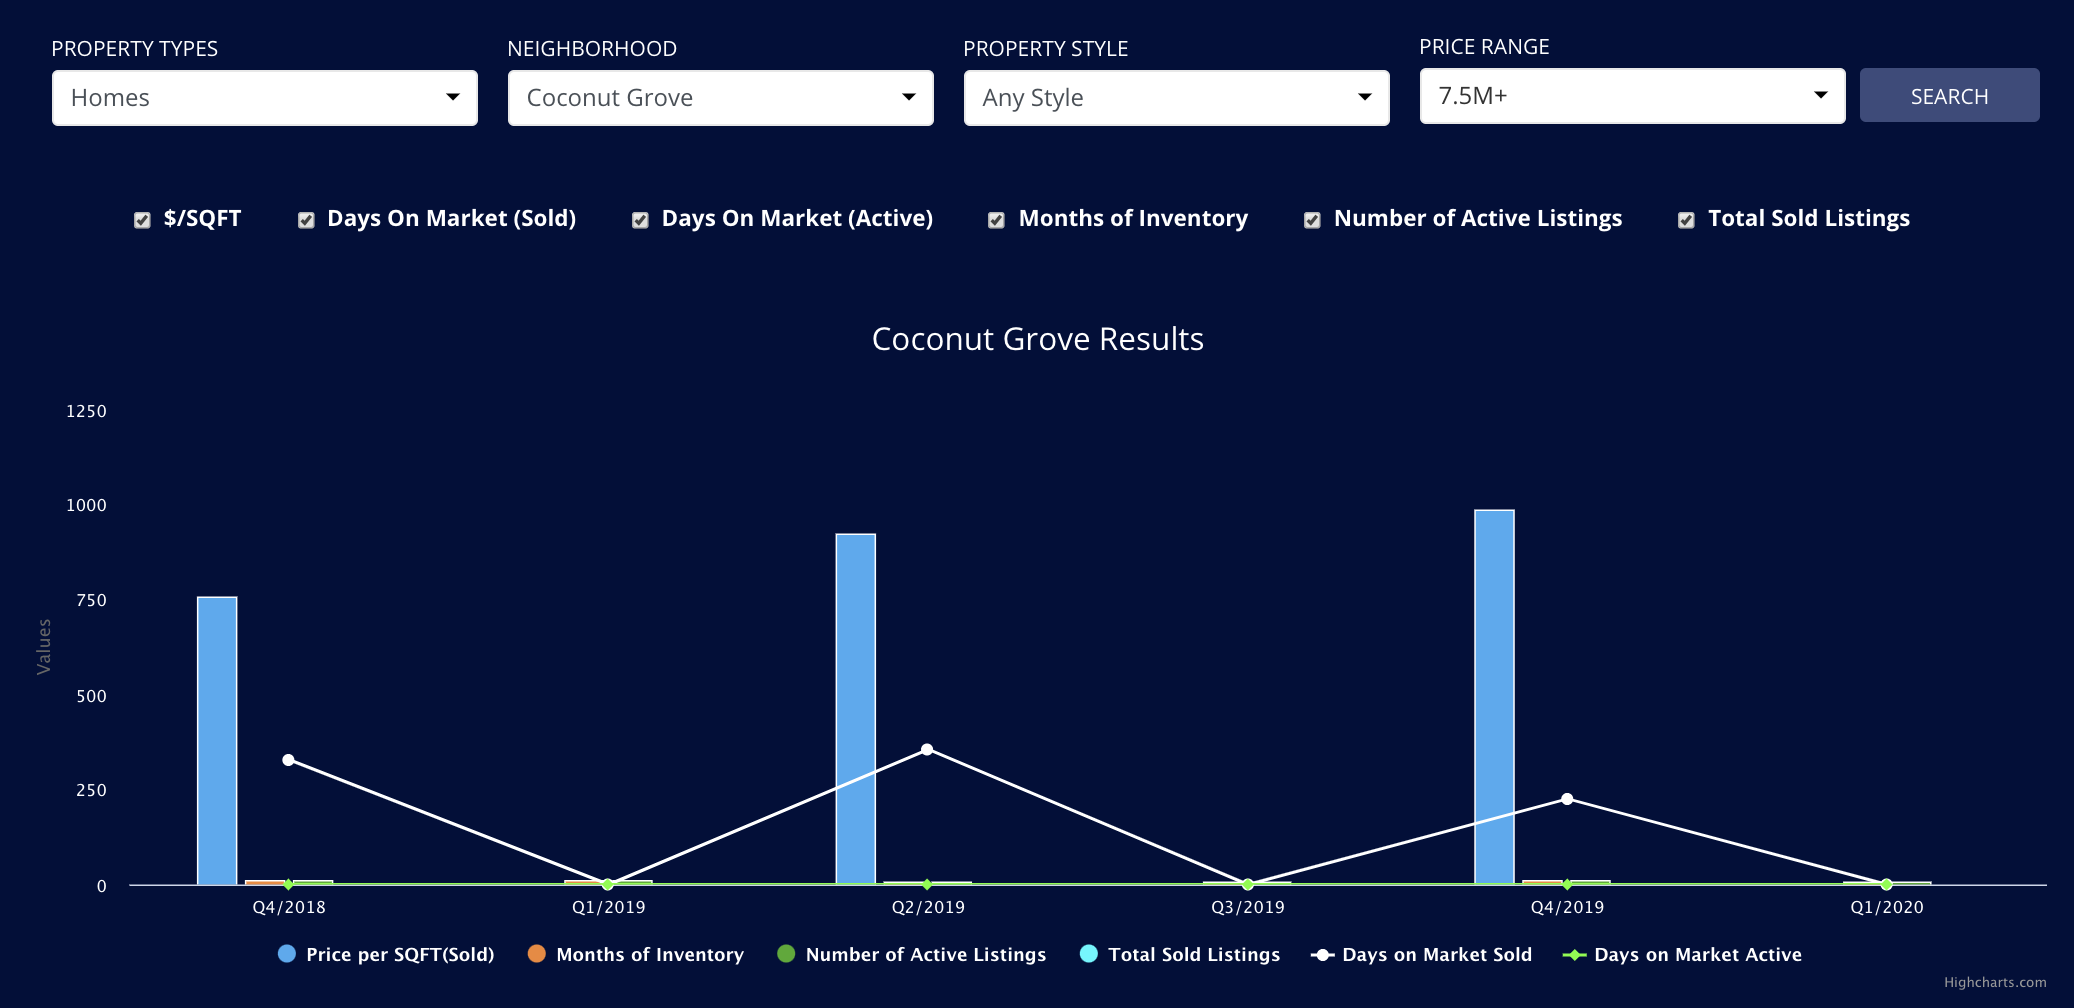
Single family home sales not only looked steady, but performed better than in 2019. The $0-$2M price range performed very strongly. To read more about the strength of this price point please refer to part 1 of the report where we cite Coconut Grove as one of the strongest markets in Miami. It is worth mentioning that the townhouse market in Coconut Grove is absolutely booming. If you are a potential seller of a Grove townhome, please, please call me!
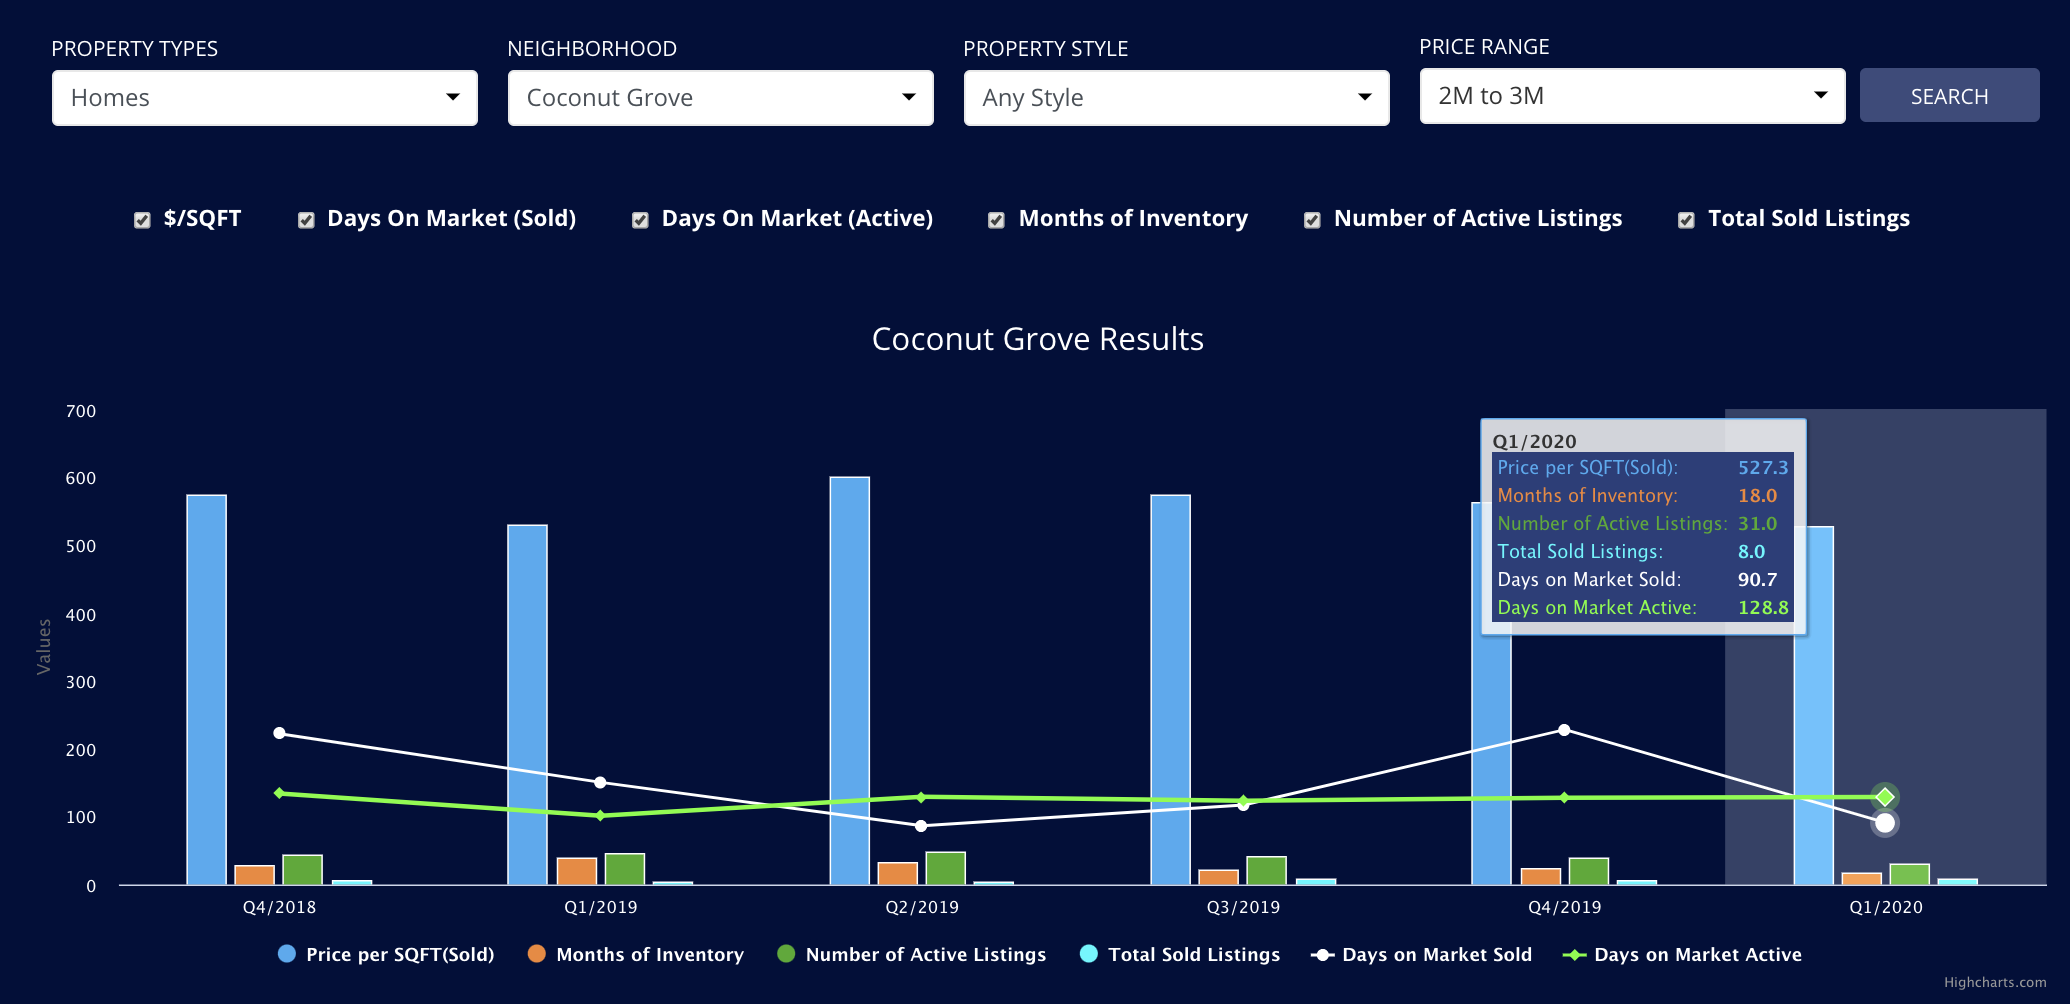
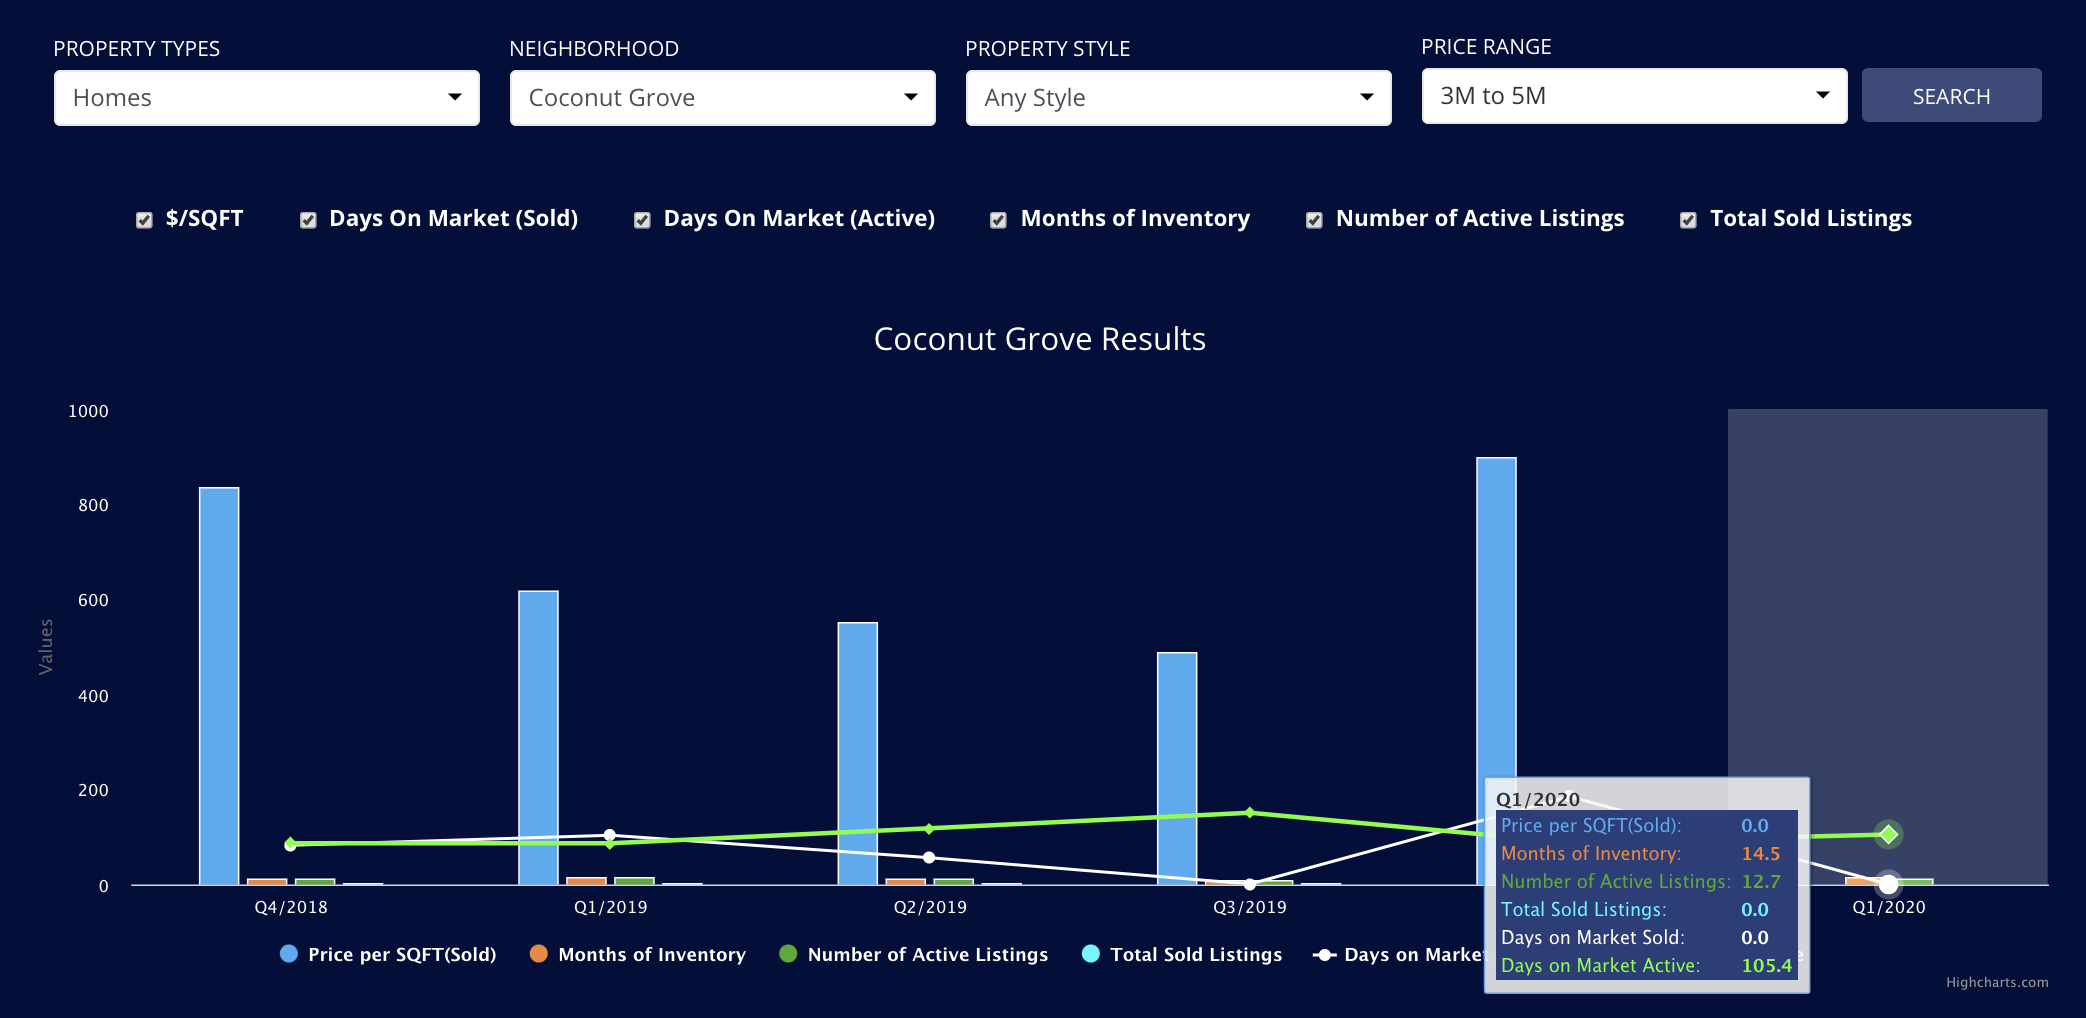
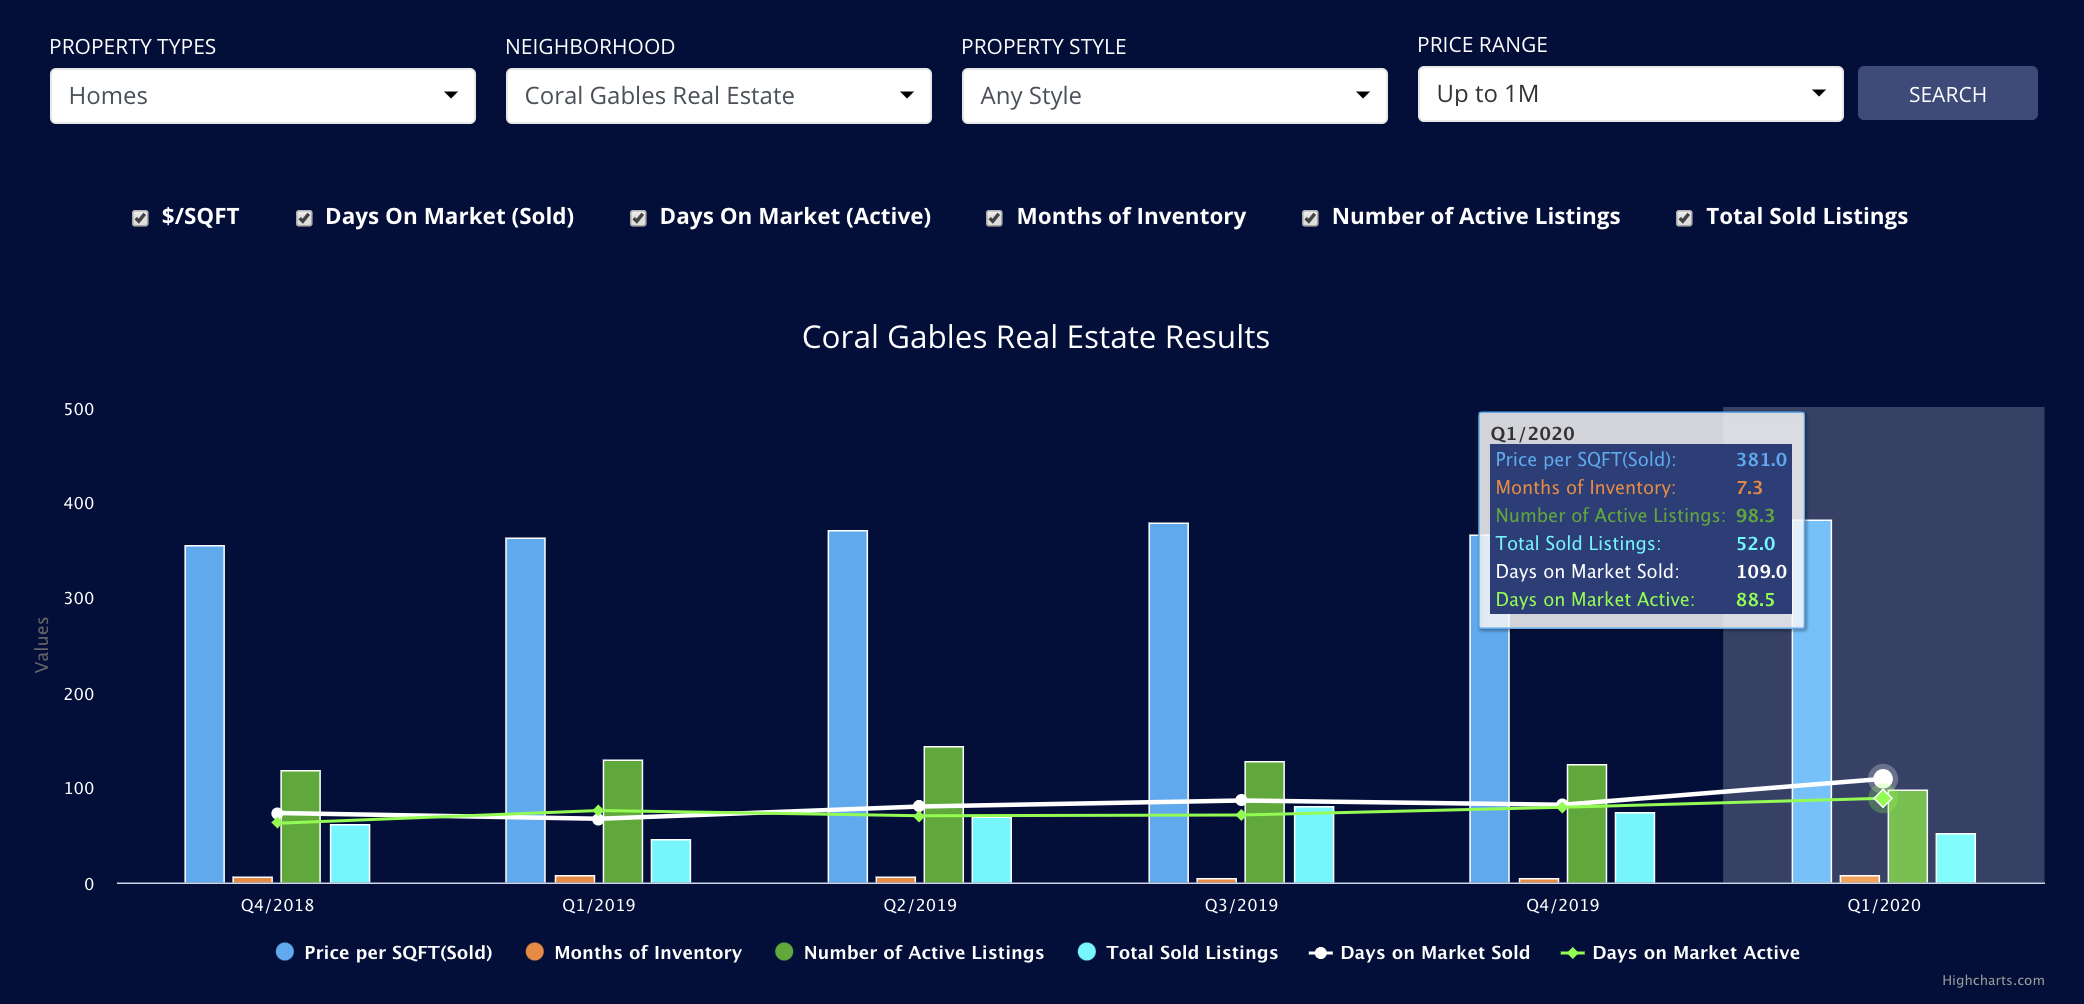
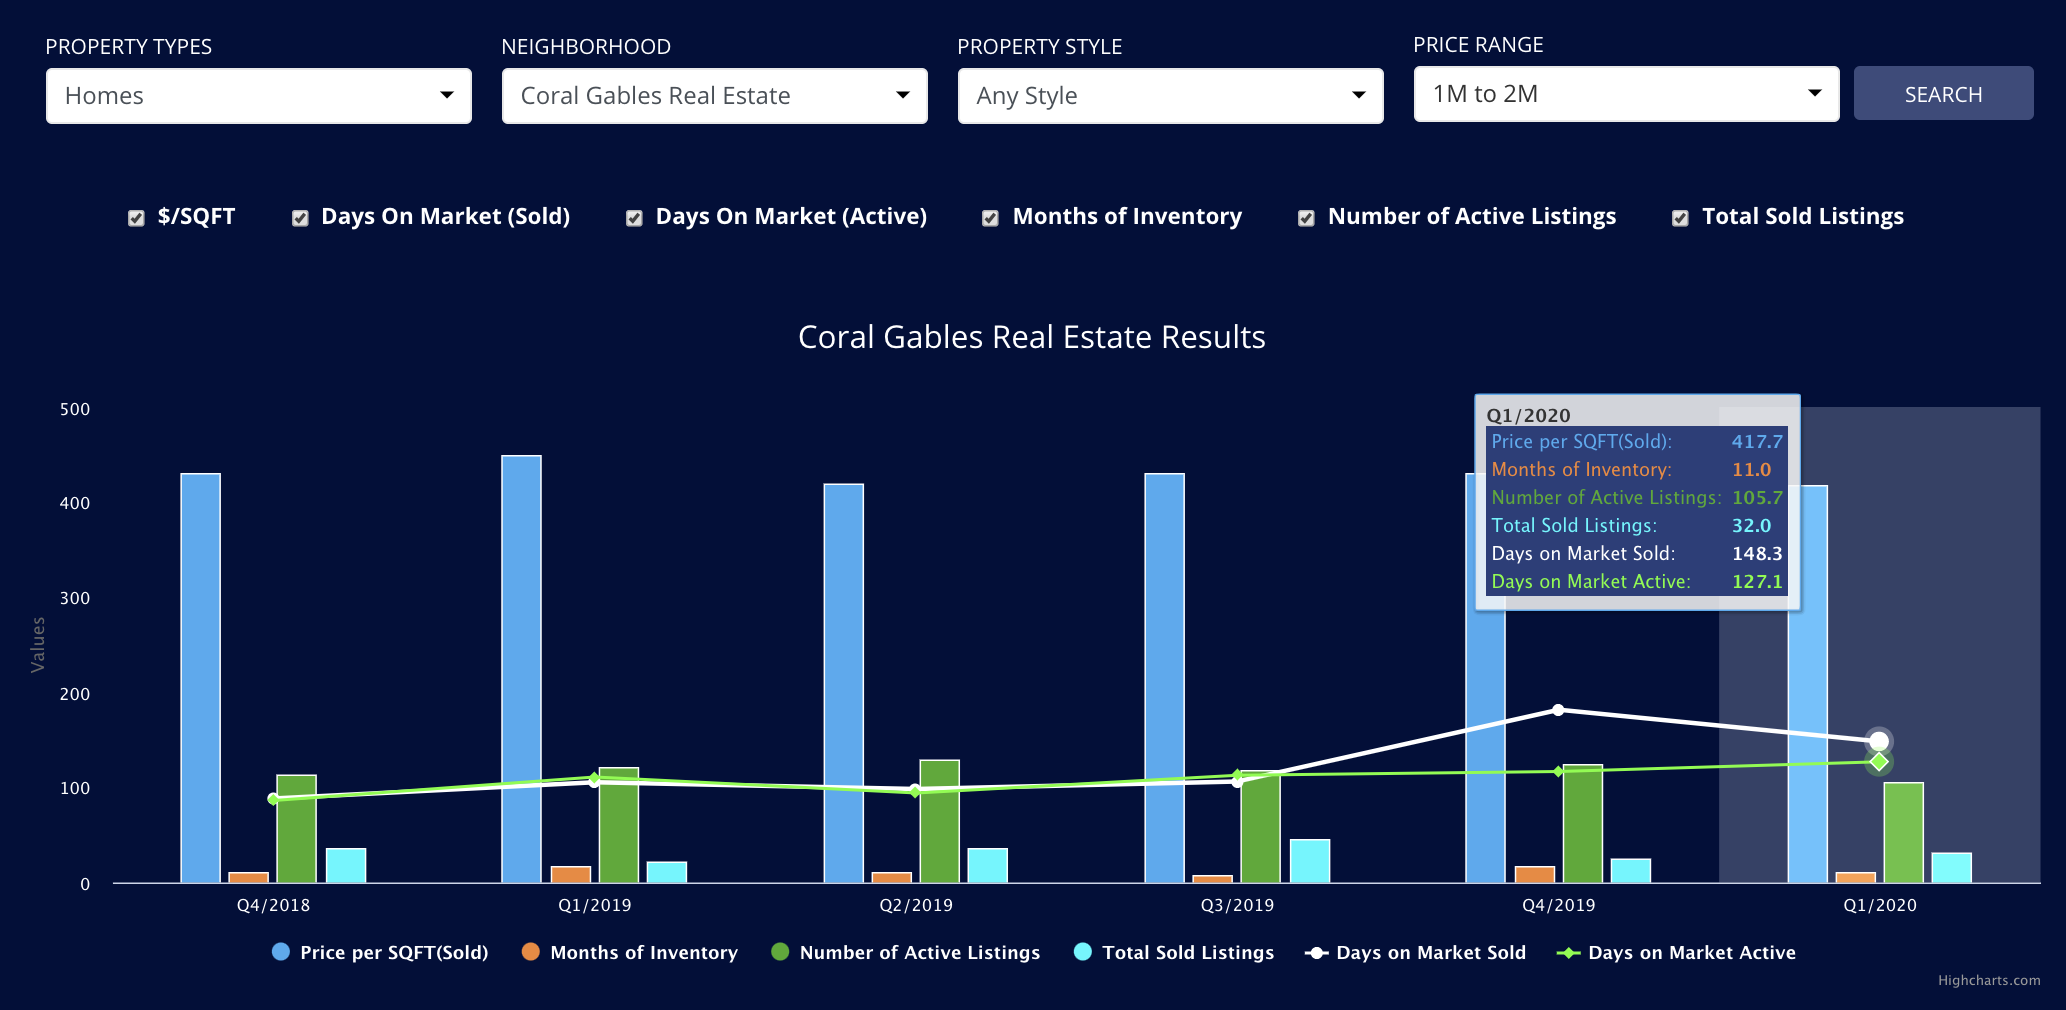
The $2m – $3m range has been a little different. Q1 2020 was a reflection of Q1 2019. The average price per sqft was $529, which pretty much replicates the year before. Days on the market for sold listings is at 90 days and current average days on the market for active is at 127 days. What does this mean? I believe that although there are fewer $2m – $3m homes available for sale in the Grove the 31 listings that are for sale have been typically sitting there for 4 months, they are becoming stagnant and are less desirable. Any new listings that really ‘hit the mark’ are not likely to stay on the market very long. The demand is there, but the quality of homes are not. No sales in the $3-$5m range for Q1. The $2m+ market is driving strongest in Coral Gables. Visit our advanced analytics page here.
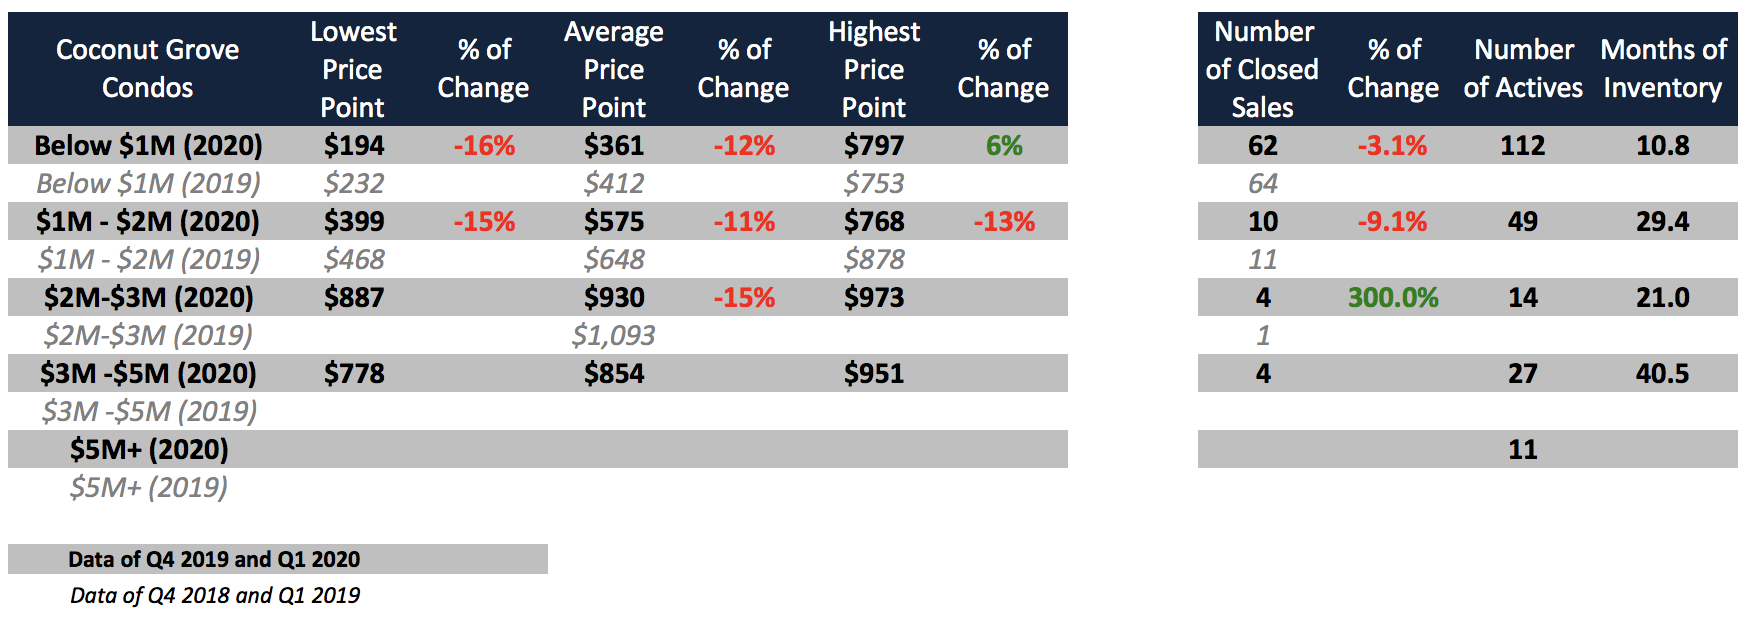
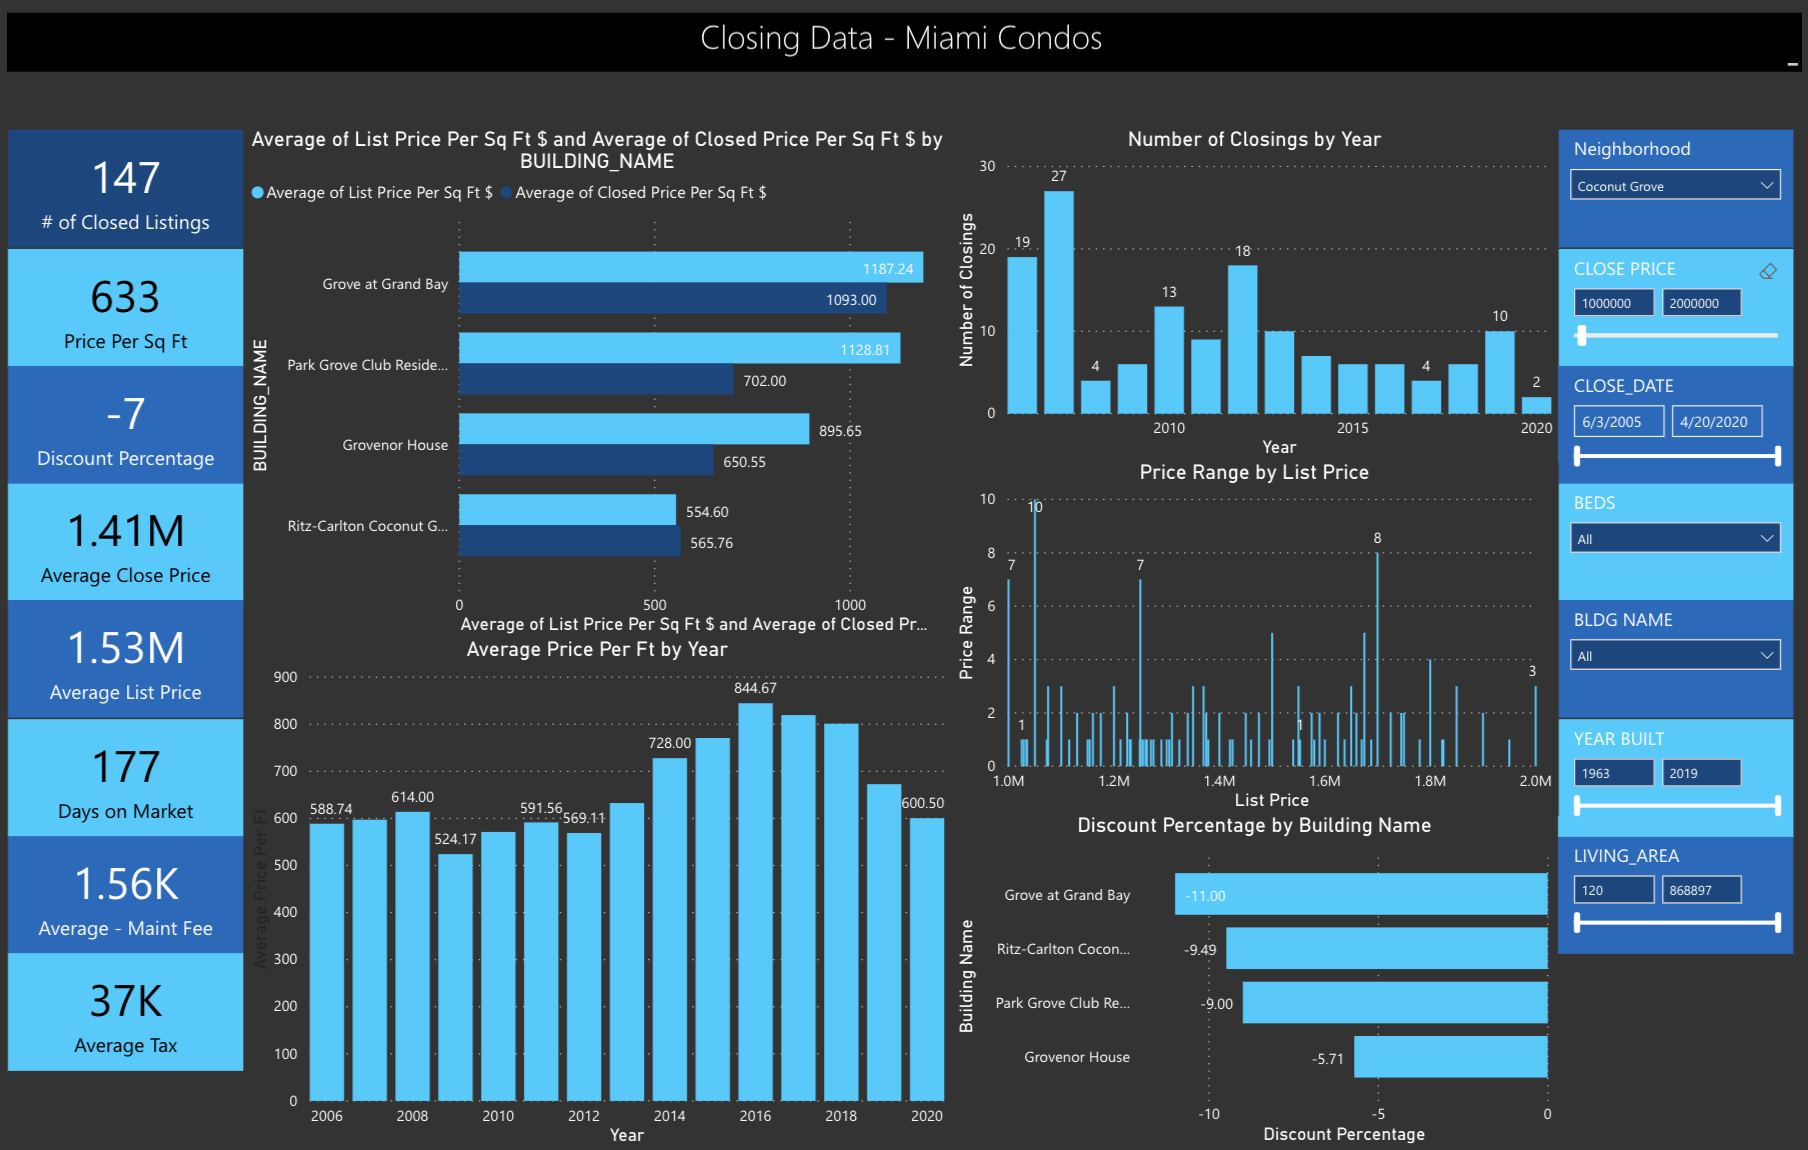
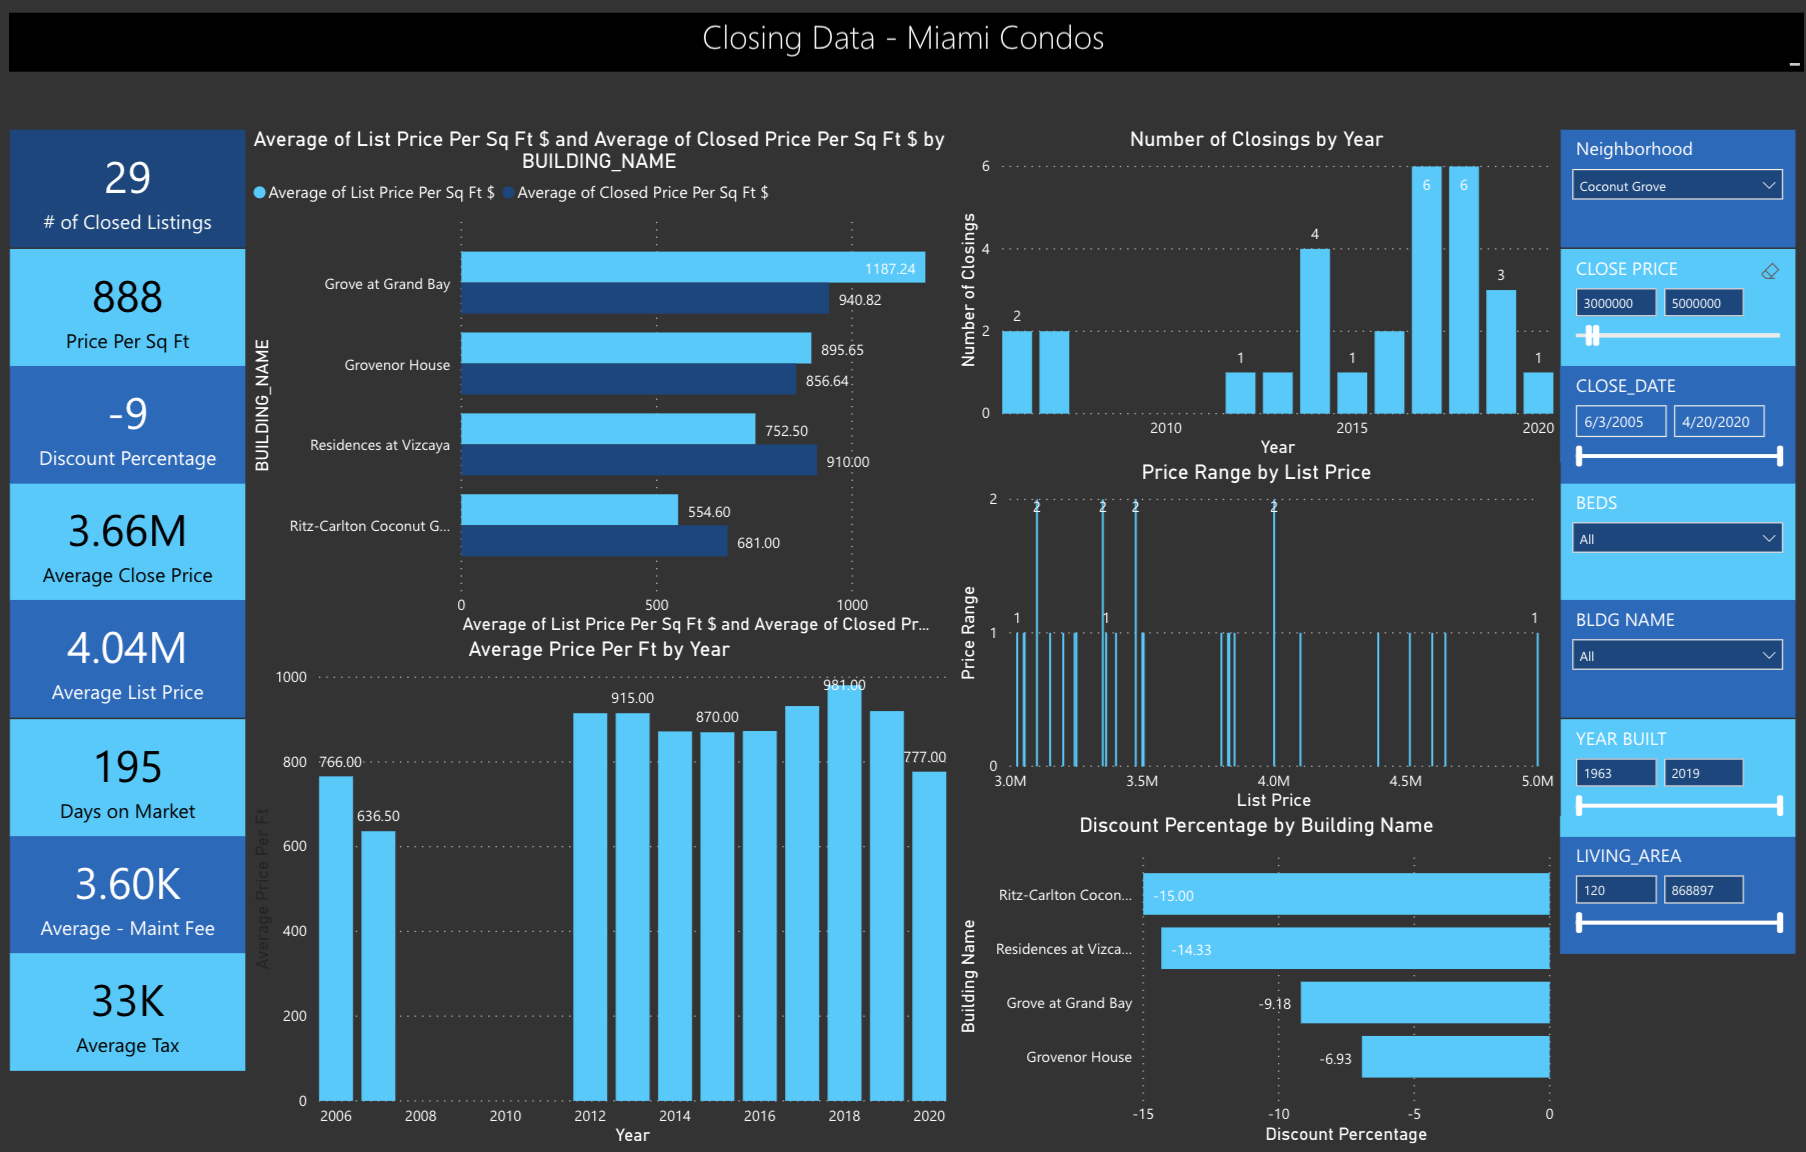
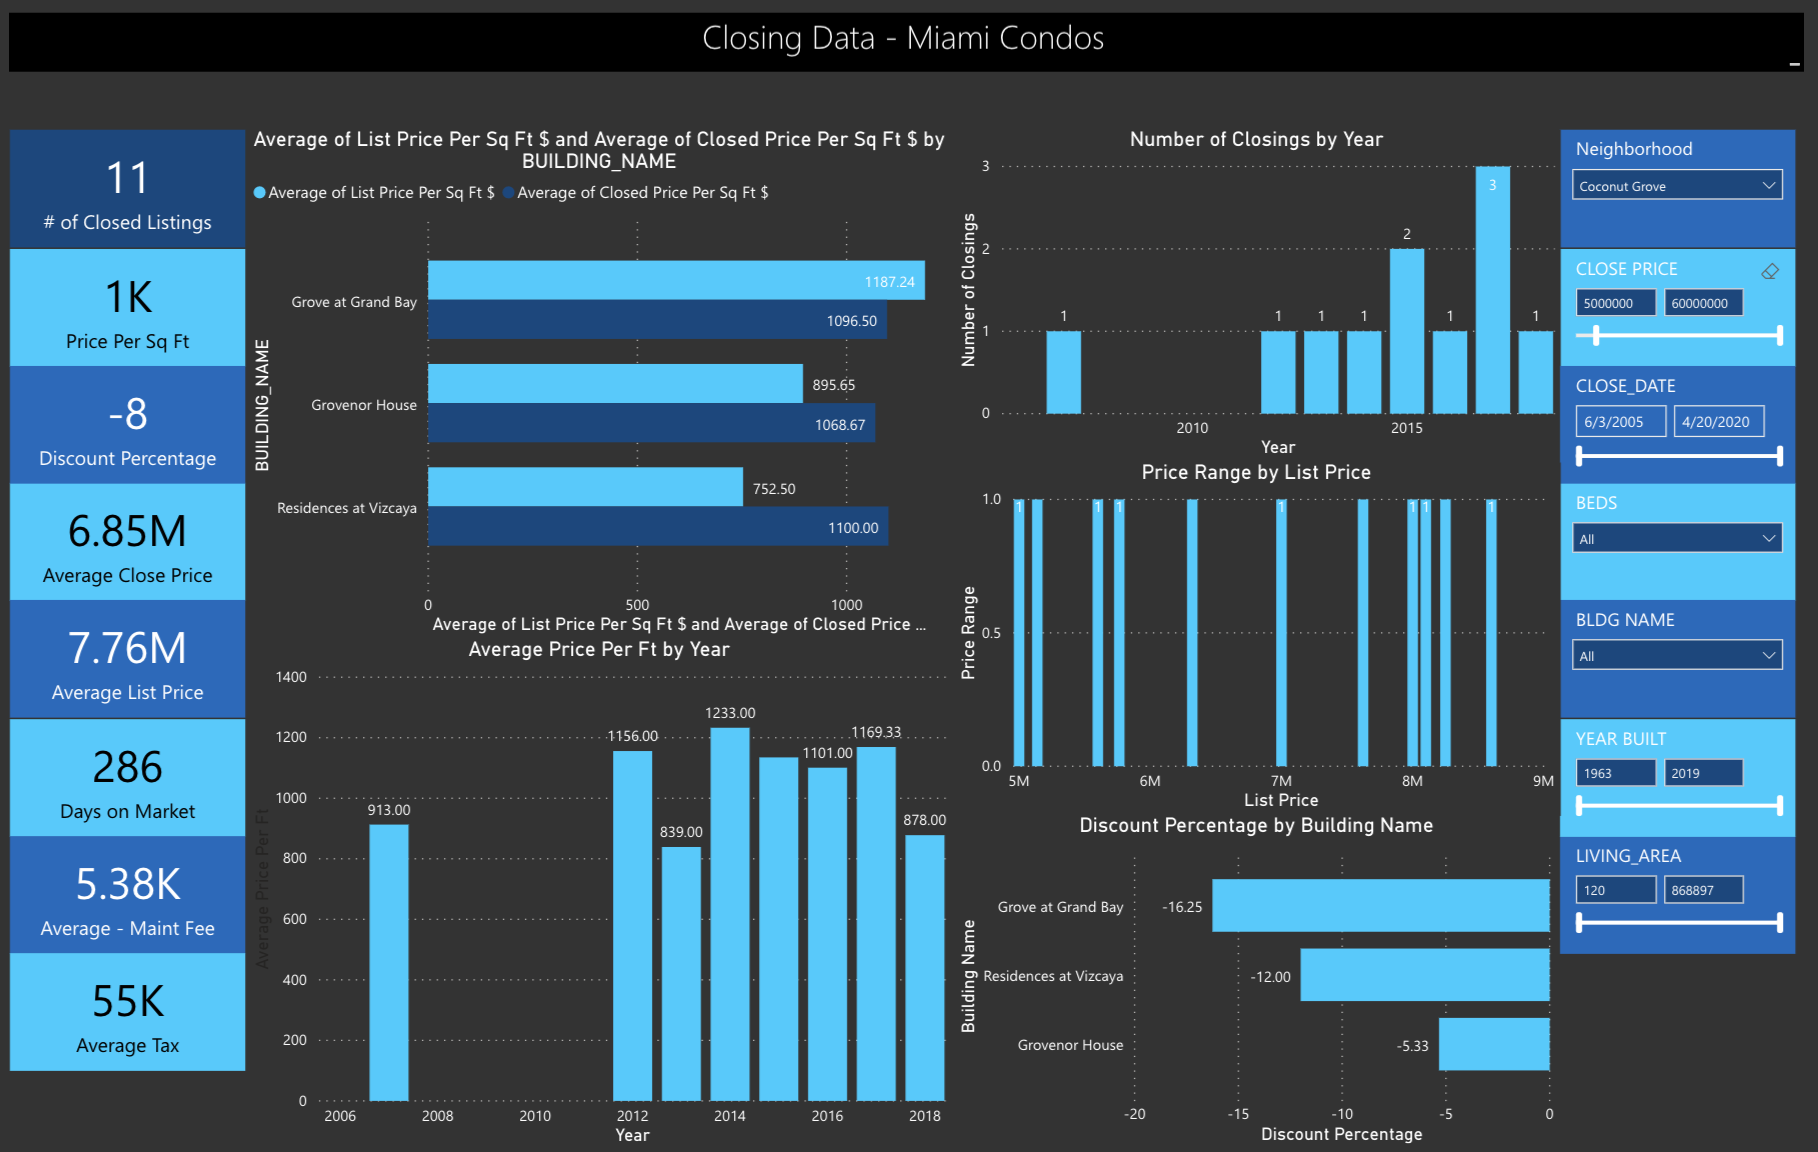
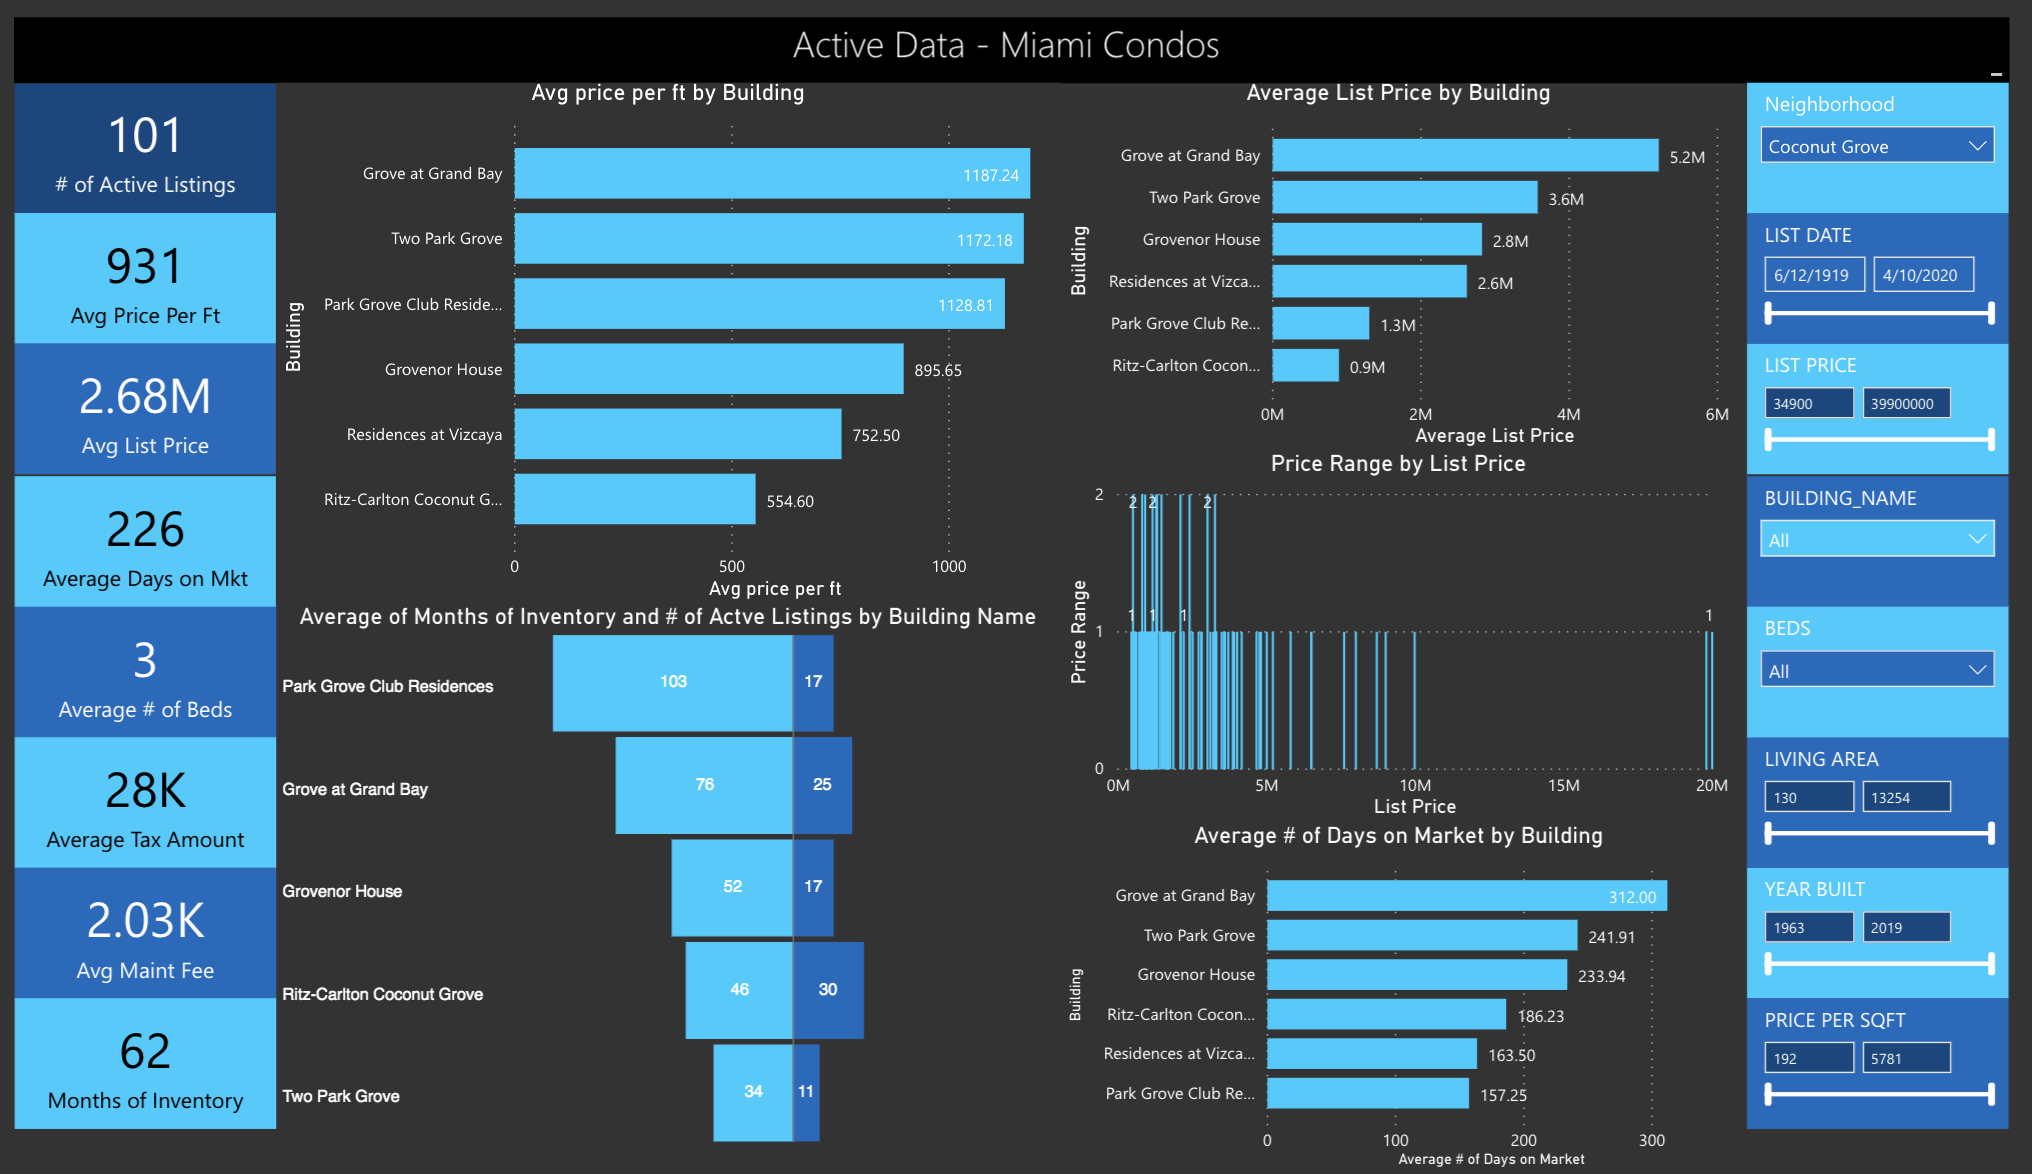
What about Coconut Grove Condos? Q1 2020 sales were pretty much on par with 2019, and with 62 months of inventory and an average 226 days on the market for active listings this spells a very weak market and generally speaking a further predicted drop in prices. The Ritz Carlton Residences has the best traction in the market right now. Park Grove Tower 3 (Club Tower) and Grove at Grand Bay are the two buildings with the slowest absorption rates, which means they should be the two buildings most suitable to vulture deals.
Coral Gables Homes in Q1 2020
Once again the single-family homes market of $0 – $2m is performing extremely well. Please refer to part 1 to read more about this price point in this market or visit our advanced analytics page.
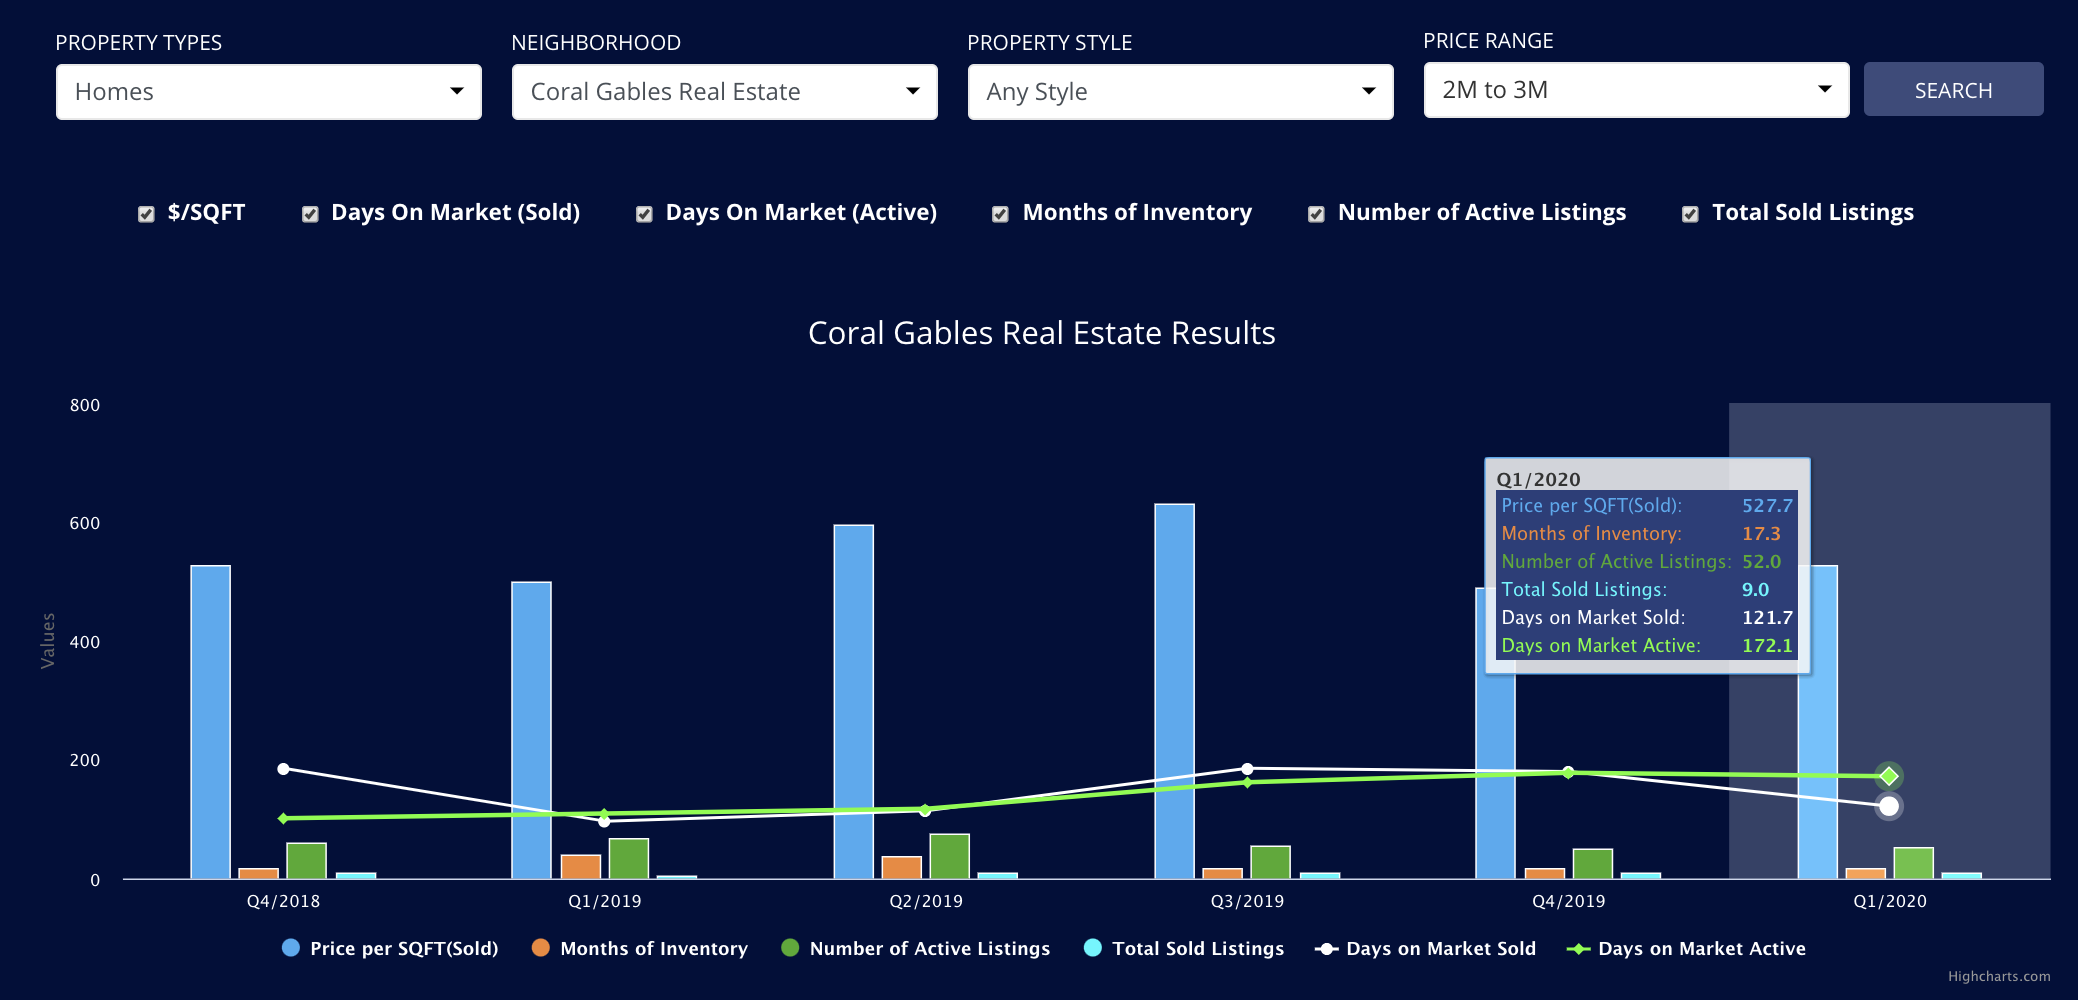
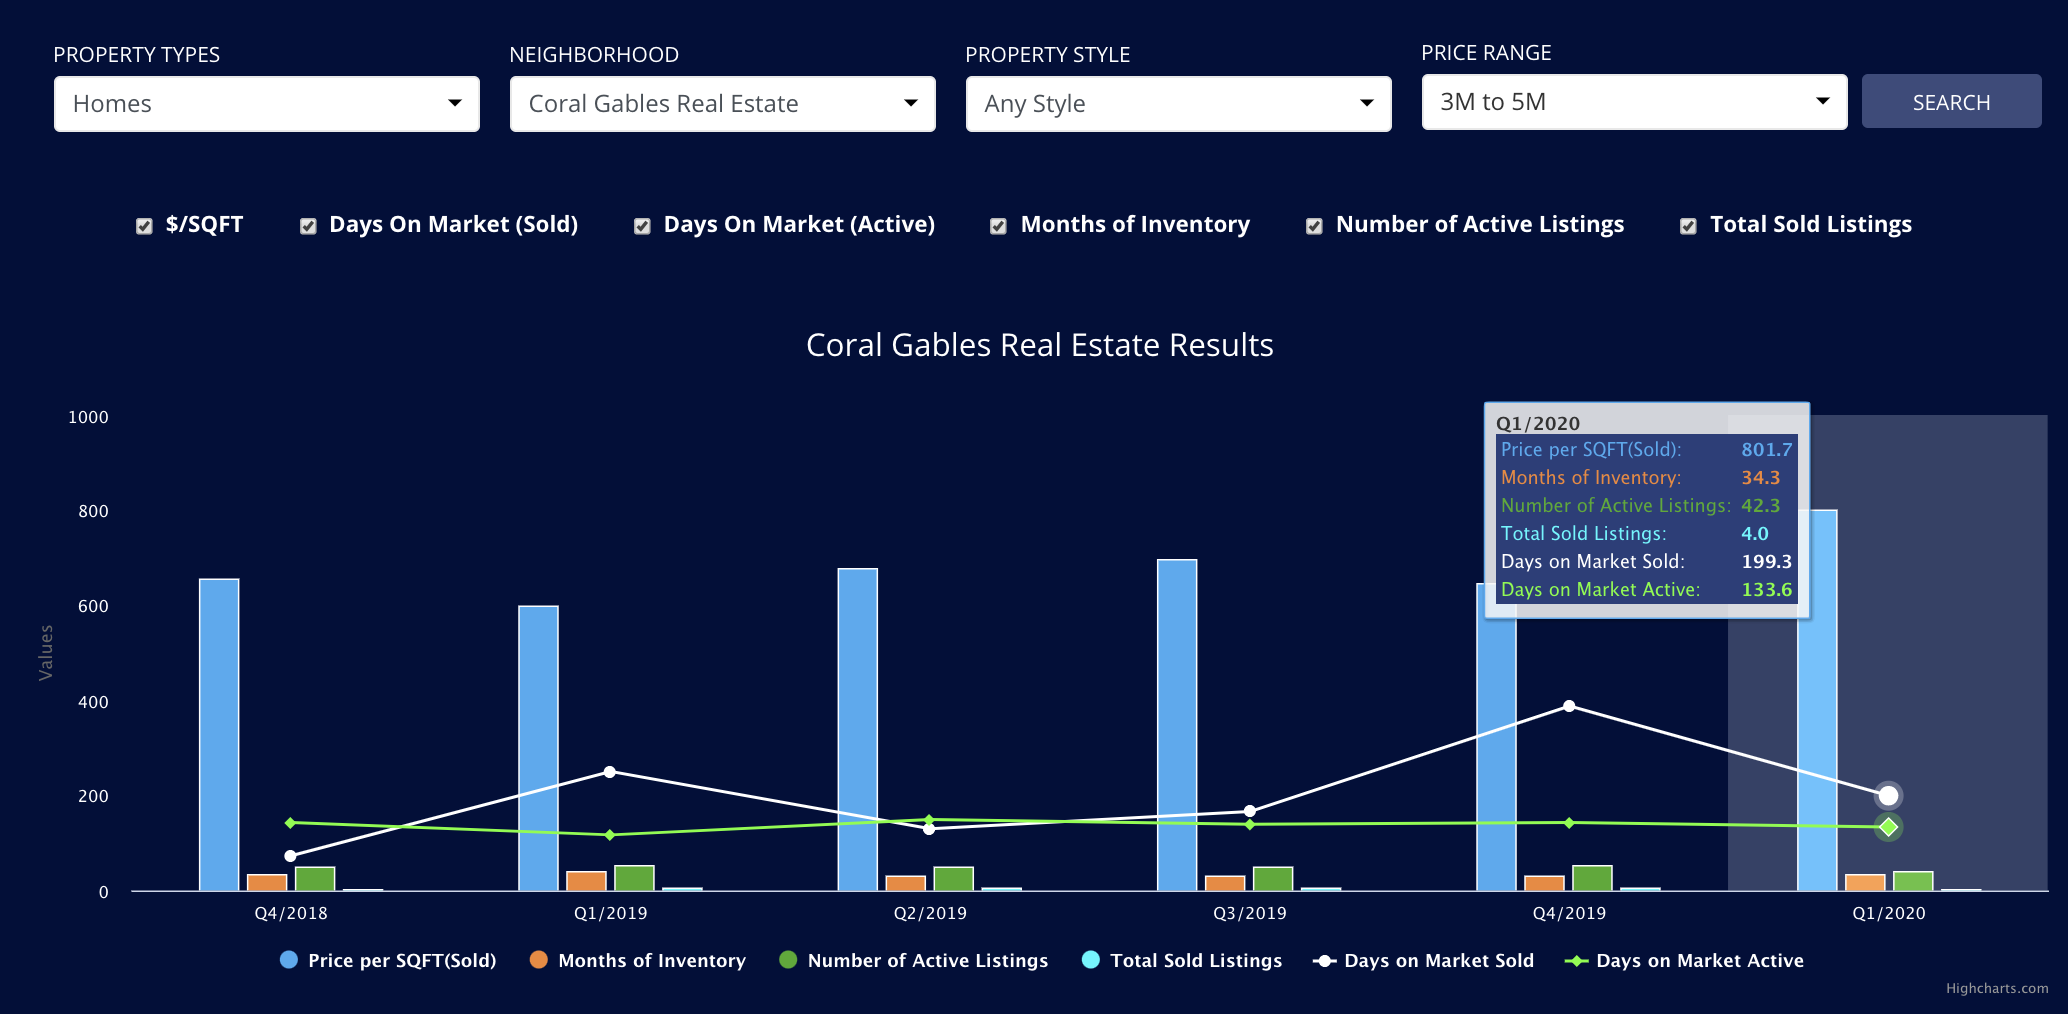
The $2m – $3m range in Coral Gables has definitely performed better in 2020 than it did in 2019 with 9 sales at an average of $527 per sqft (In Q1 2019 it was 5 sales at an average of $500 per sqft). The $3-$5m range remains stable with an average $801 per sqft across the 4 sales. What is interesting is that in Q1 we saw the highest price per sqft in two years. For more information visit our advanced analytics page.
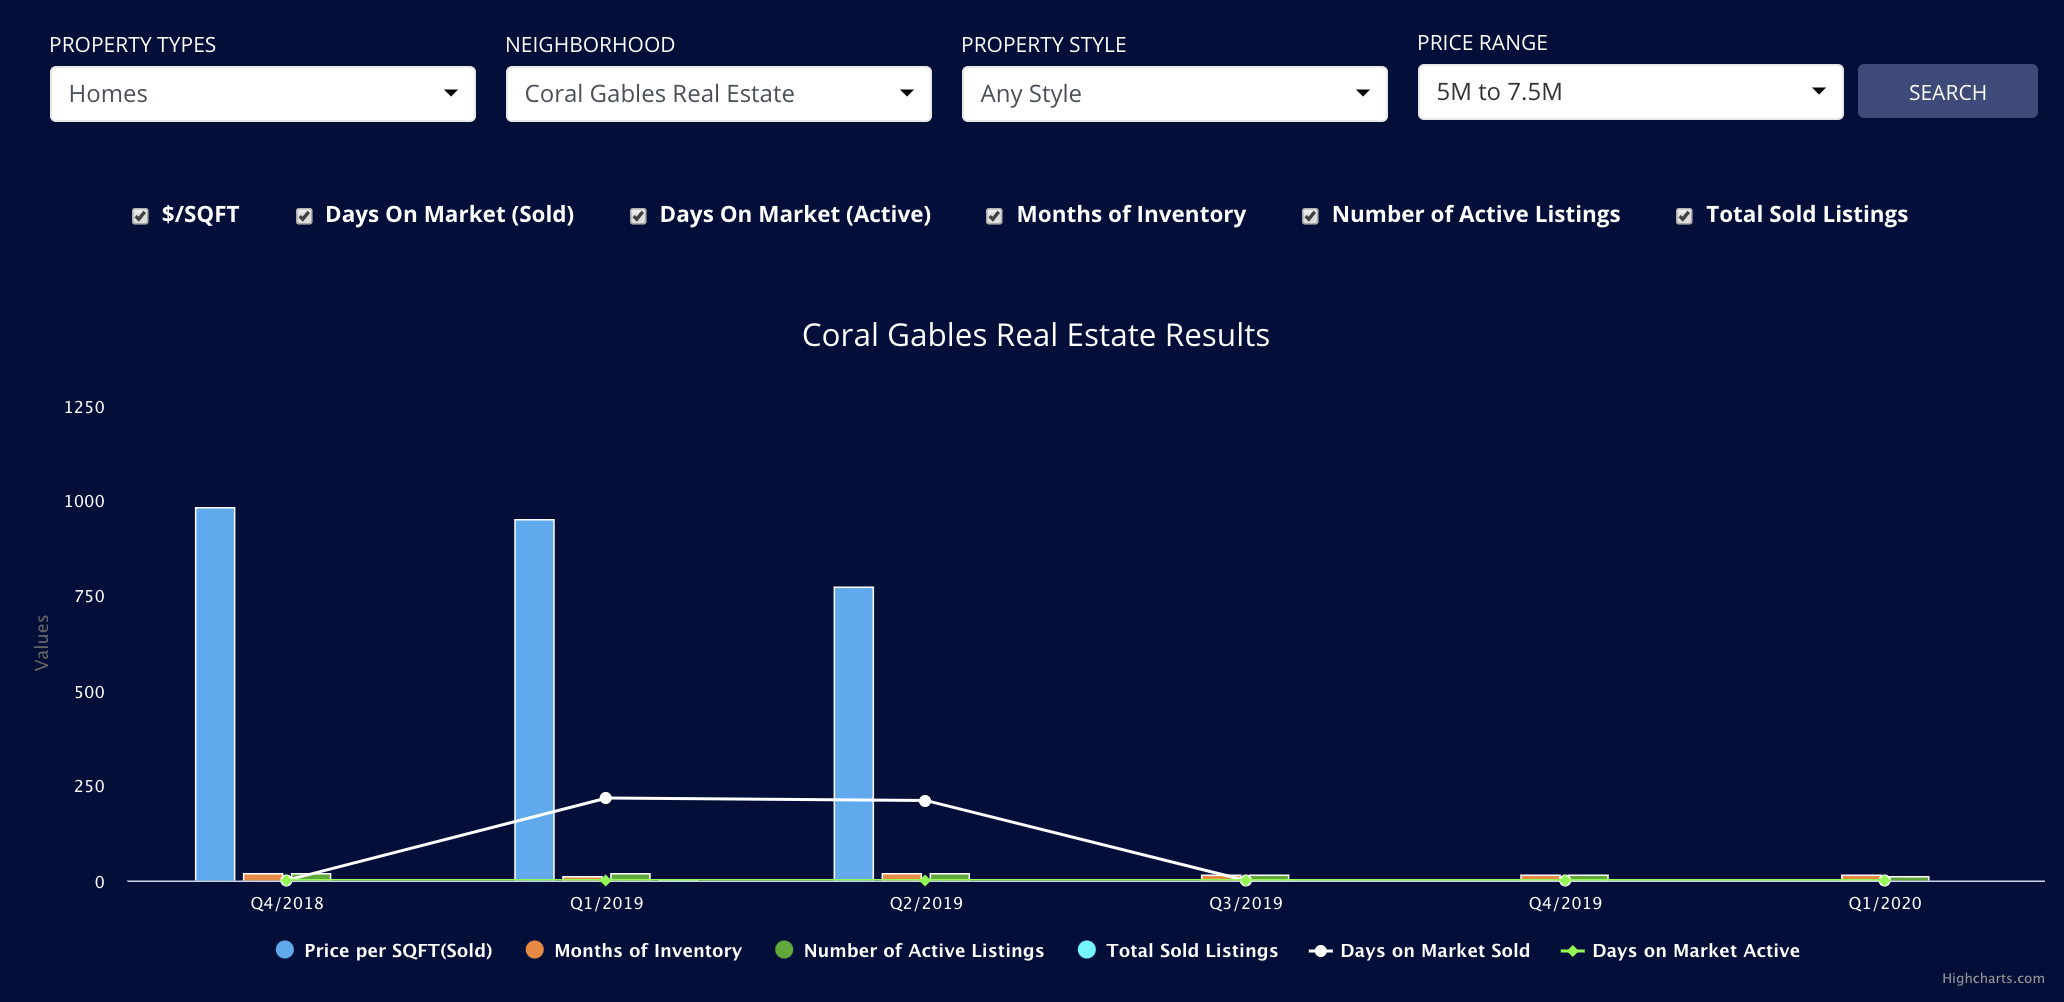
What about waterfront sales in Coral Gables? Coral Gables Waterfront homes are a focus for luxury home buyers. As of the 15th April there have been 6 sales. We have 6 pending sales over $6,000,000, 4 of these are over $15,000,000 in Coral Gables, and two of those 4 are over $40,000,000! It’s staggering to see the focus on Coral Gables waterfront homes.
Key Biscayne Homes and Condos Q1 2020
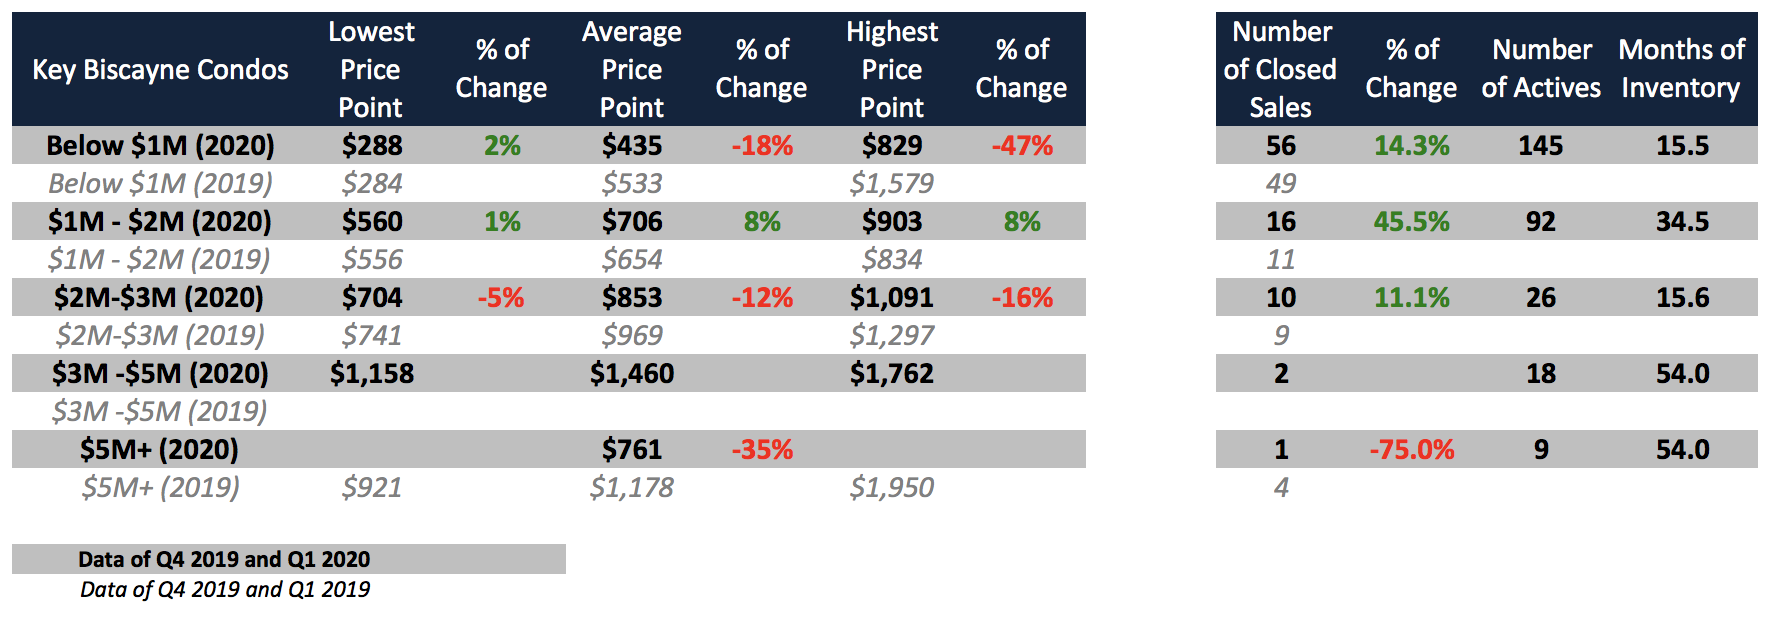
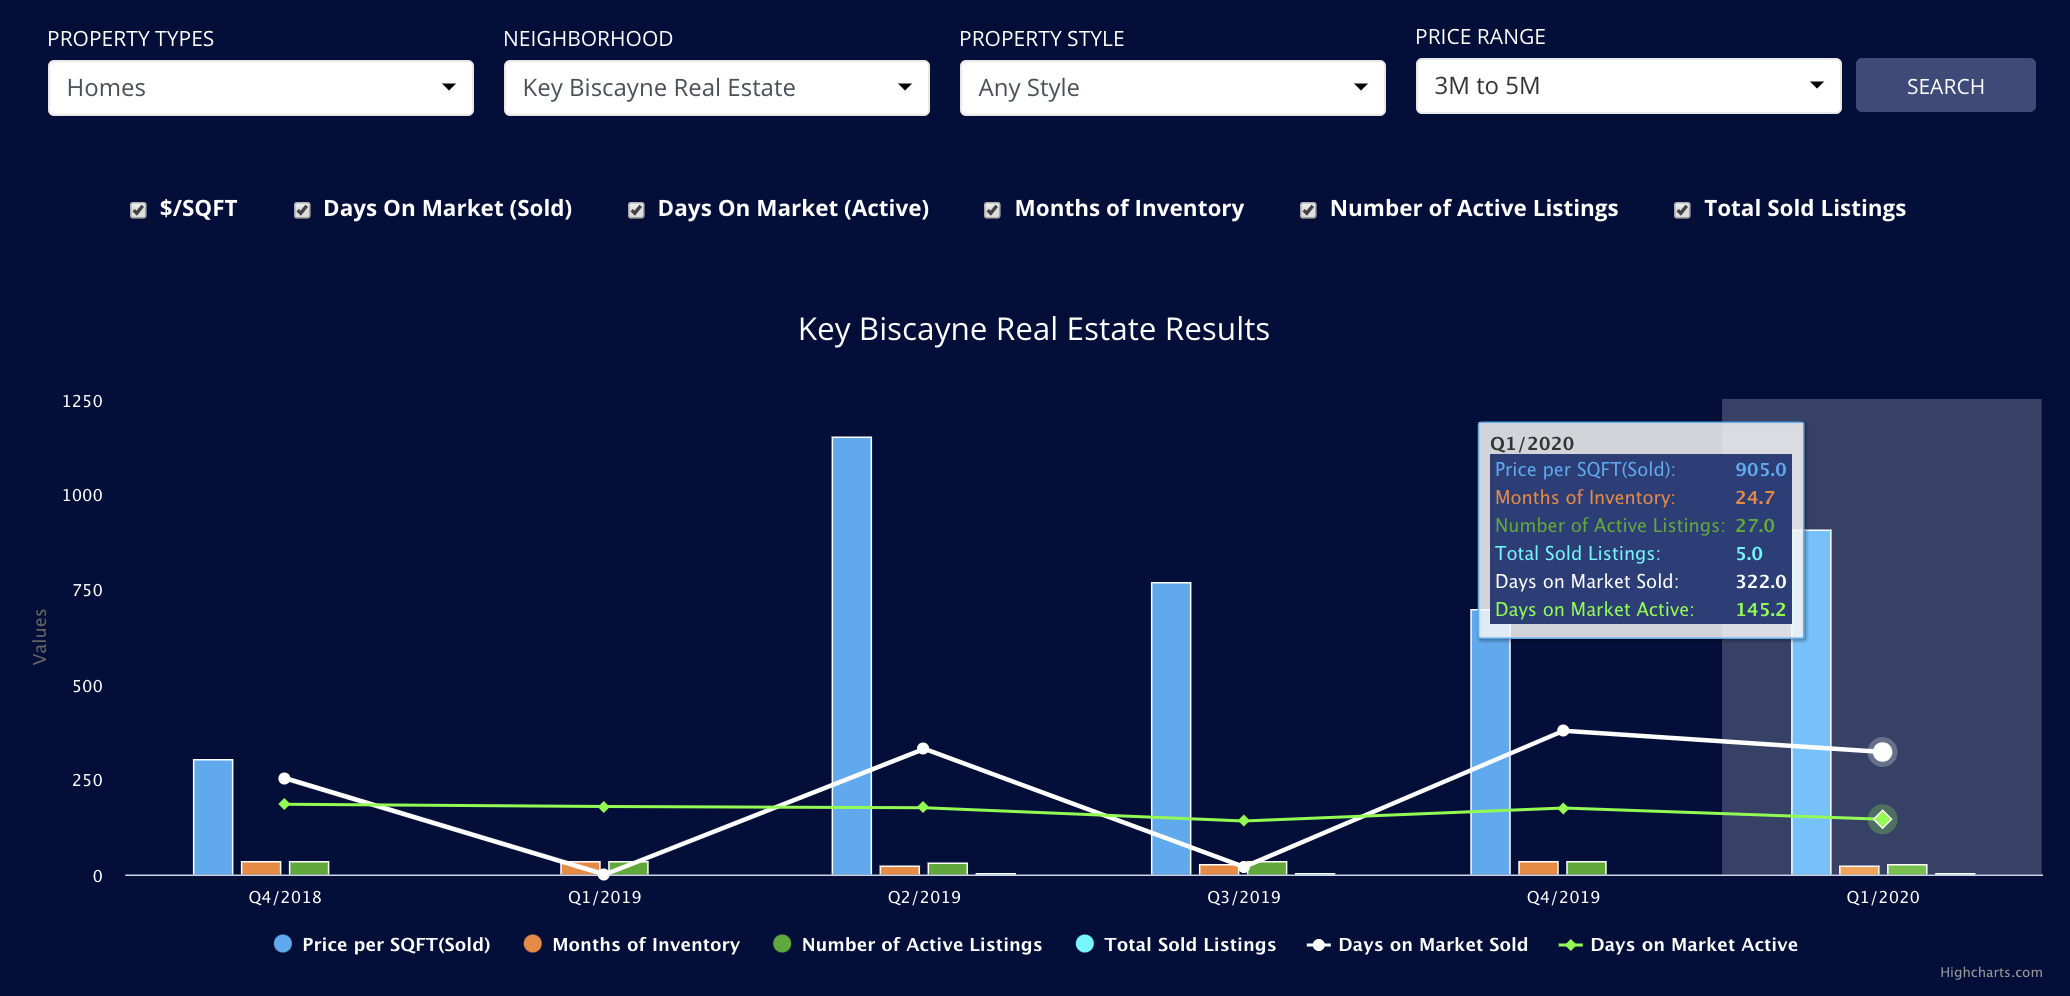
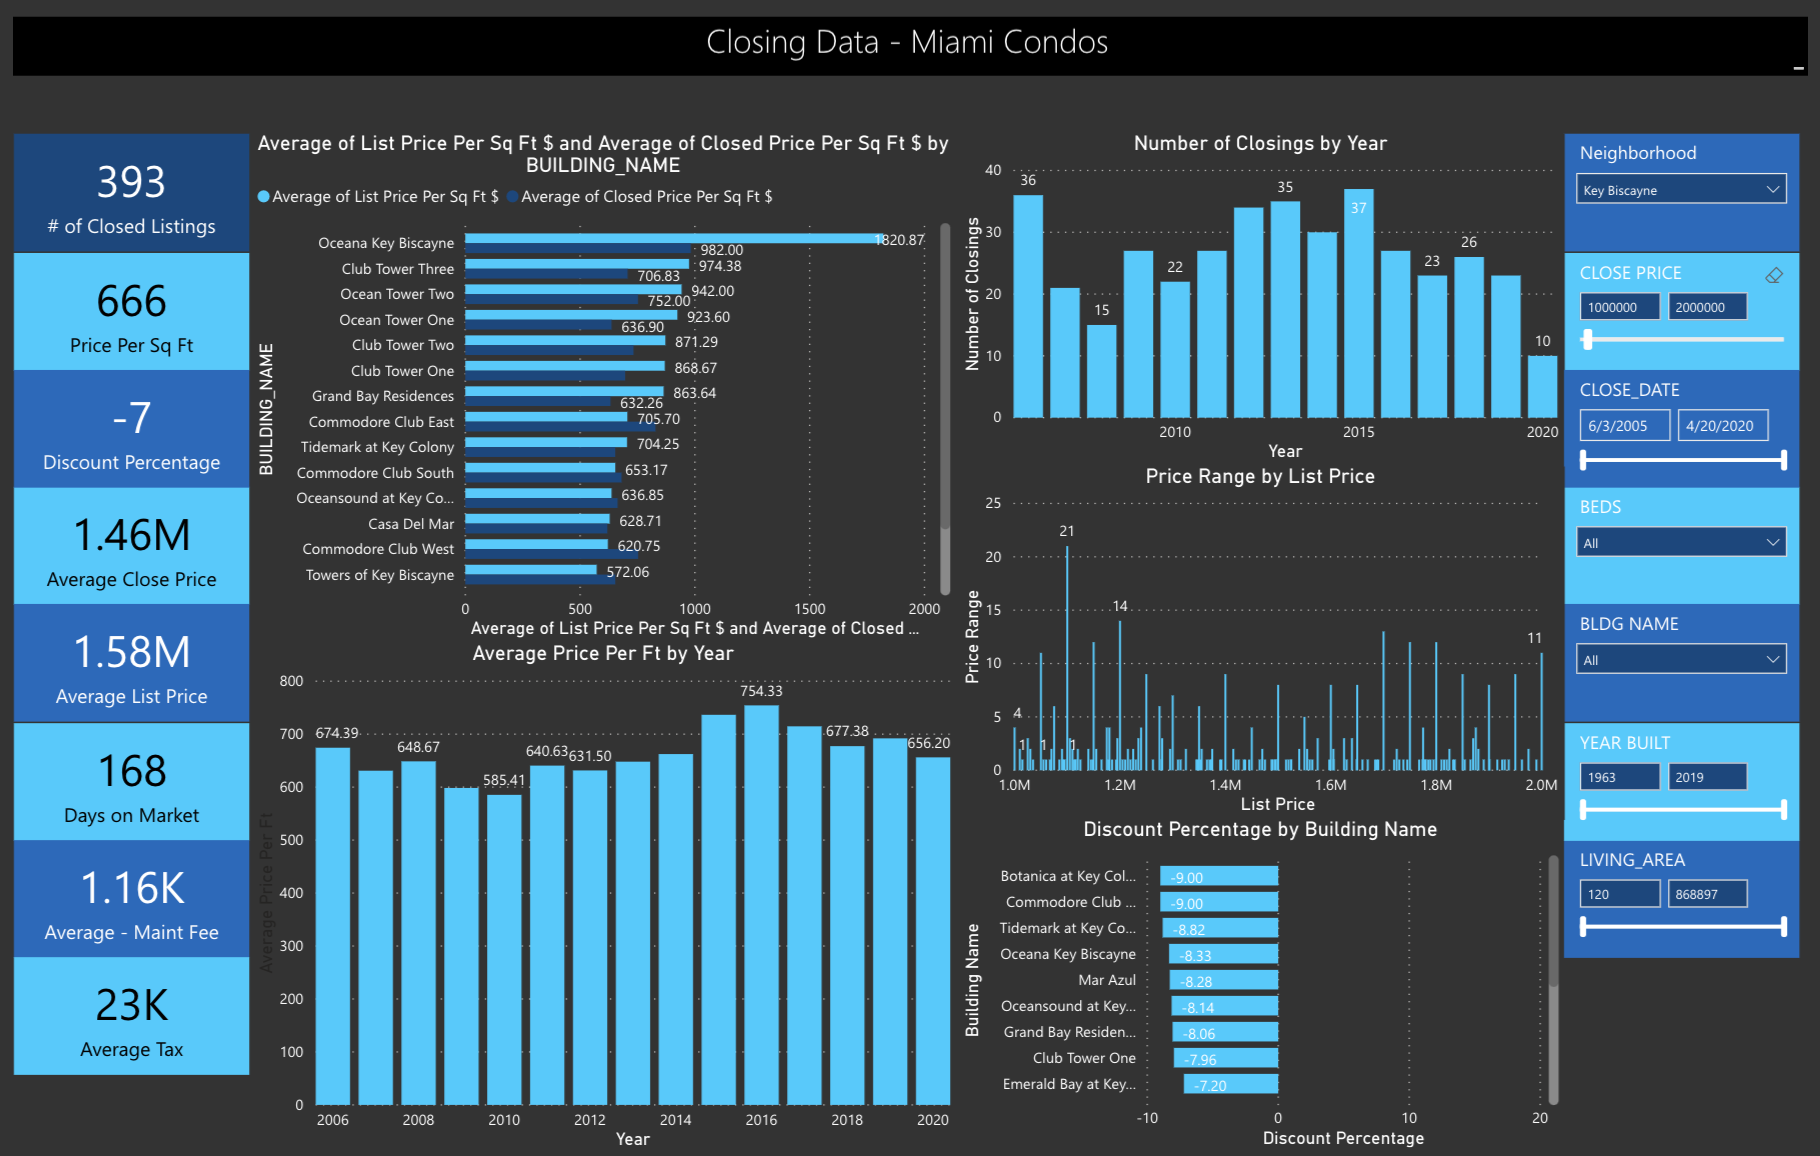
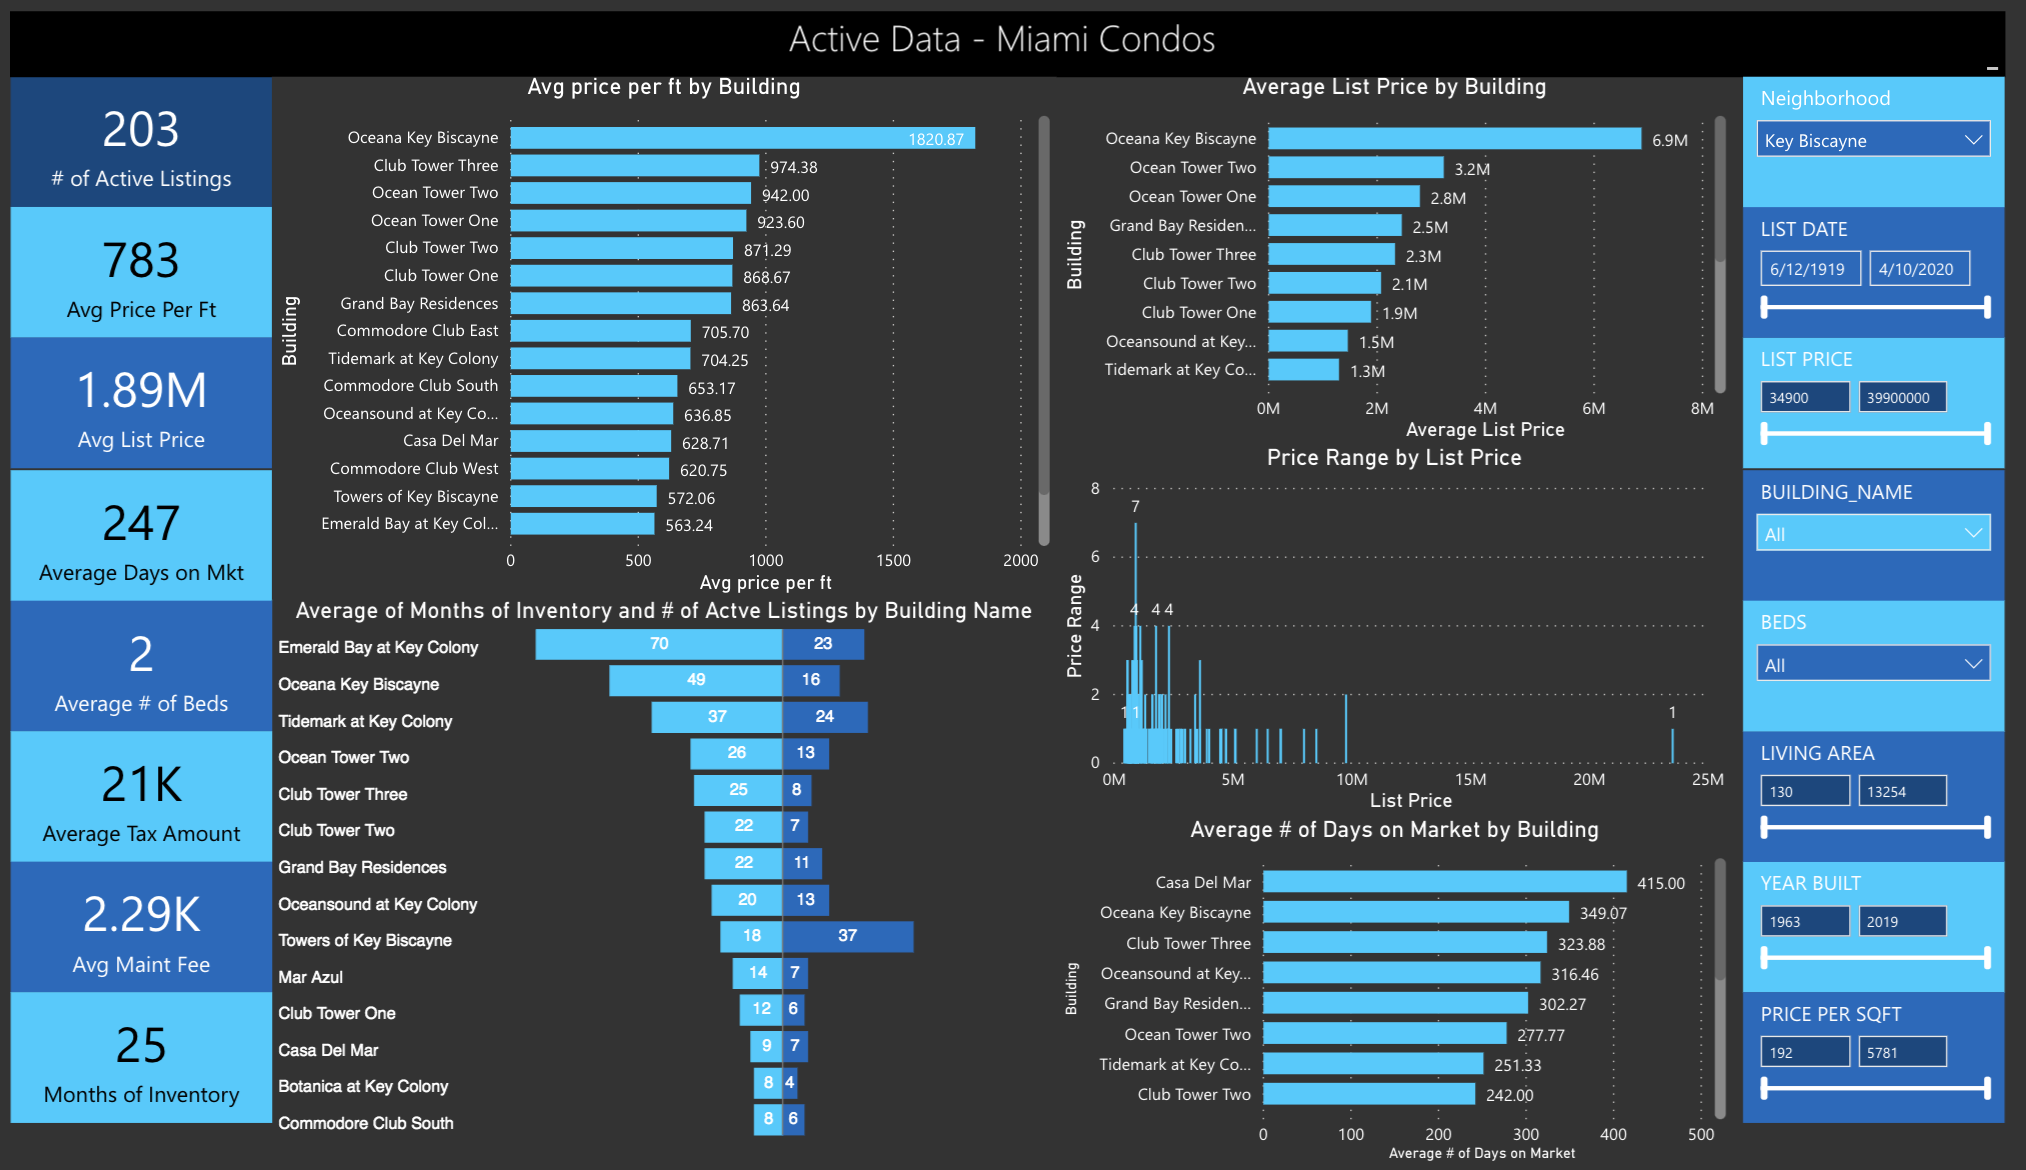
Key Biscayne condos under $1m have experienced softened prices per SF in Q1 2020 since Q1 of 2019 dropping from $515 per sqft to $481 per sqft. Sales actually increased in numbers, which is a direct reflection of no doubt the discount in prices. We also saw more sales in the $1m to $2m market. The $2m to $3m seems to be looking healthier than it has done in the last 5 quarters with 7 sales. Inventory has also dropped to its lowest point in 2 years.
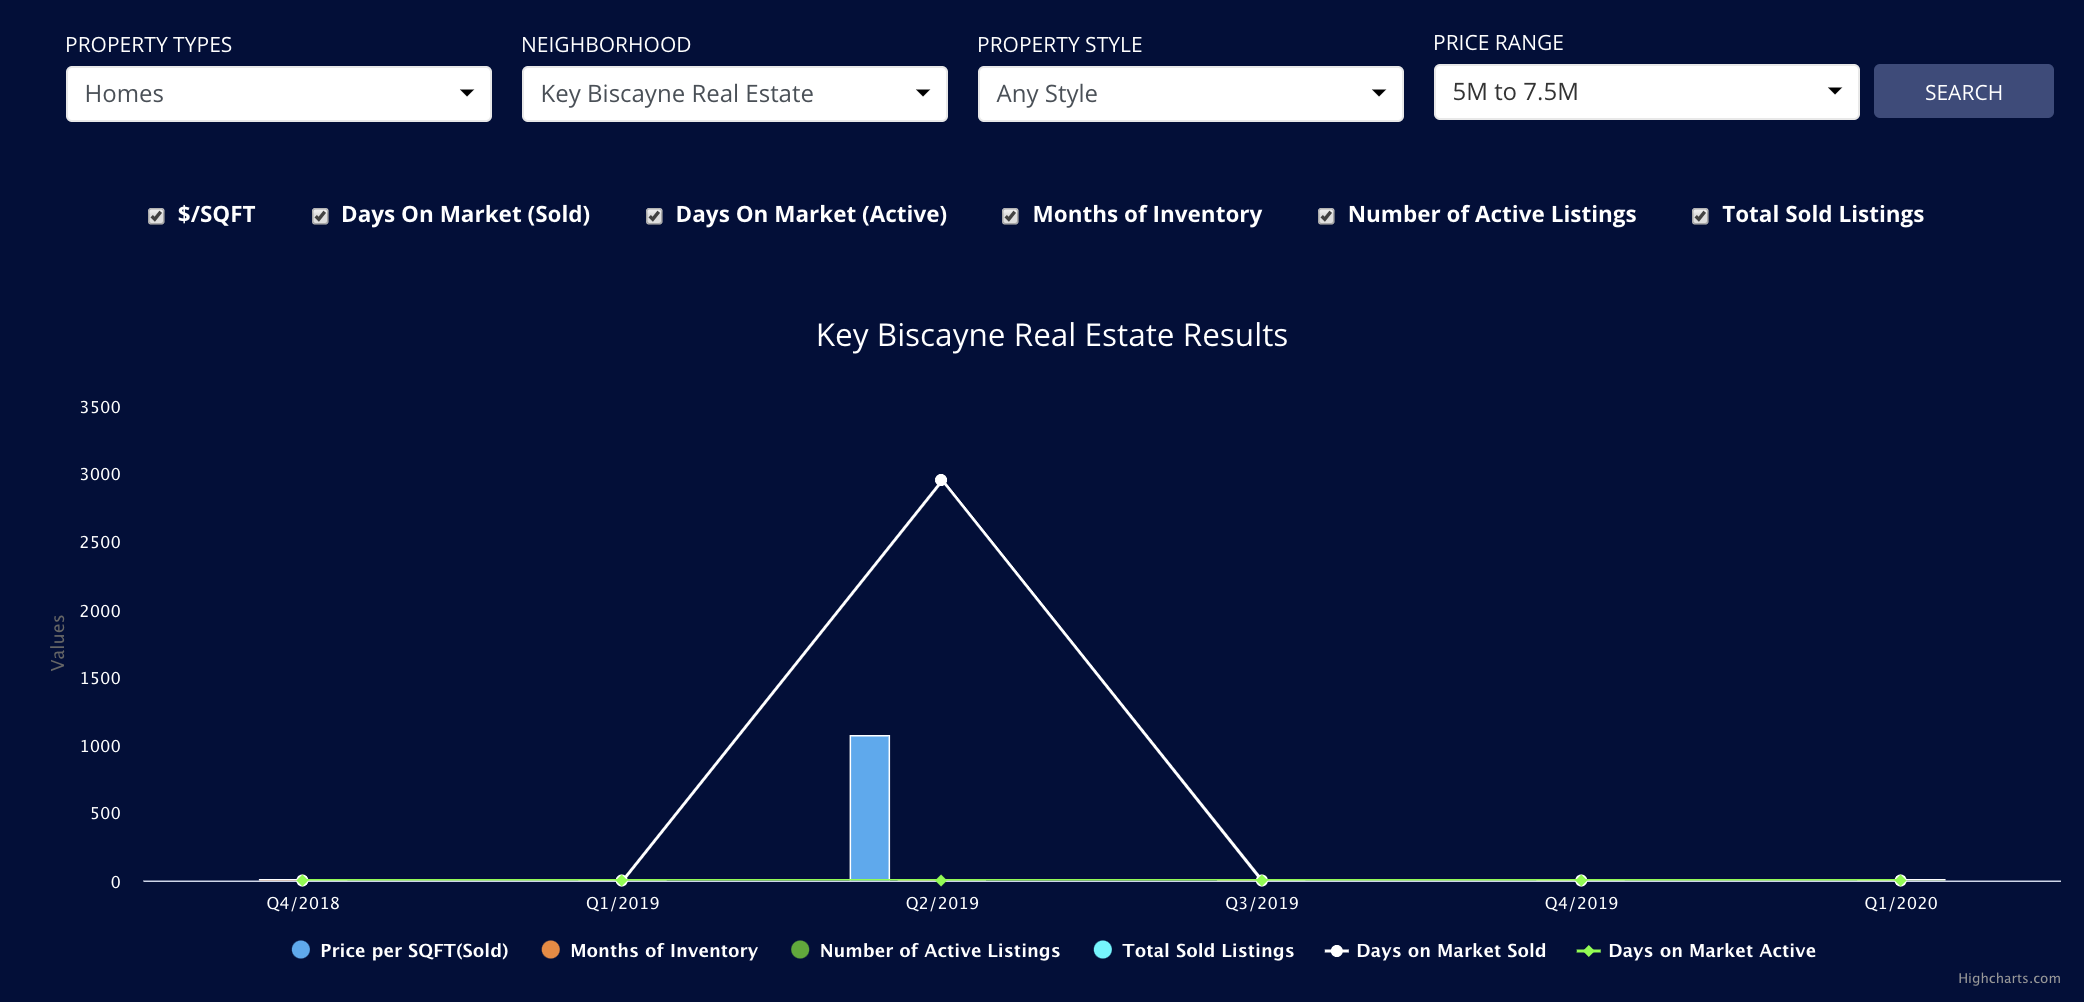
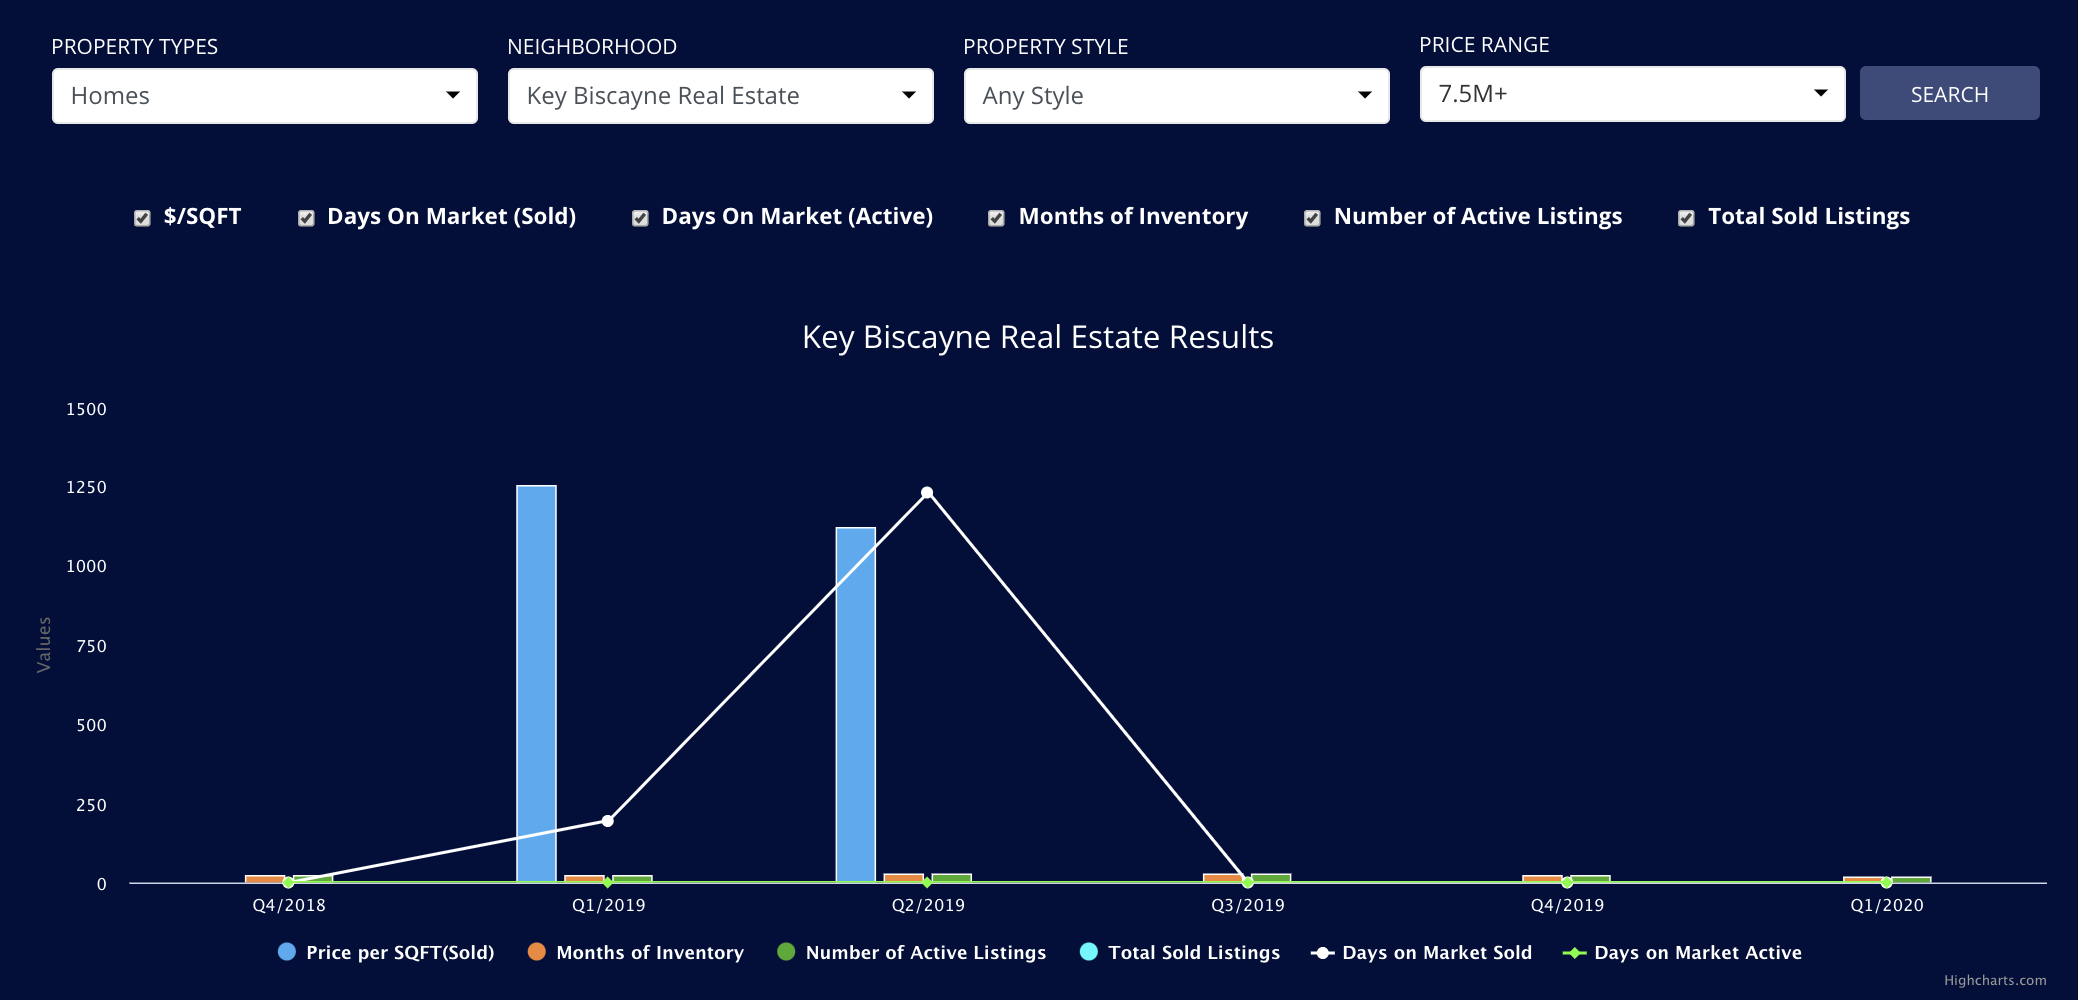
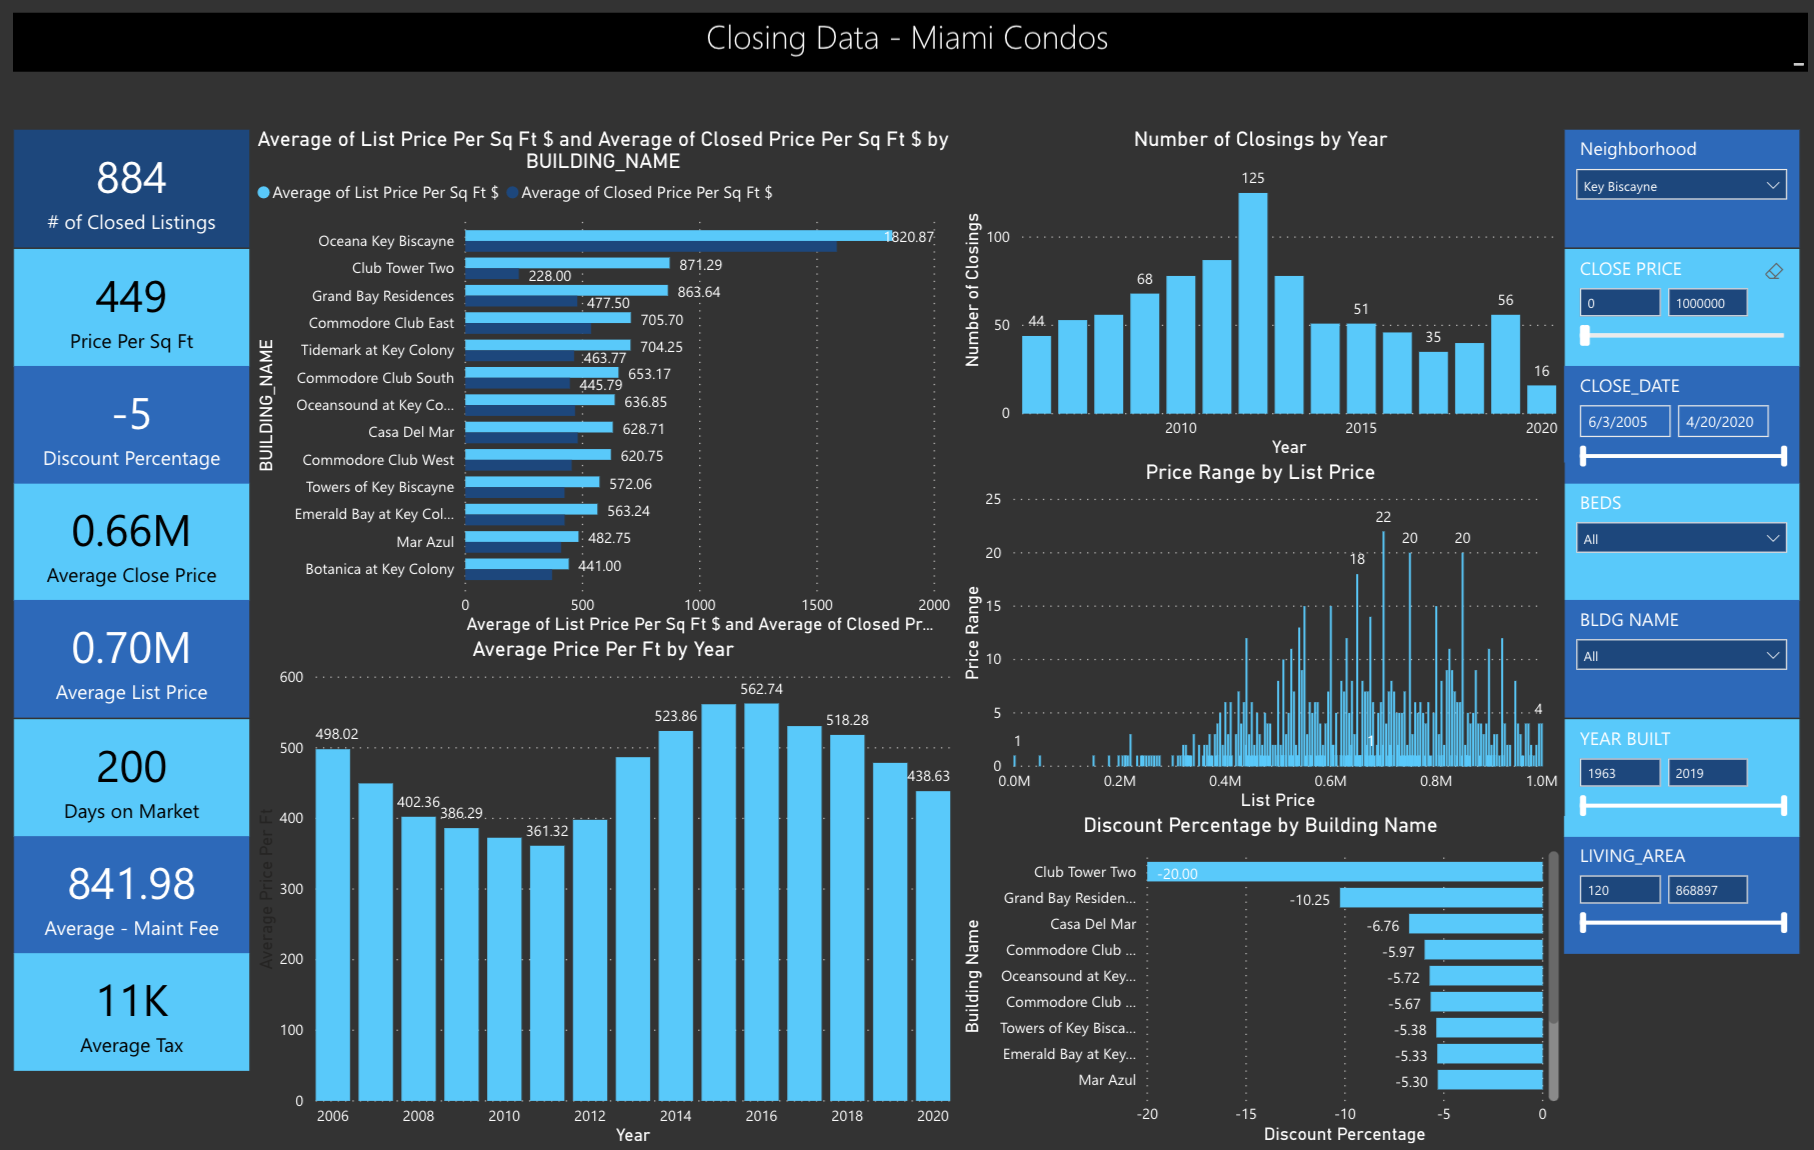
The Key Biscayne luxury condo market is driven by Oceana, Ocean Club and Grand Bay Residences. The market reached it peak in 2015 after which prices came down. These market conditions (high inventory levels, high amount of days on the market and lower prices) did result in some buyers being able to vulture great oceanfront deals. Grand Bay Residences is currently seeing a 11% discount on asking prices and is therefore a great condo to get a deal as it is trading at $703 per sqft, a figure not previously not seen since 2012. Oceana, which is the most luxurious condo on Key Biscayne is trading at its lowest point of $1,398 per sqft, a long cry from its peak of $1,795 per sqft in 2014. Ocean Club is the best performing luxury condo project for 2020. With prices also significantly off the peak, in 2020 it is trading around $844 per SF.
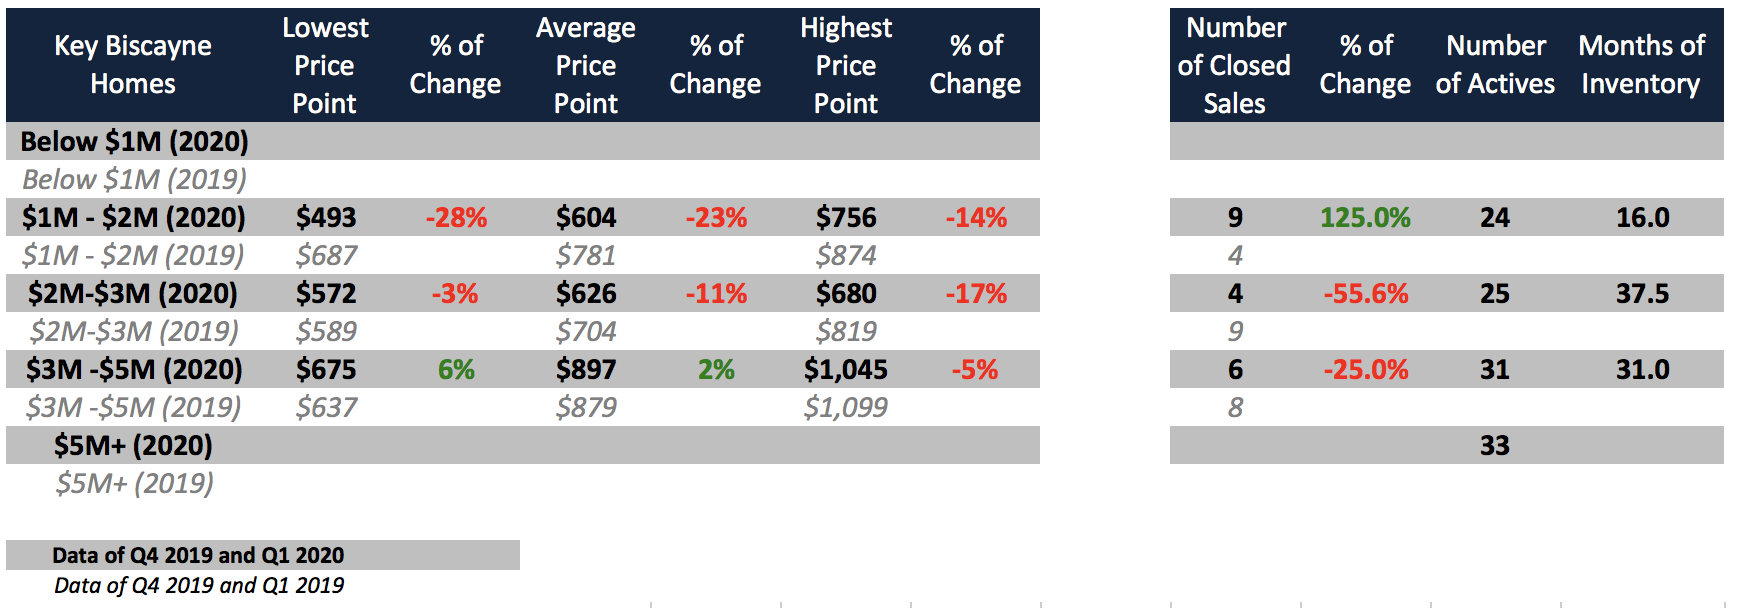
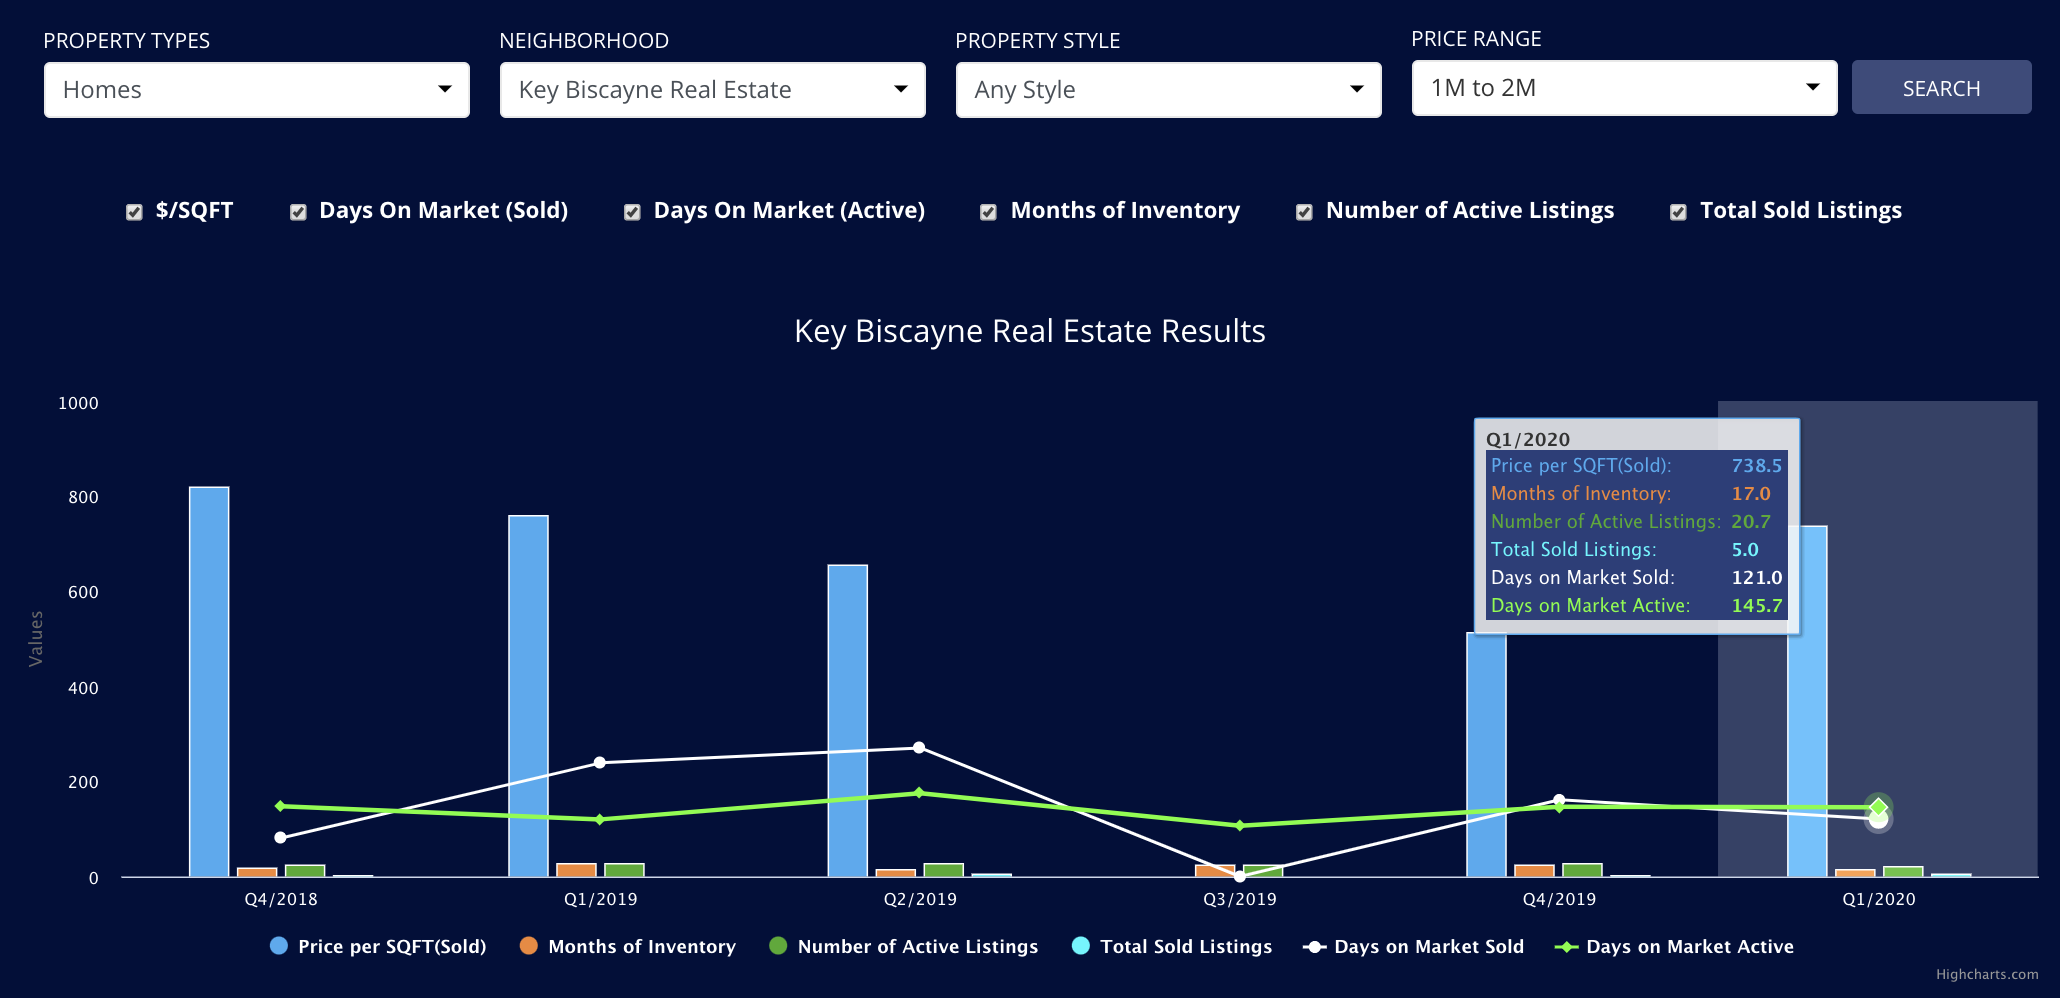
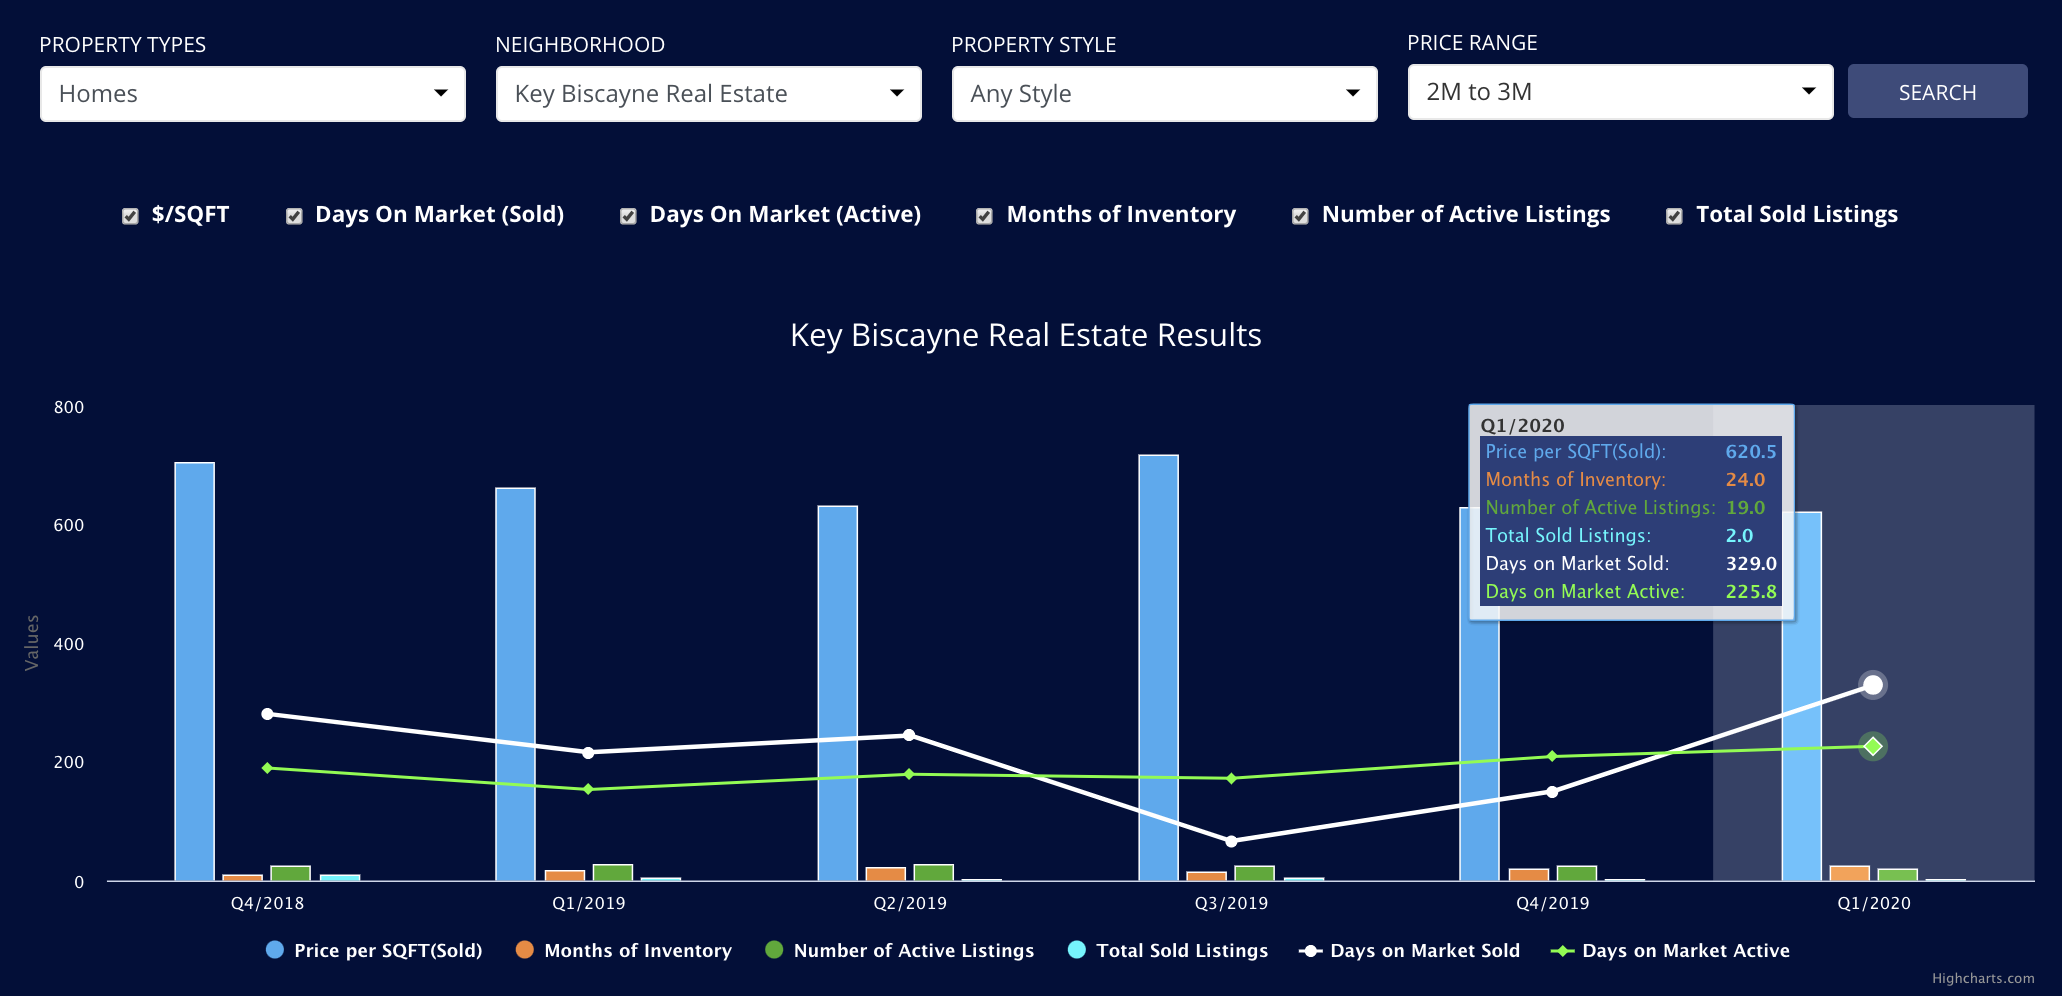
So, what about the ‘single-family home market in Key Biscayne?’ This market has not been performing so well for the last couple of years, especially for homes in the $2m – $4m bracket. This market has been in direct competition with the Gables and because the price per sqft is so much higher (well over $600 per sqft), many buyers are opting for the bigger lots and cheaper homes of the Gables.
Pinecrest Homes Q1 2020
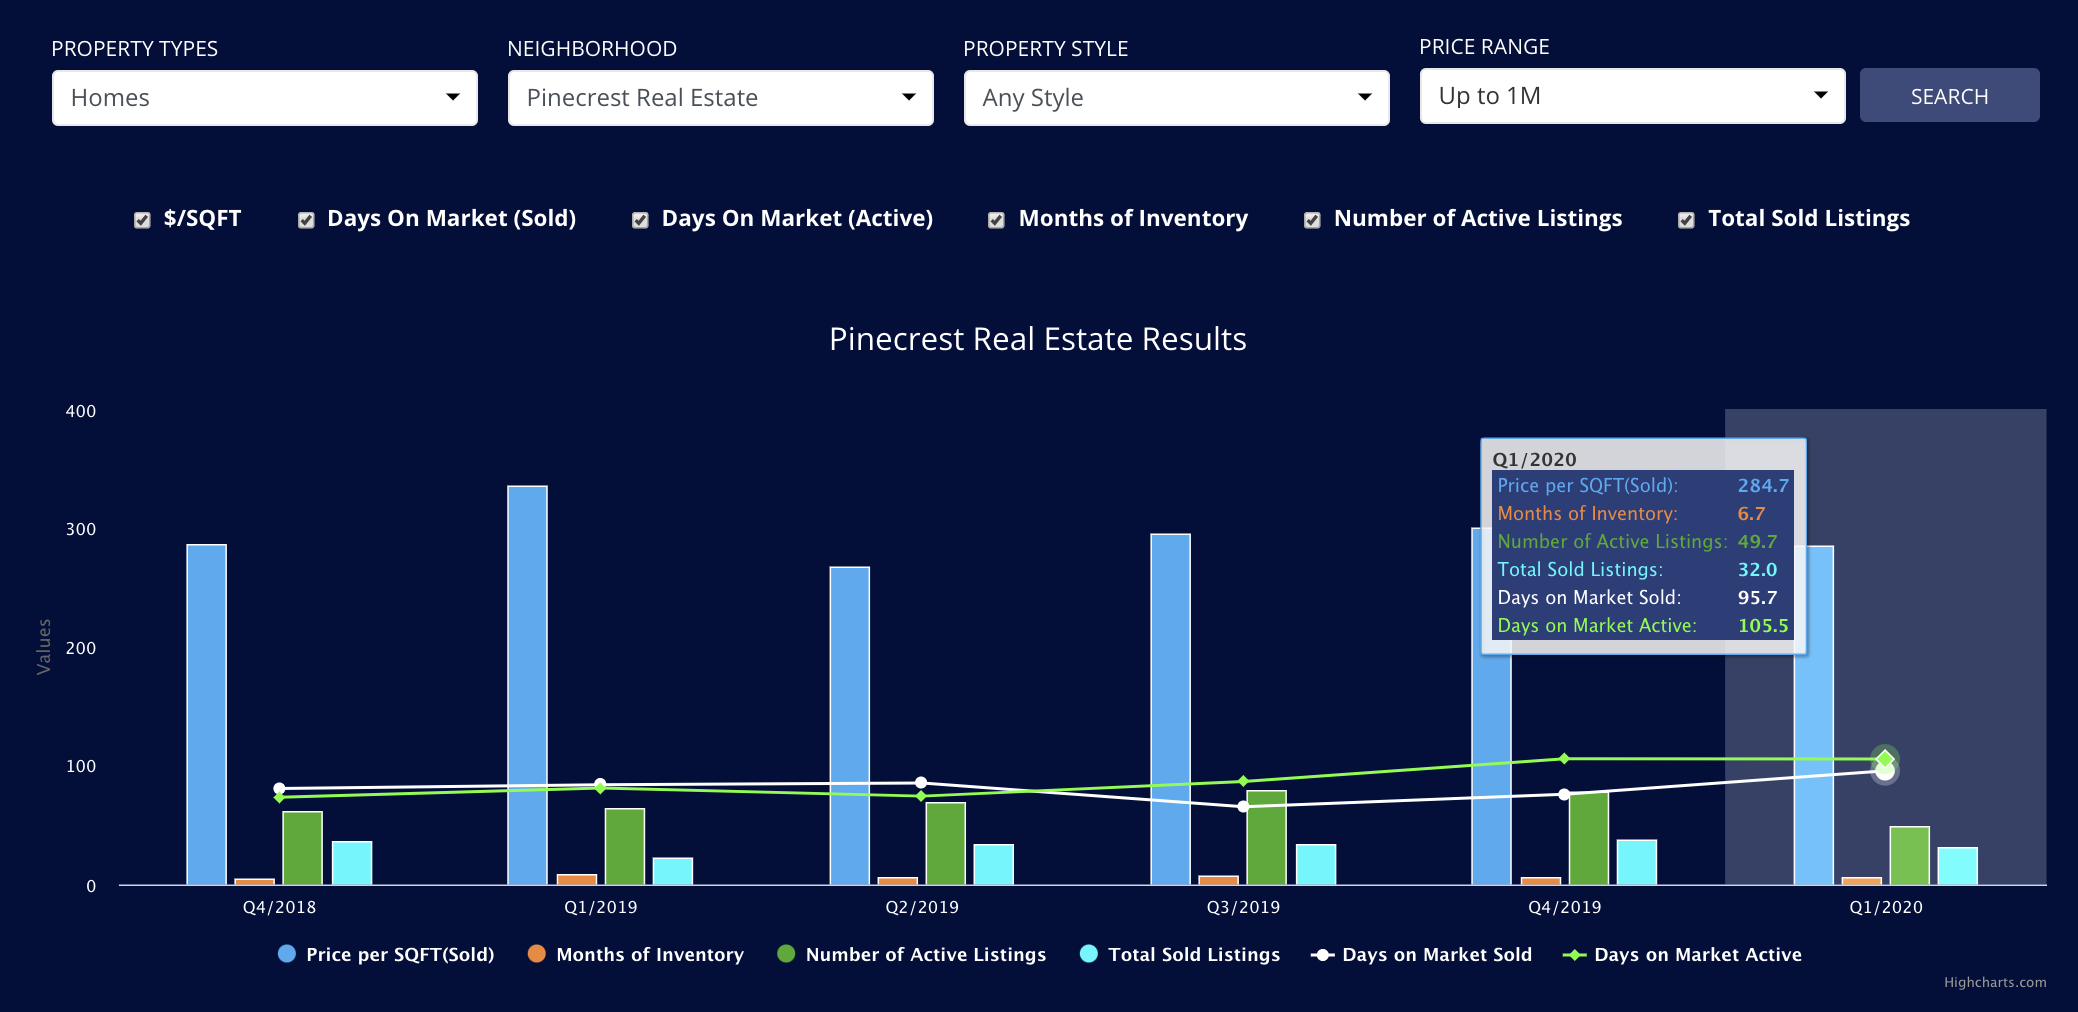
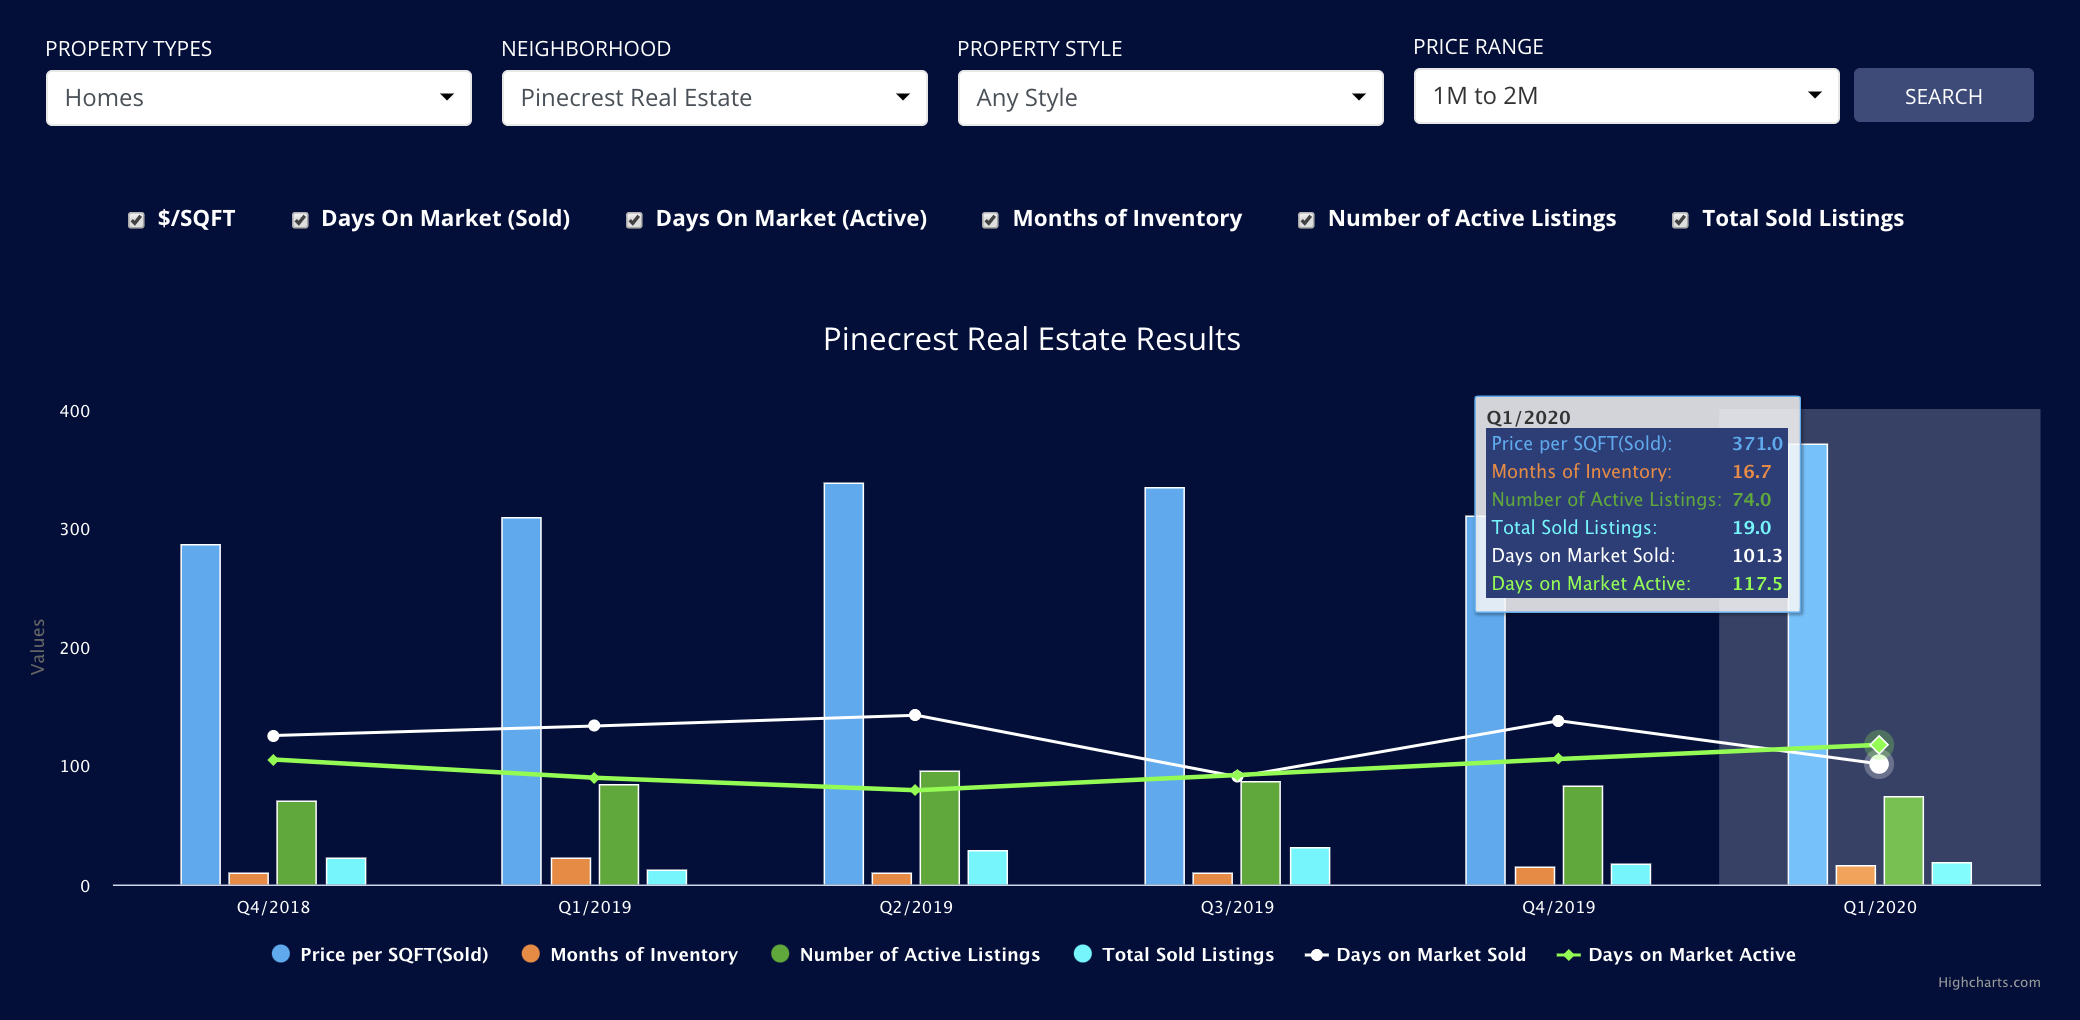
The Pinecrest housing market is alive and well. 2020 Sees a continuation of 2019’s performance and as long as relocations continue to drive the market it will remain strong. With only 6.7 months of inventory under $1m, this market is a firm seller’s market. In Q1 of last year this was 8.7 months with 23 sales, as opposed to 33 sales this year. Simply put; If you are currently a seller, please call us – we are running low on inventory! Although inventory is higher for the $1-$2m market the same is to be said for the velocity of sales; there are more sales in this year than in the last year.
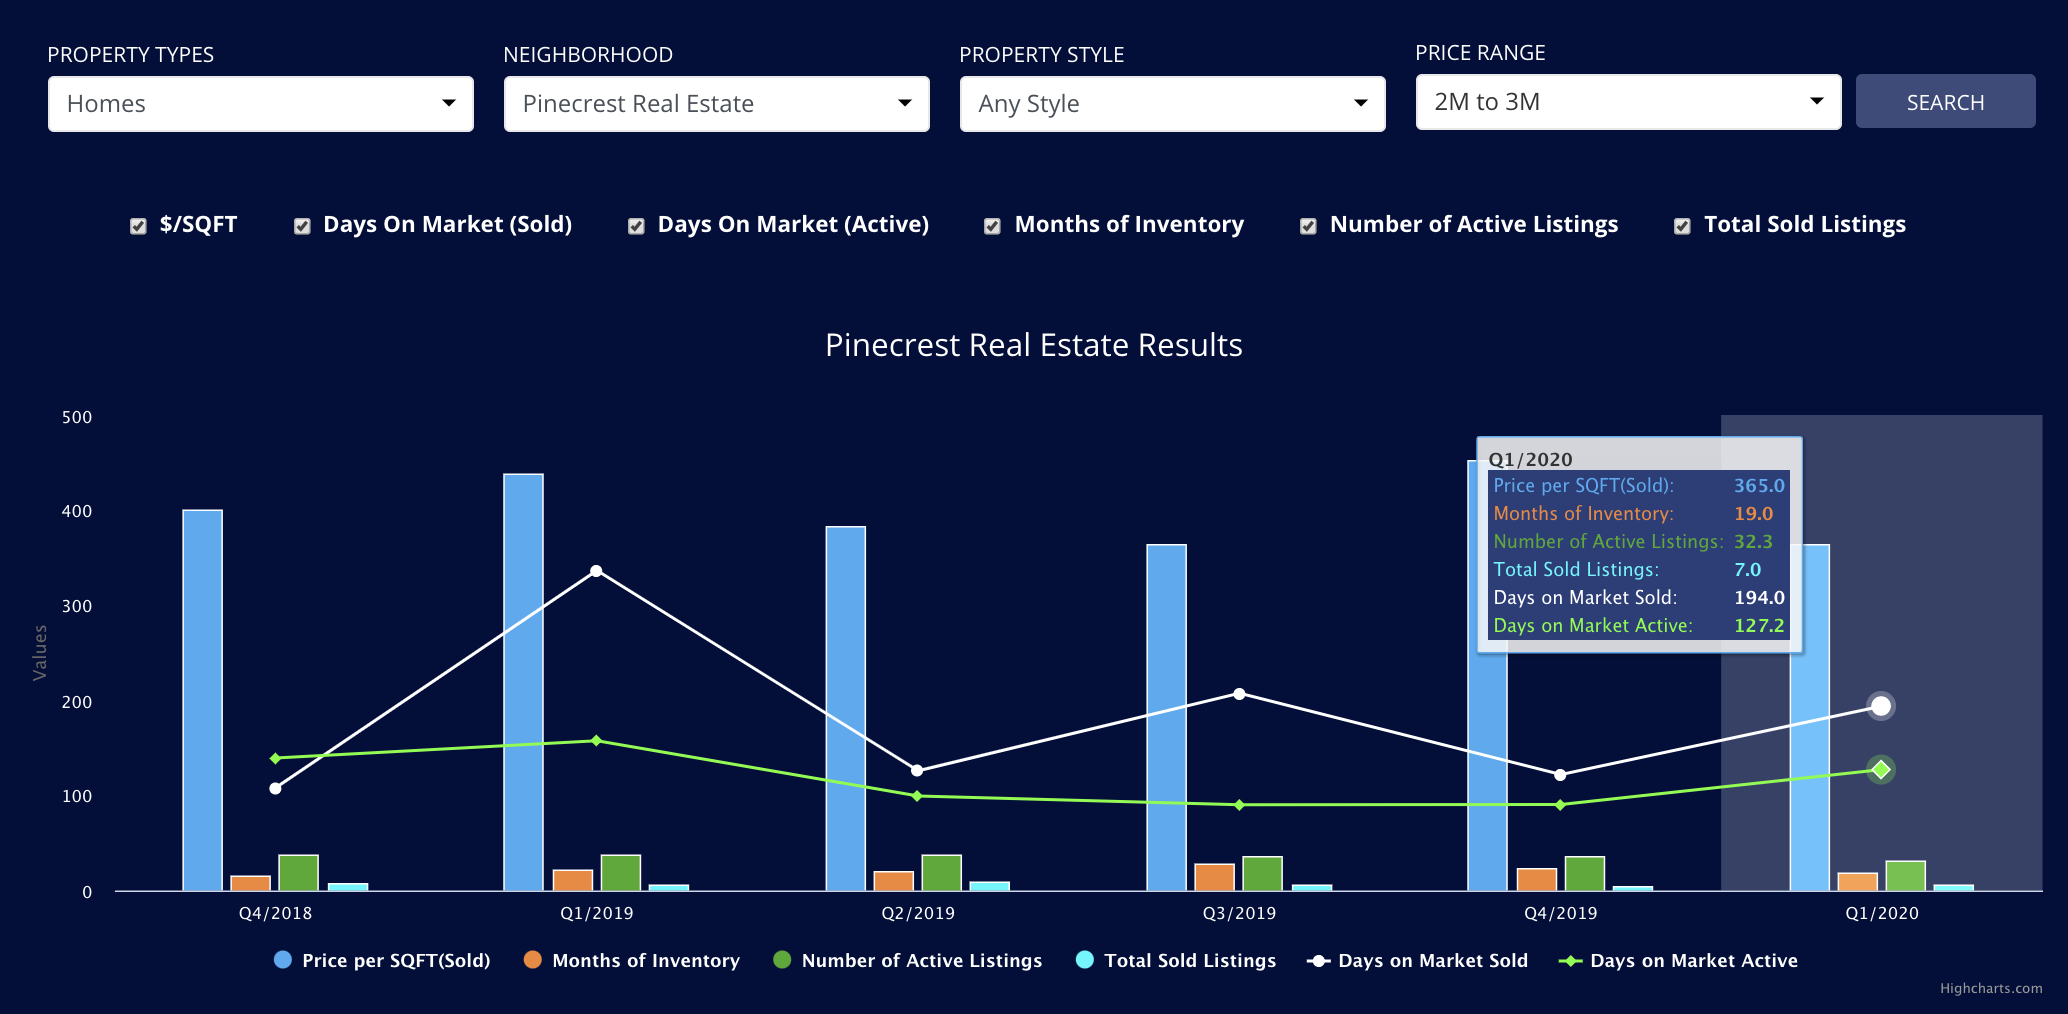
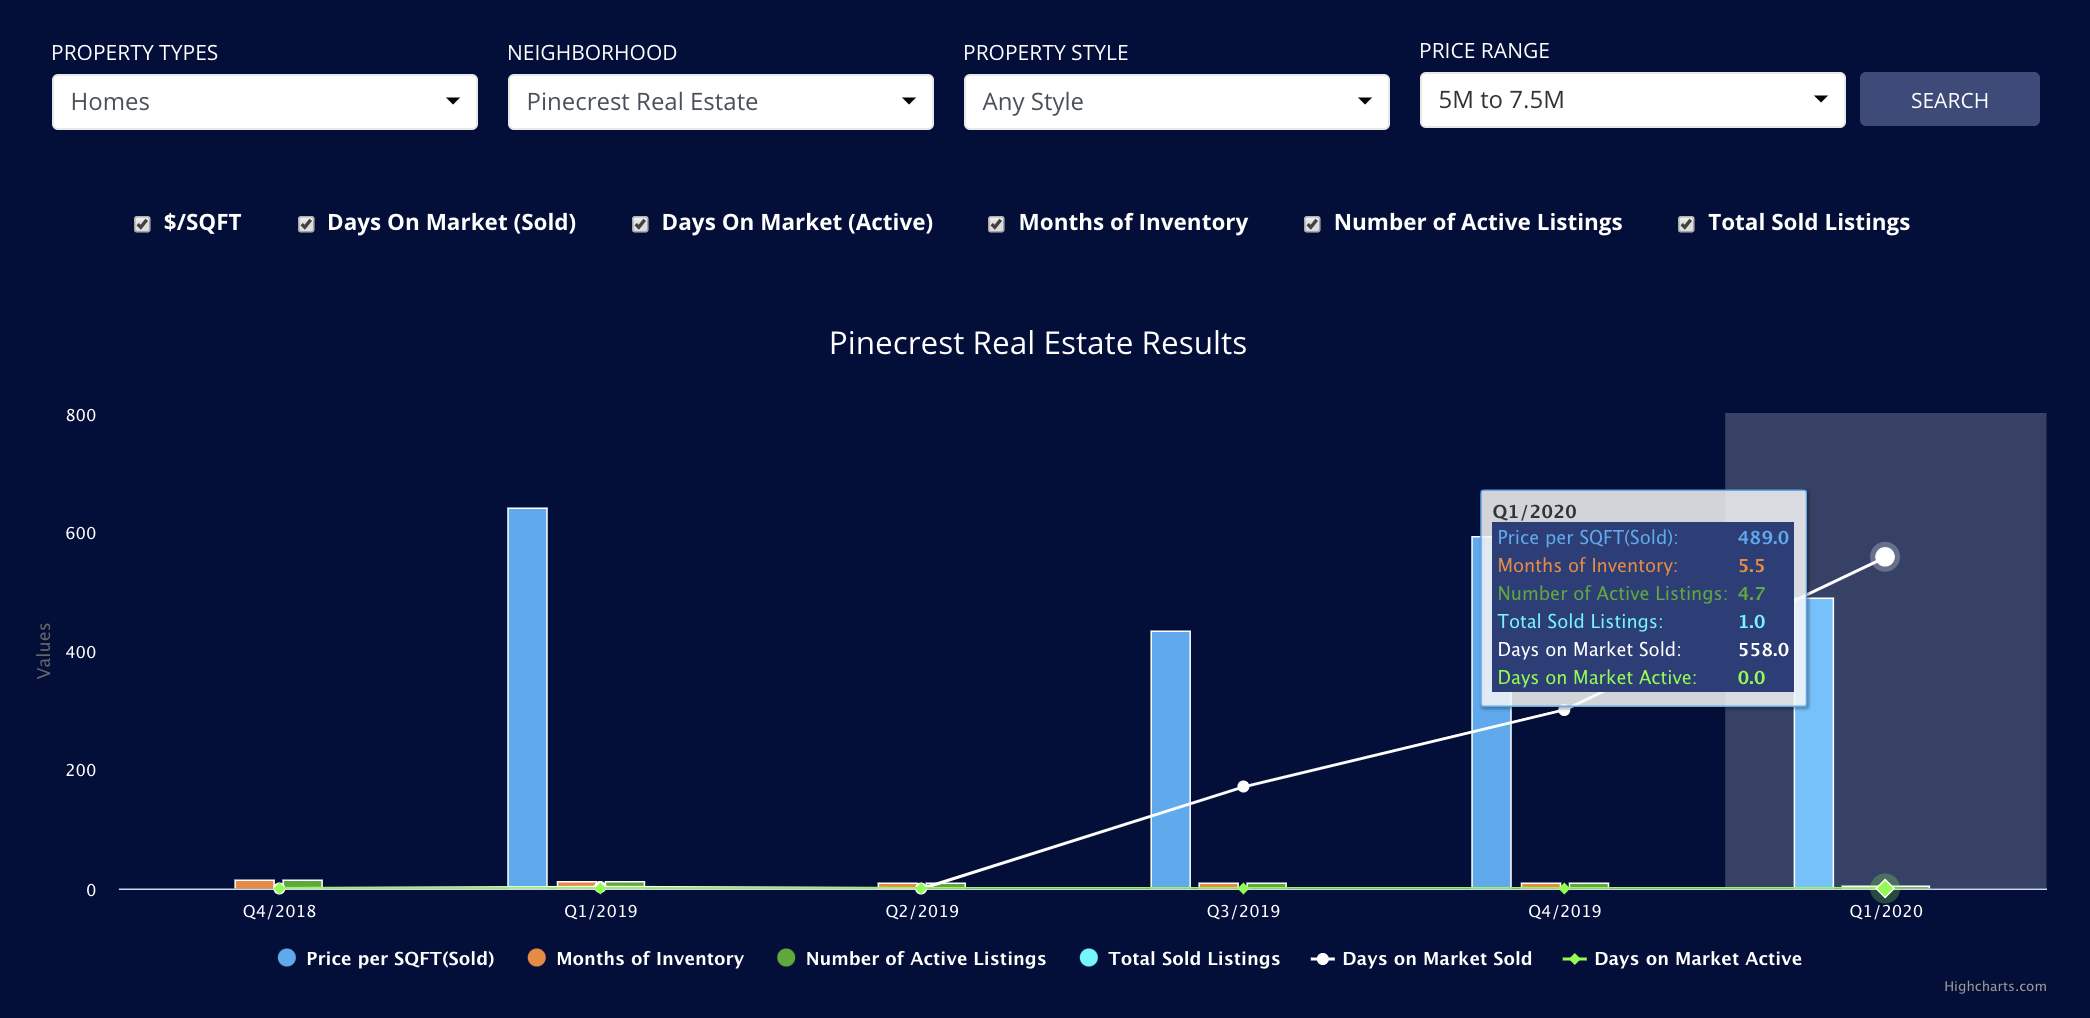
Once you get to the $2-3m range and the $3-$5m range sales slow down and it becomes a buyers market with 19 month of inventory at $2-$3m and 29 months at the $3m-$5m range. Above $5m we see on average of 1 sale per quarter. The average price per sqft compared to last year? For 2020 we saw an average of $555 per SF (6 sales over $3M+) and properties stayed on the market for 1 year on average. For 2019 we saw 2 sales over $3M+with an average of $549 per SF. Properties stayed on the market for 448 days. How did every Miami Neighborhood Perform in Q1 2020?
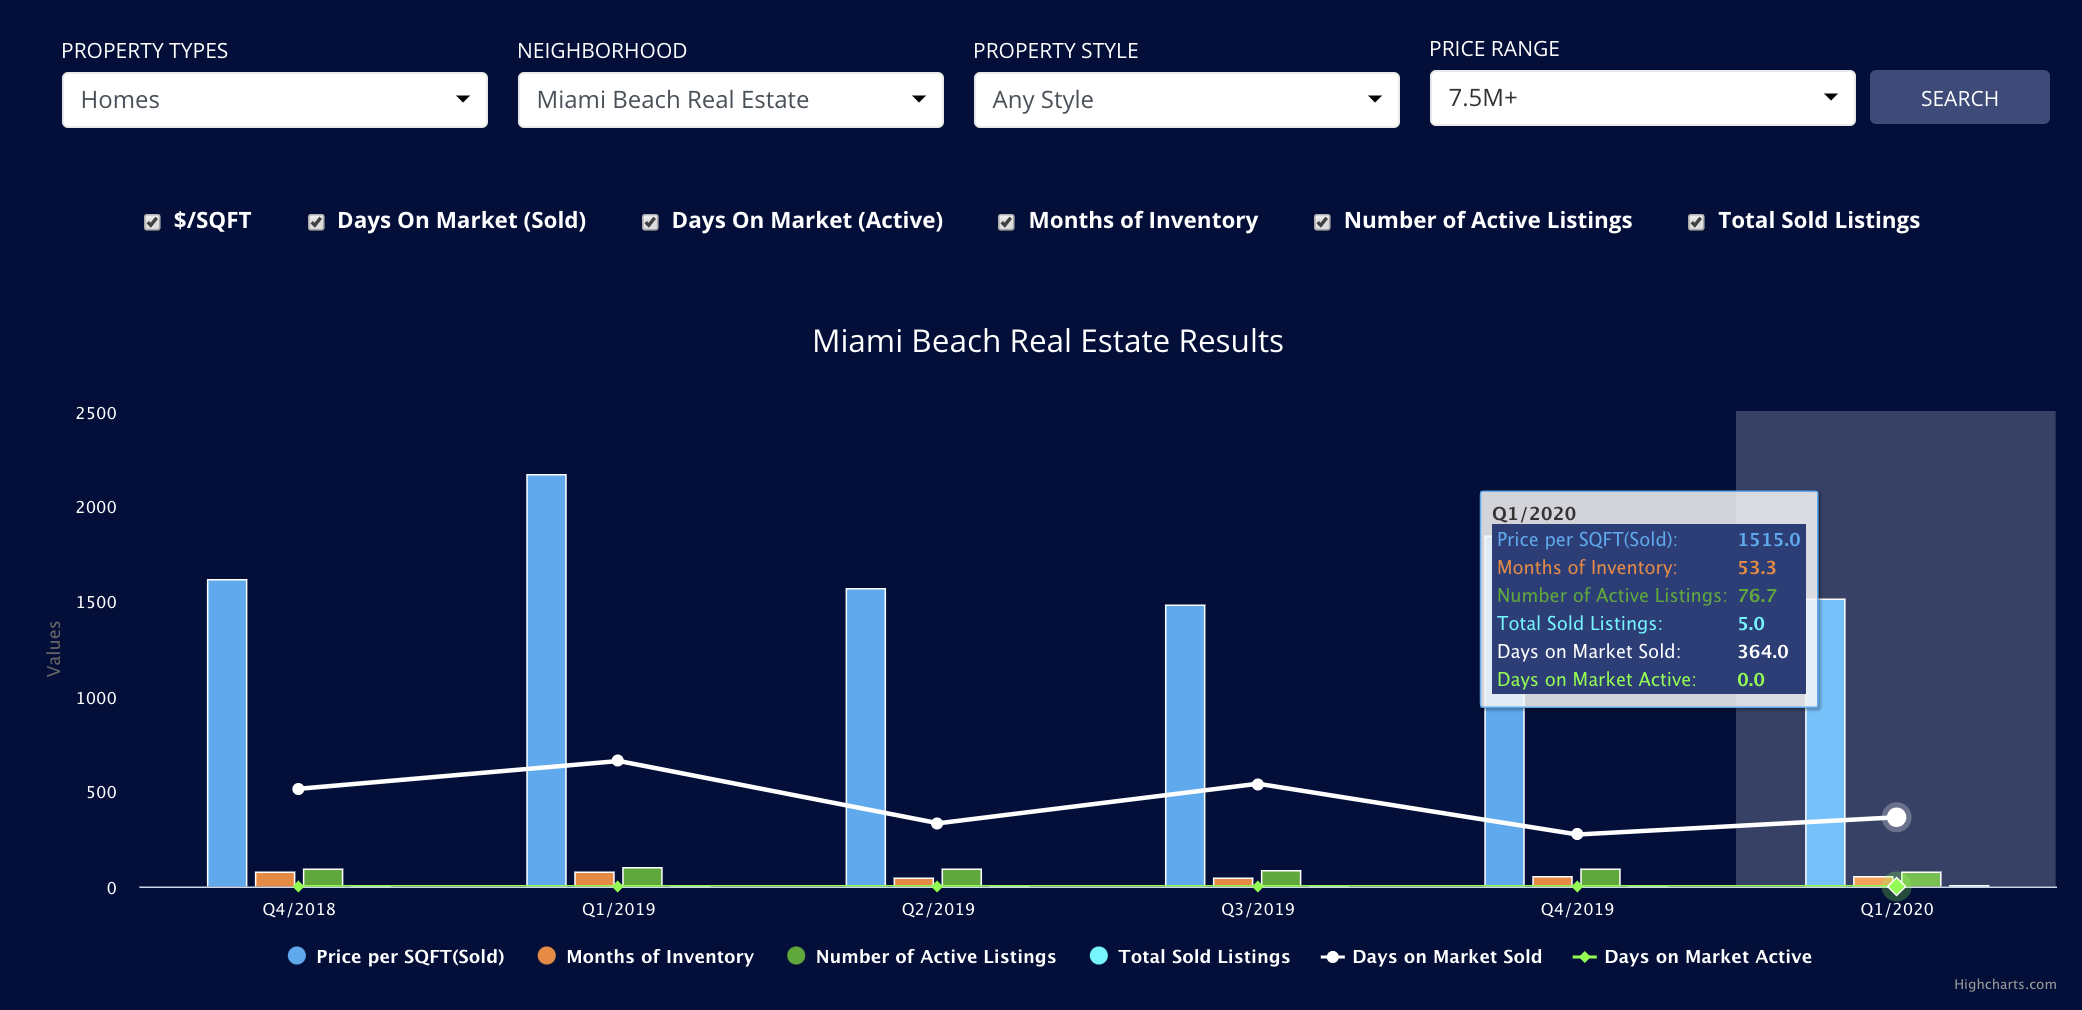
Miami Beach Homes Q1 2020
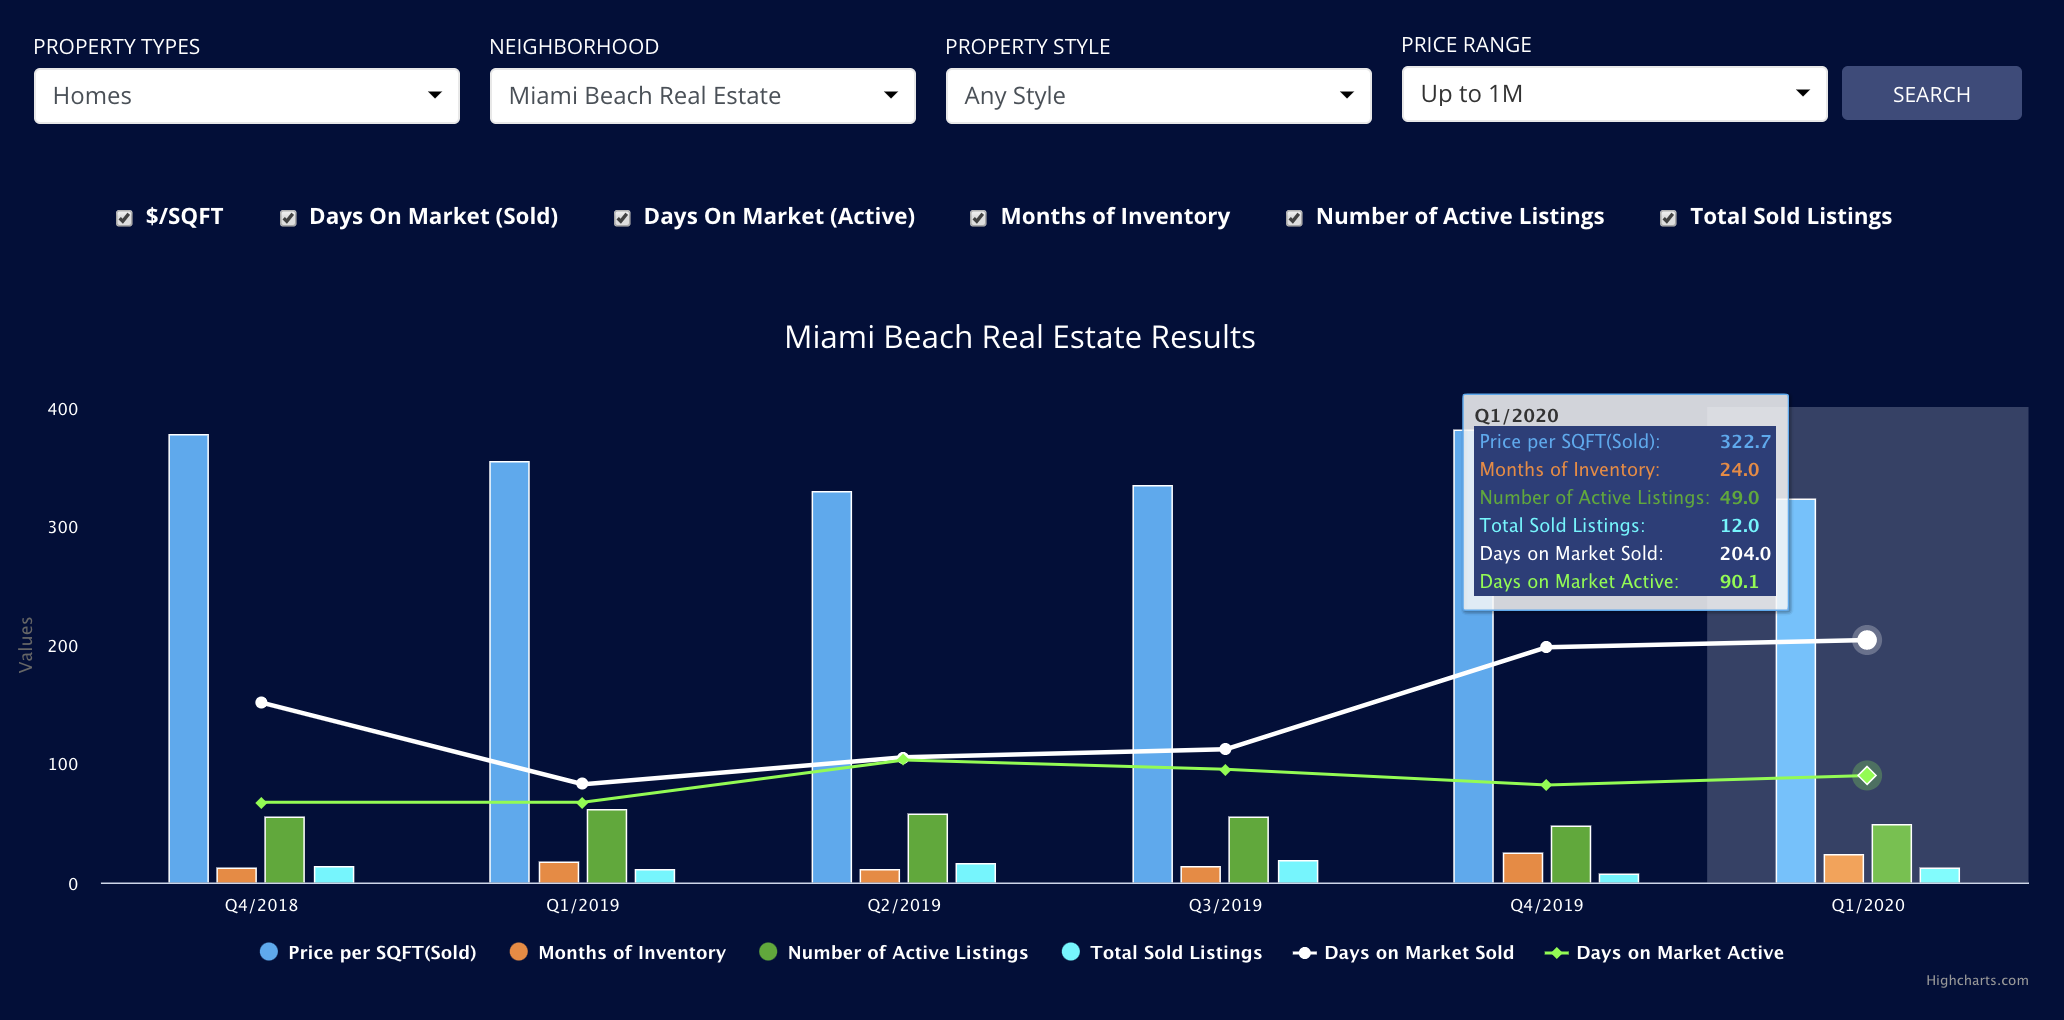
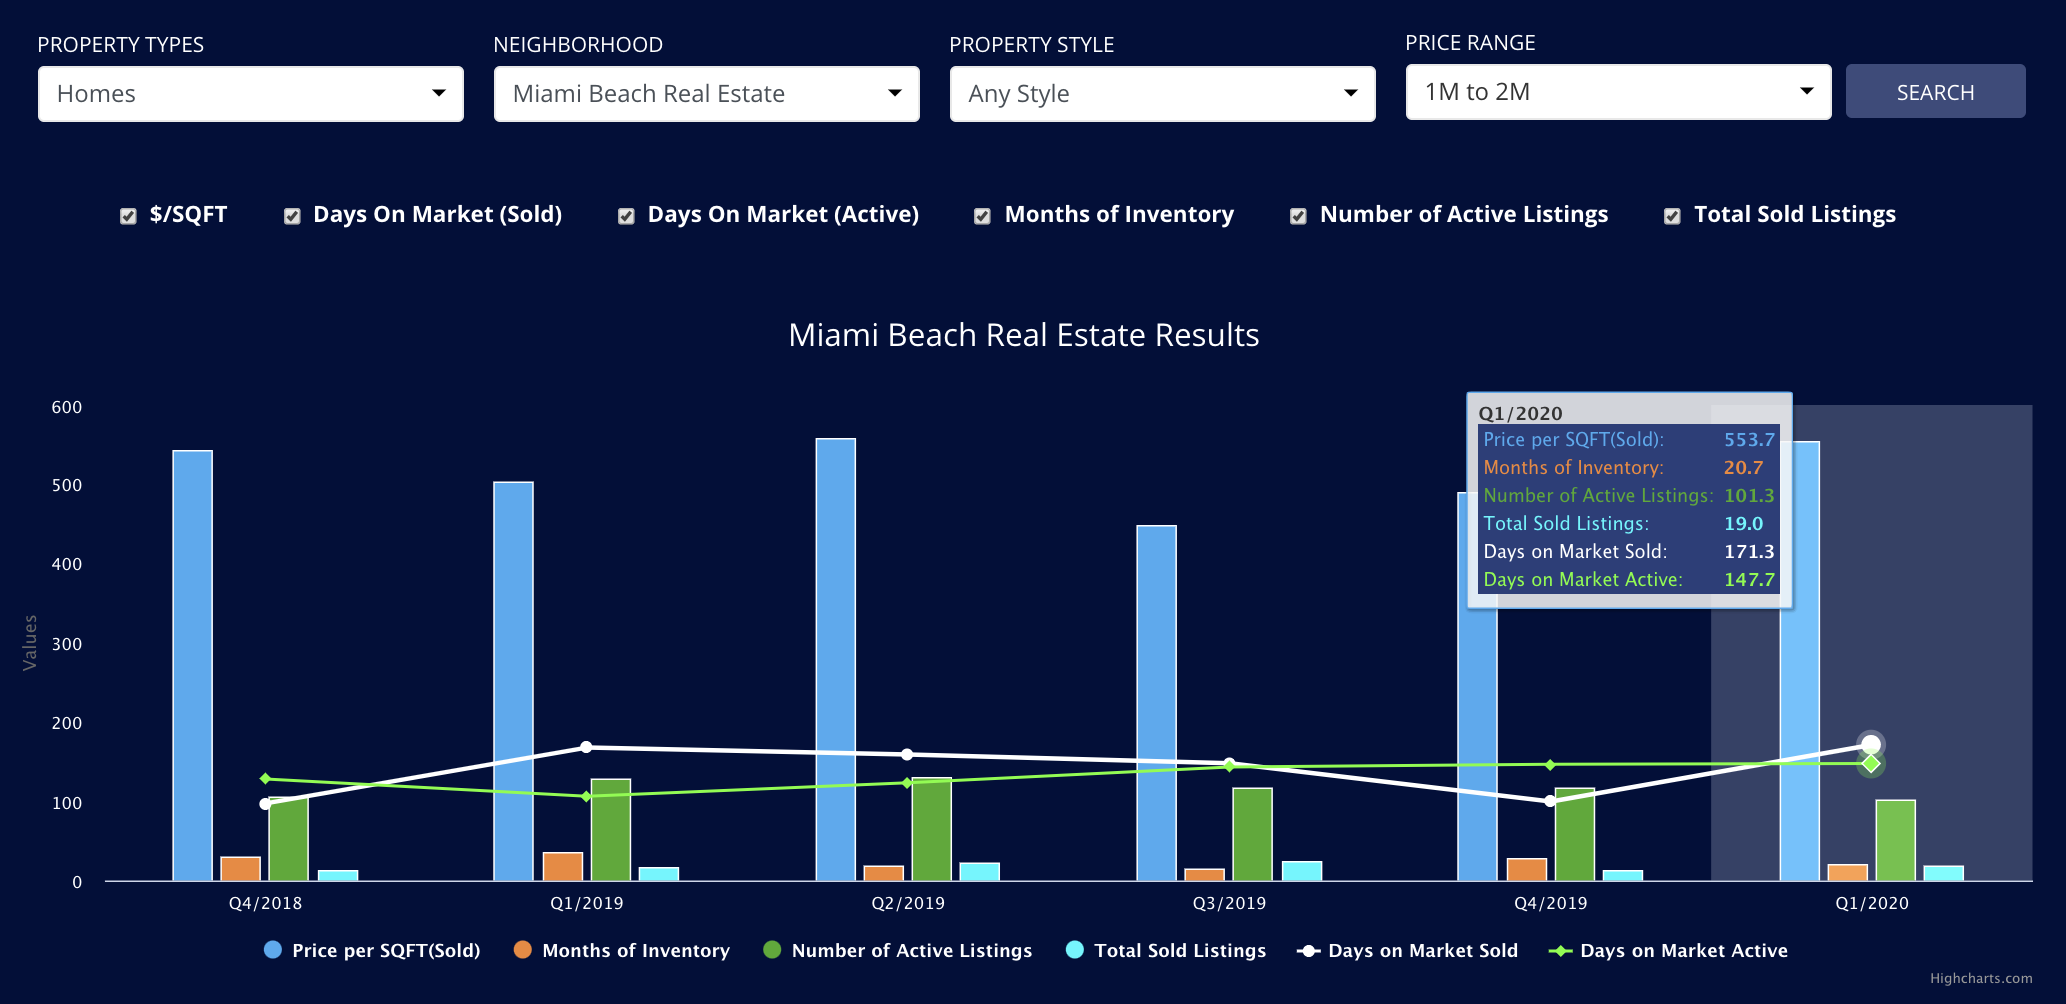
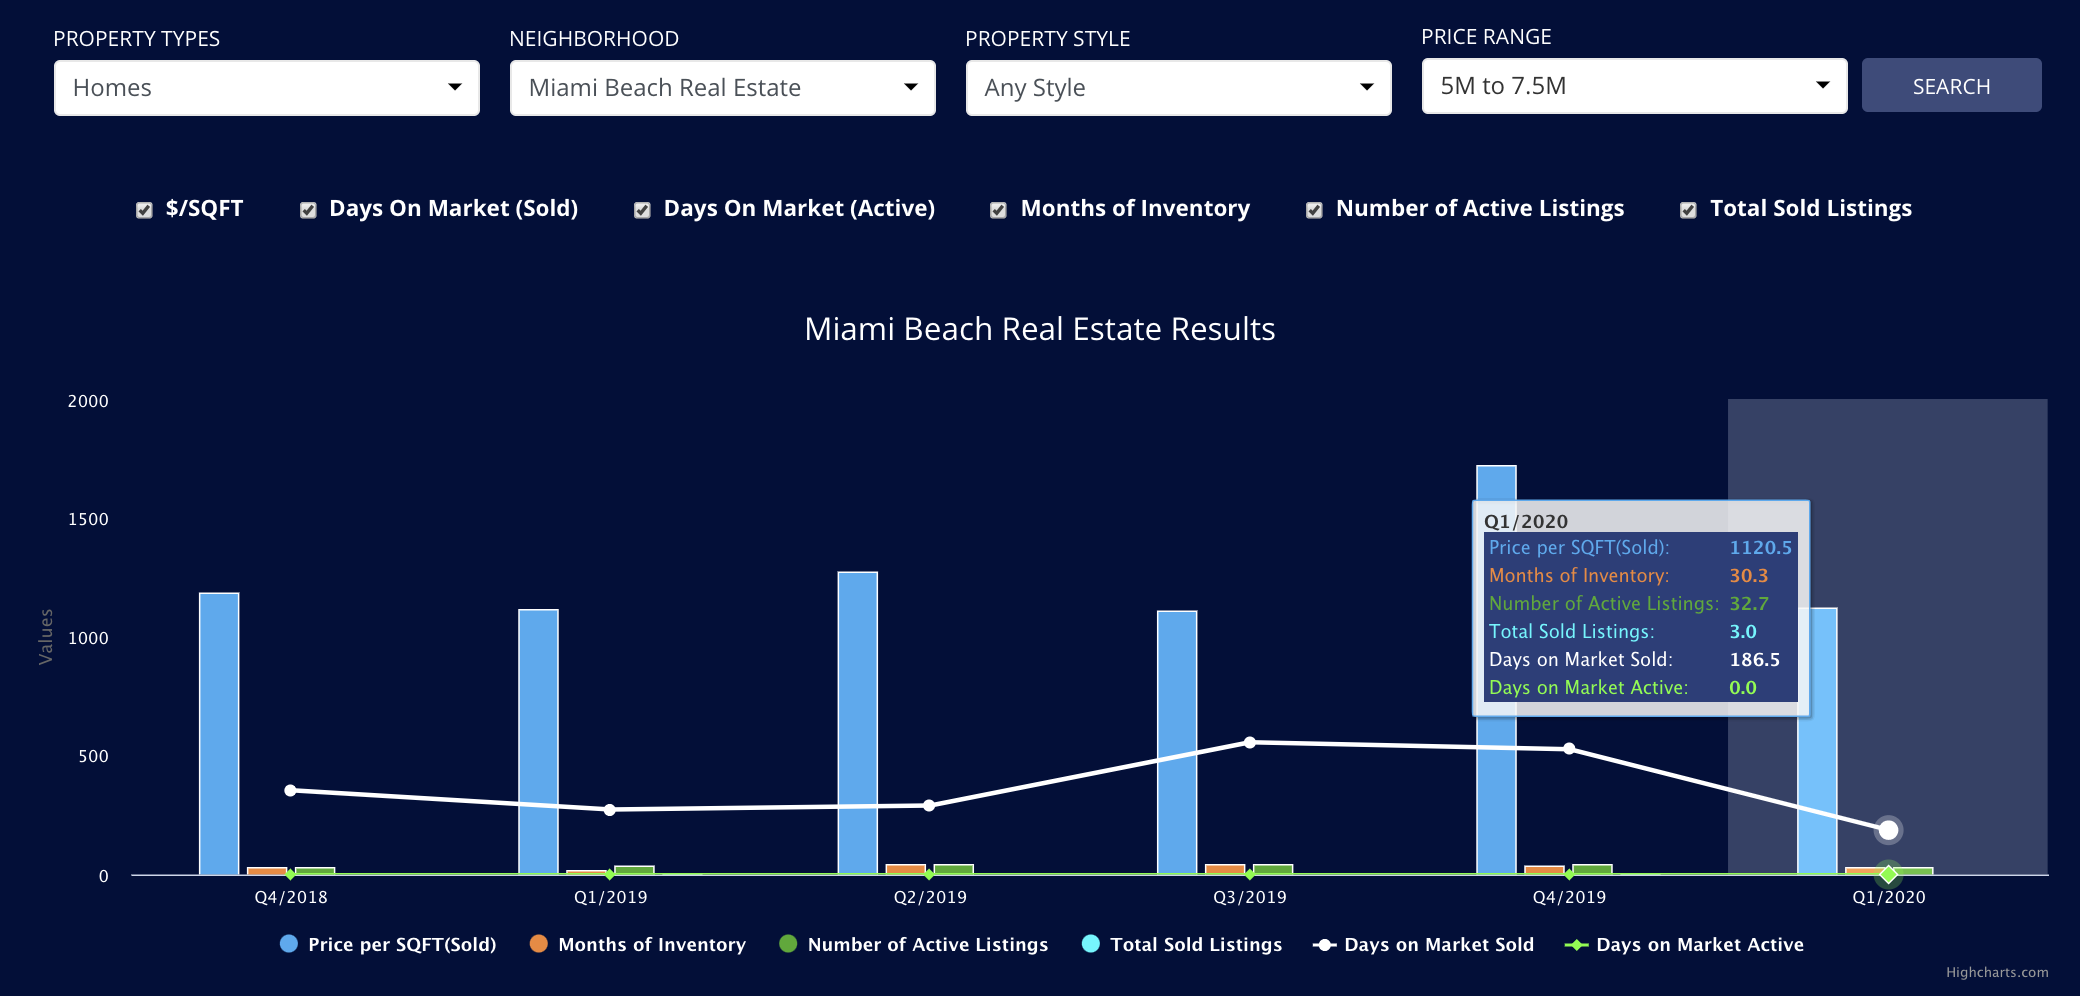
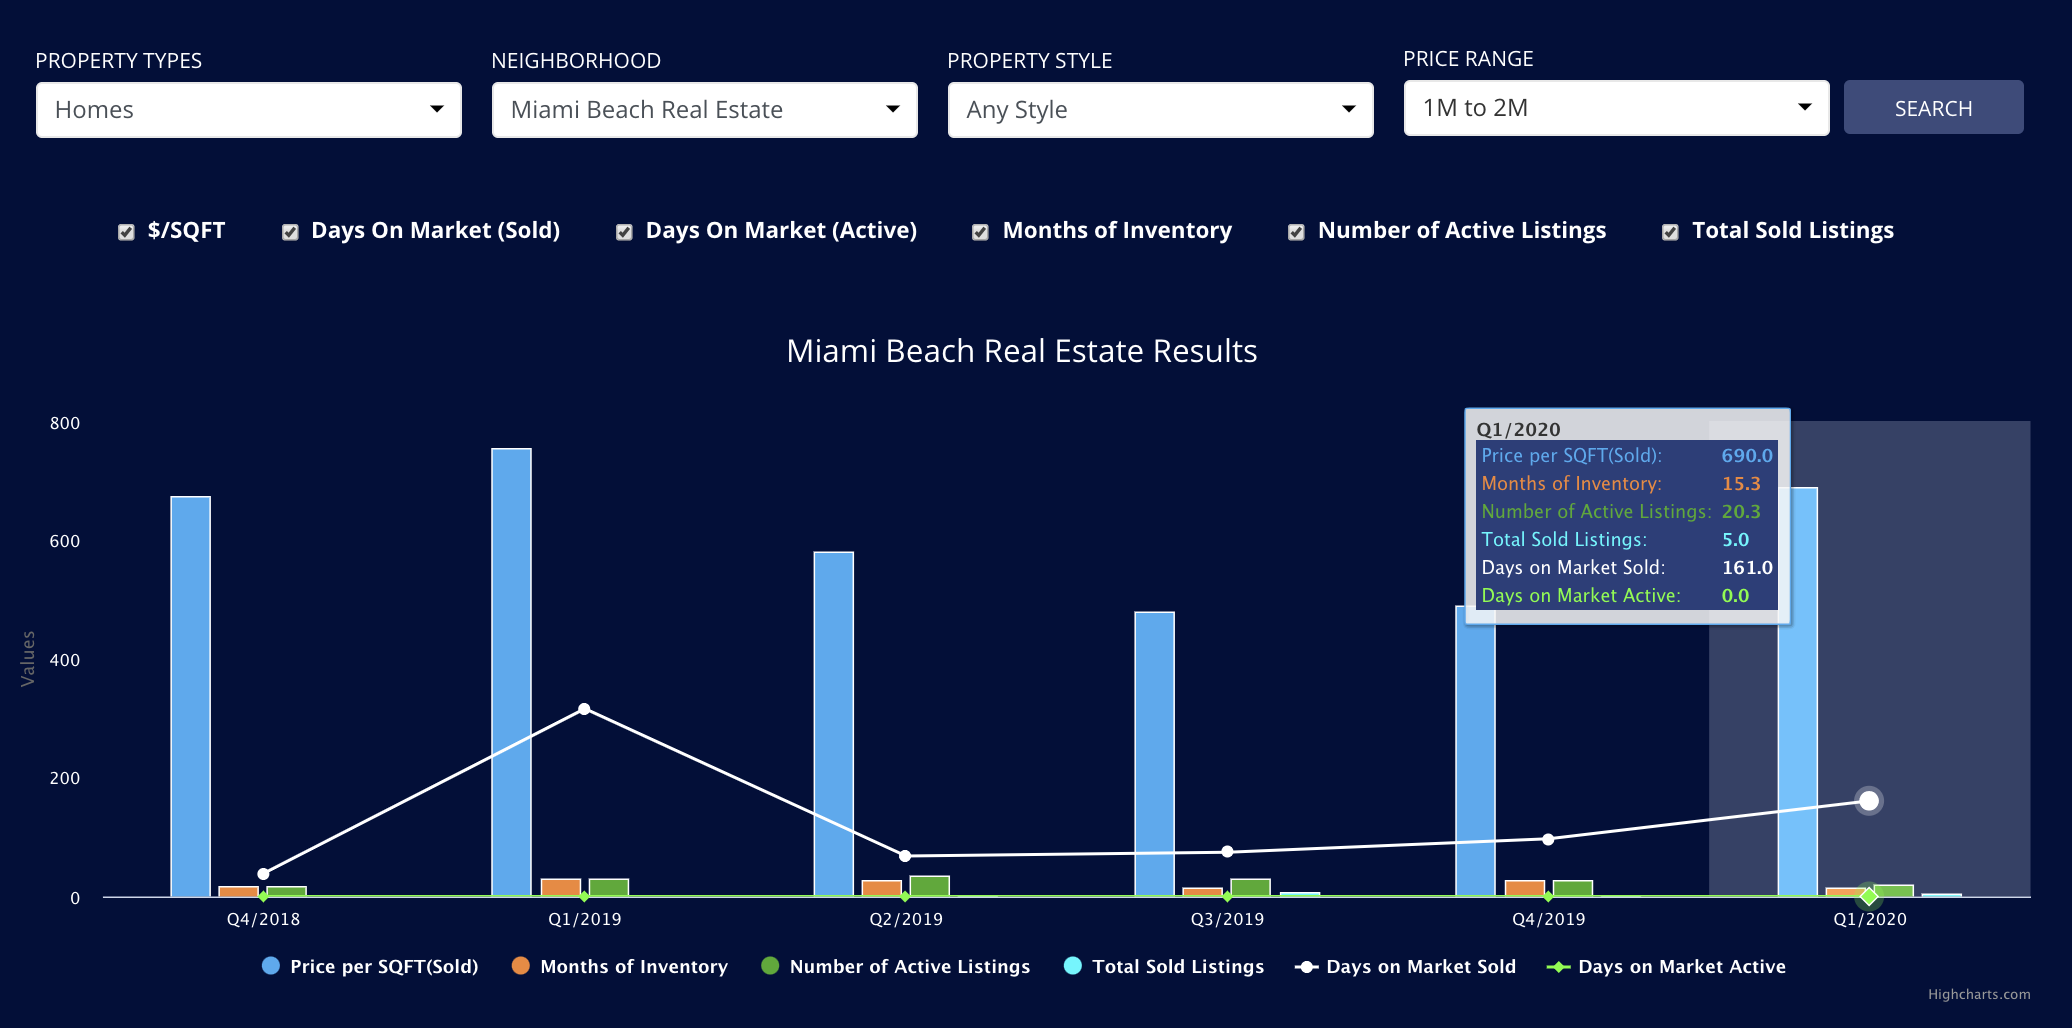
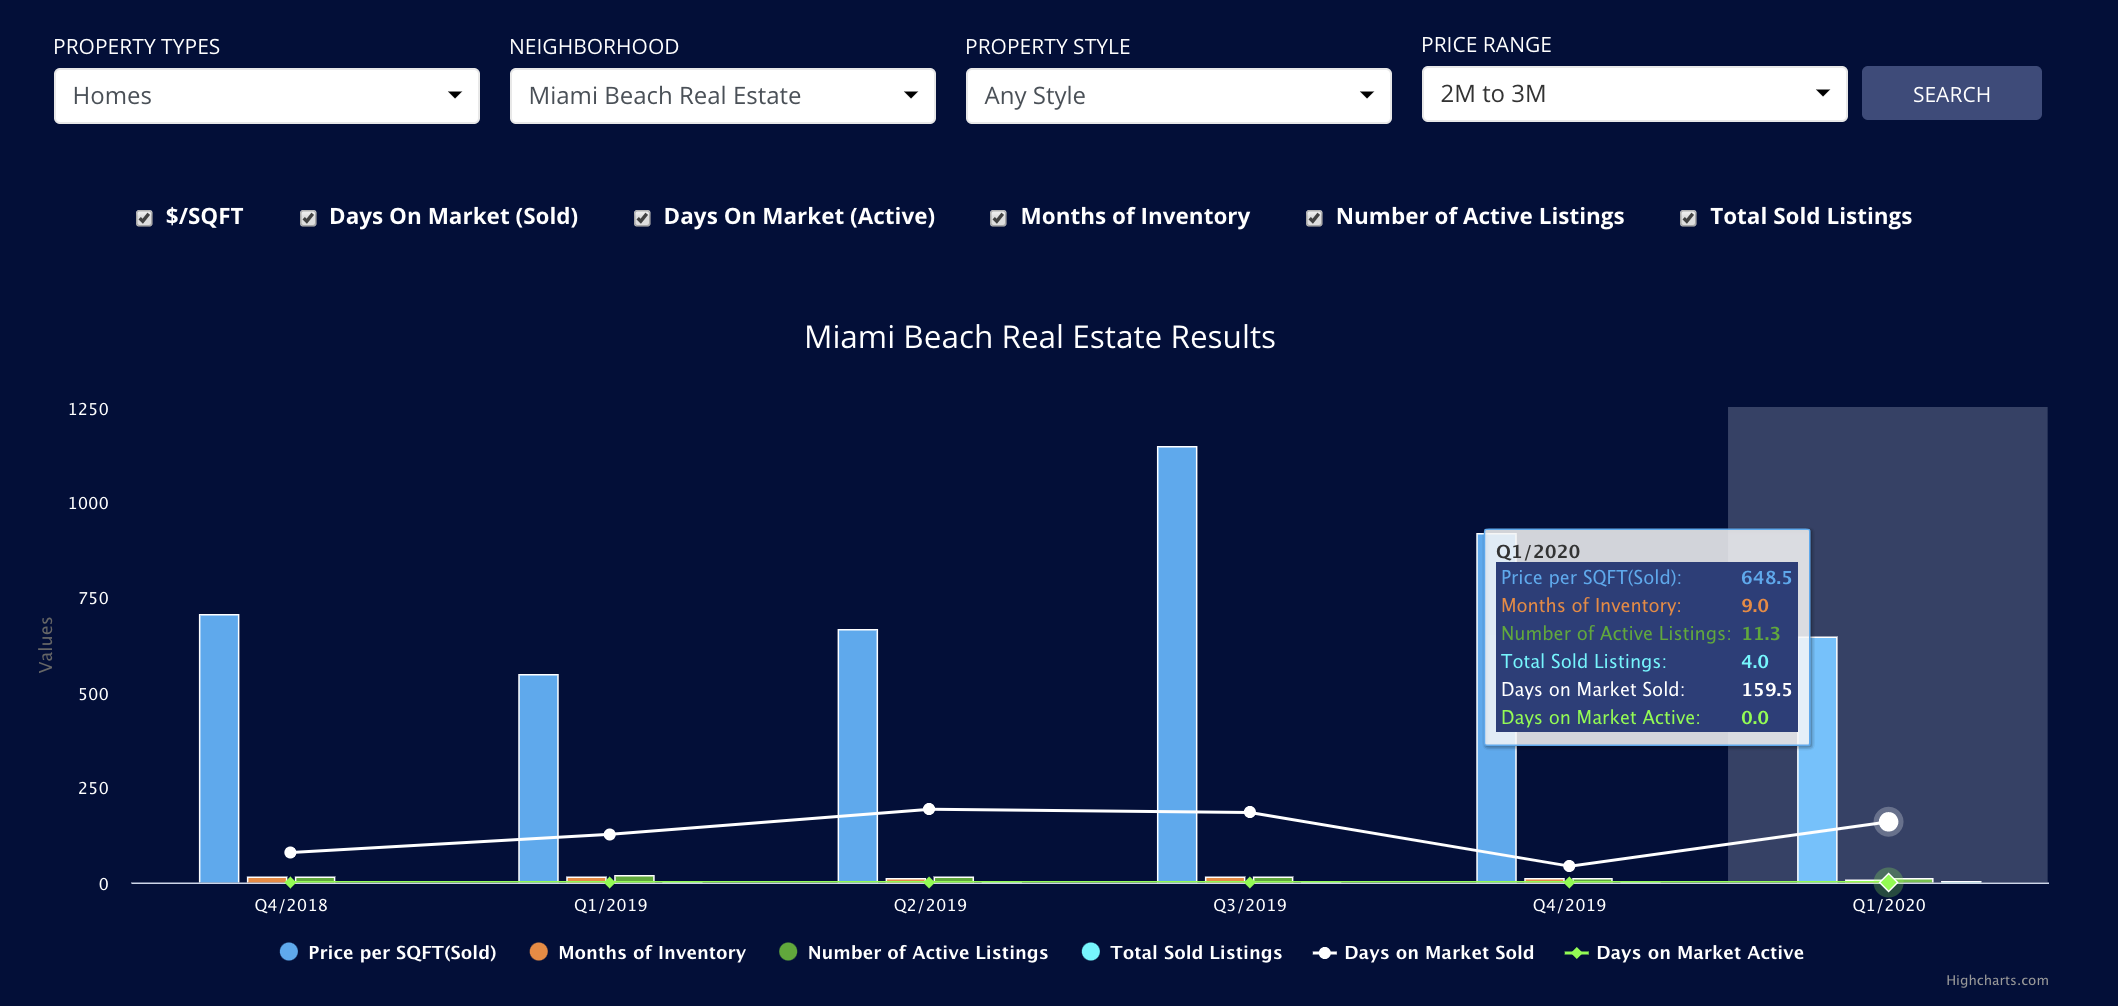
The Miami Beach housing market has been challenged in both 2018 and 2019. Inventory currently sits at a blended 16-22 months (this means with current inventory it would take 16-22 months to absorb all the product), which definitely makes it a buyer’s market. Other single-family neighborhood markets are faring better. With that said the market is performing better in Q1 2020 than it did in Q1 2019. Sales are up in both the $1-$2m range and the $2-$3m range. Why? We have seen enough reductions in listings that sales have accelerated.
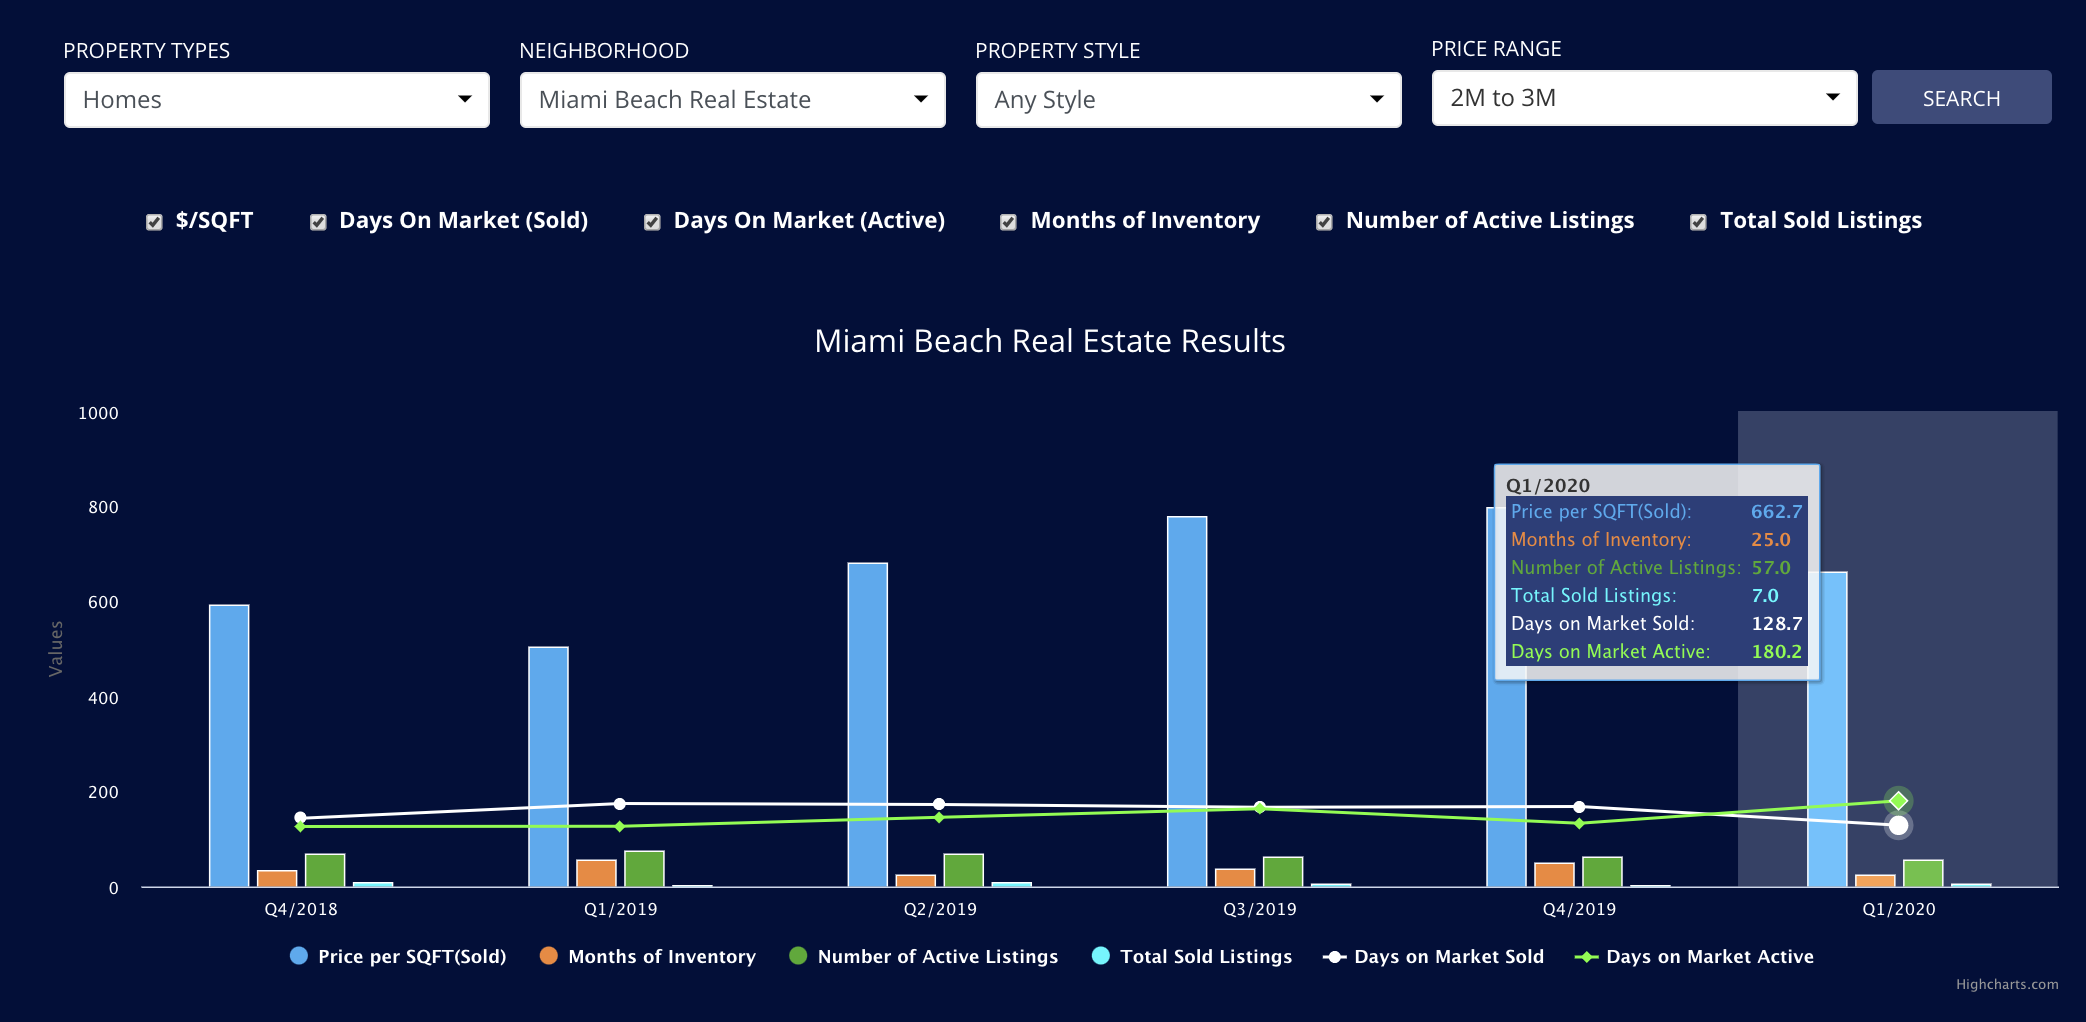
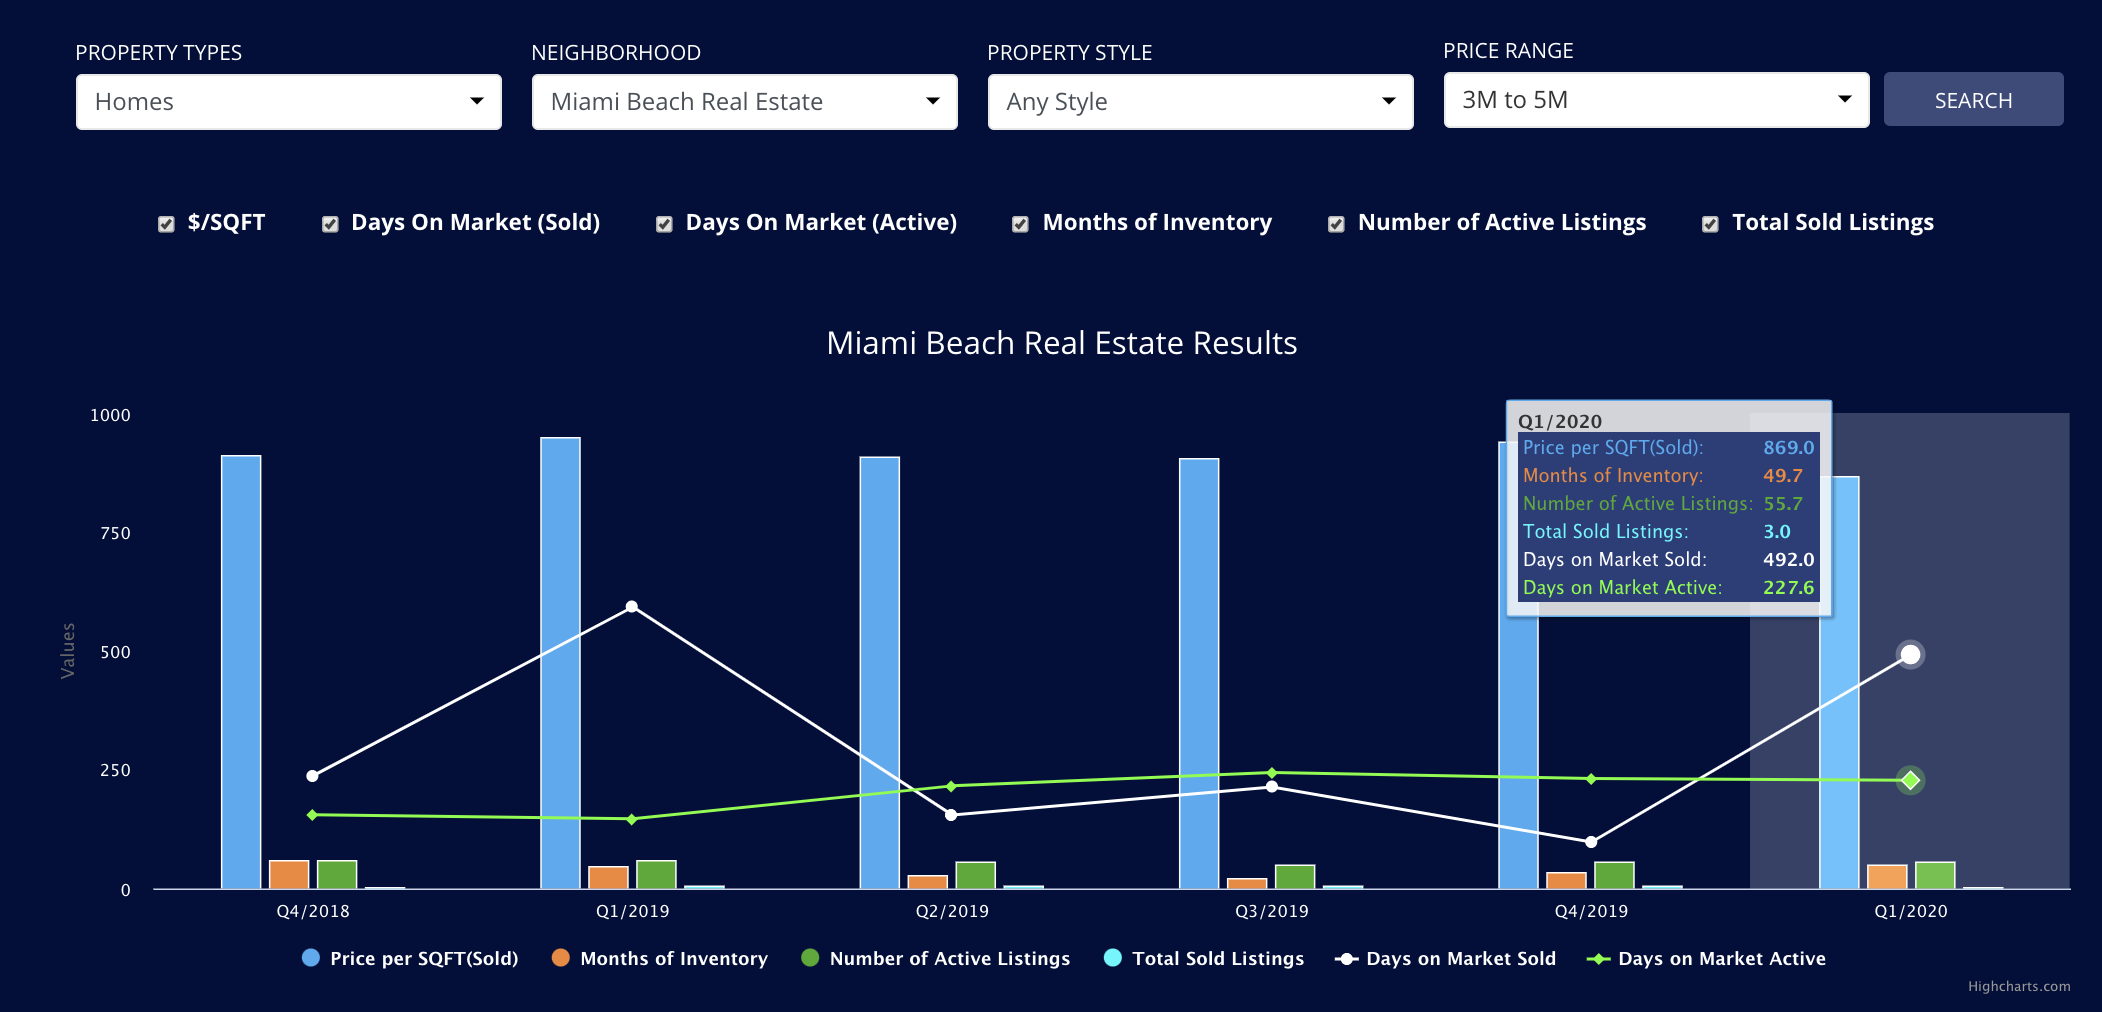
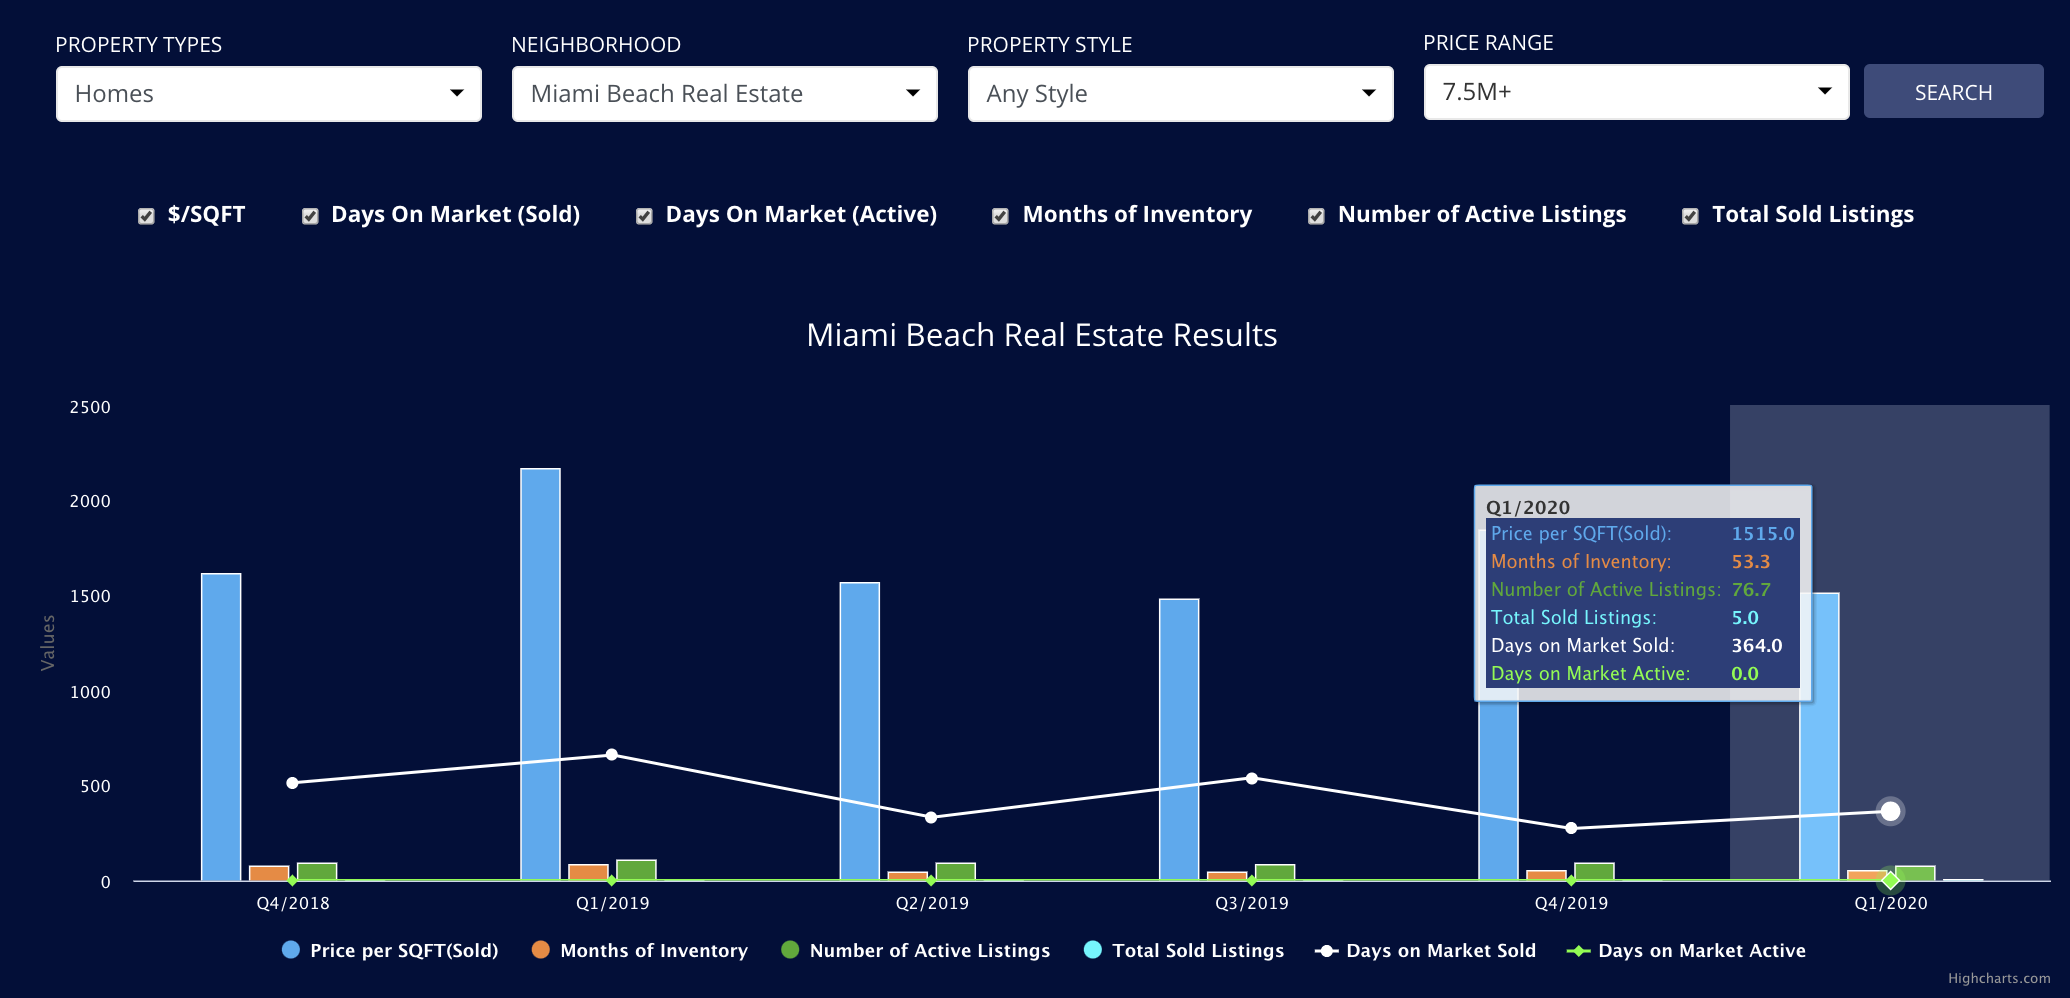
In part 2 we discussed the $3M-$5M market as one with slow sales and many opportunities for those who want to take advantage and get great deals. The ultra luxury single family market (Over $5m) is slow with 45 months of inventory and recent sales have seen discounts by as much as 20%! On the other hand the ultra-luxury market of $10M+ is seeing a surge in sales numbers mainly fueled by wealthy tax refugees. For more information please refer to part 1 of our report. How did every Miami Neighborhood Perform in Q1 2020?
Venetian and Miami Beach Island Homes – A focus on Waterfront Q1 2020
In 2019 we saw 18 sales of waterfront homes over $10m. This was certainly surprising as it represented a 100% increase from the year before. So what has been happening in 2020? Just 4 sales on the Islands (Palm, Star, Hibiscus, Sunset Islands and the Venetian Islands) so far this year.
Currently we have an incredible 92 waterfront listings across the Islands, ranging from $2.5m to $40m. An incredible 19 of these are new or very nearly new homes (built 2017-2020). The quality of options has certainly gone up in the last few years and buyers are spoilt for choice.
Obviously with COVID-19 the market has slowed and there are only 2 pending deals right now, both of which went pending at the end of March before the full awareness of Corona kicked in. Expect so good deals to occur in 2020 as inventory runs high.
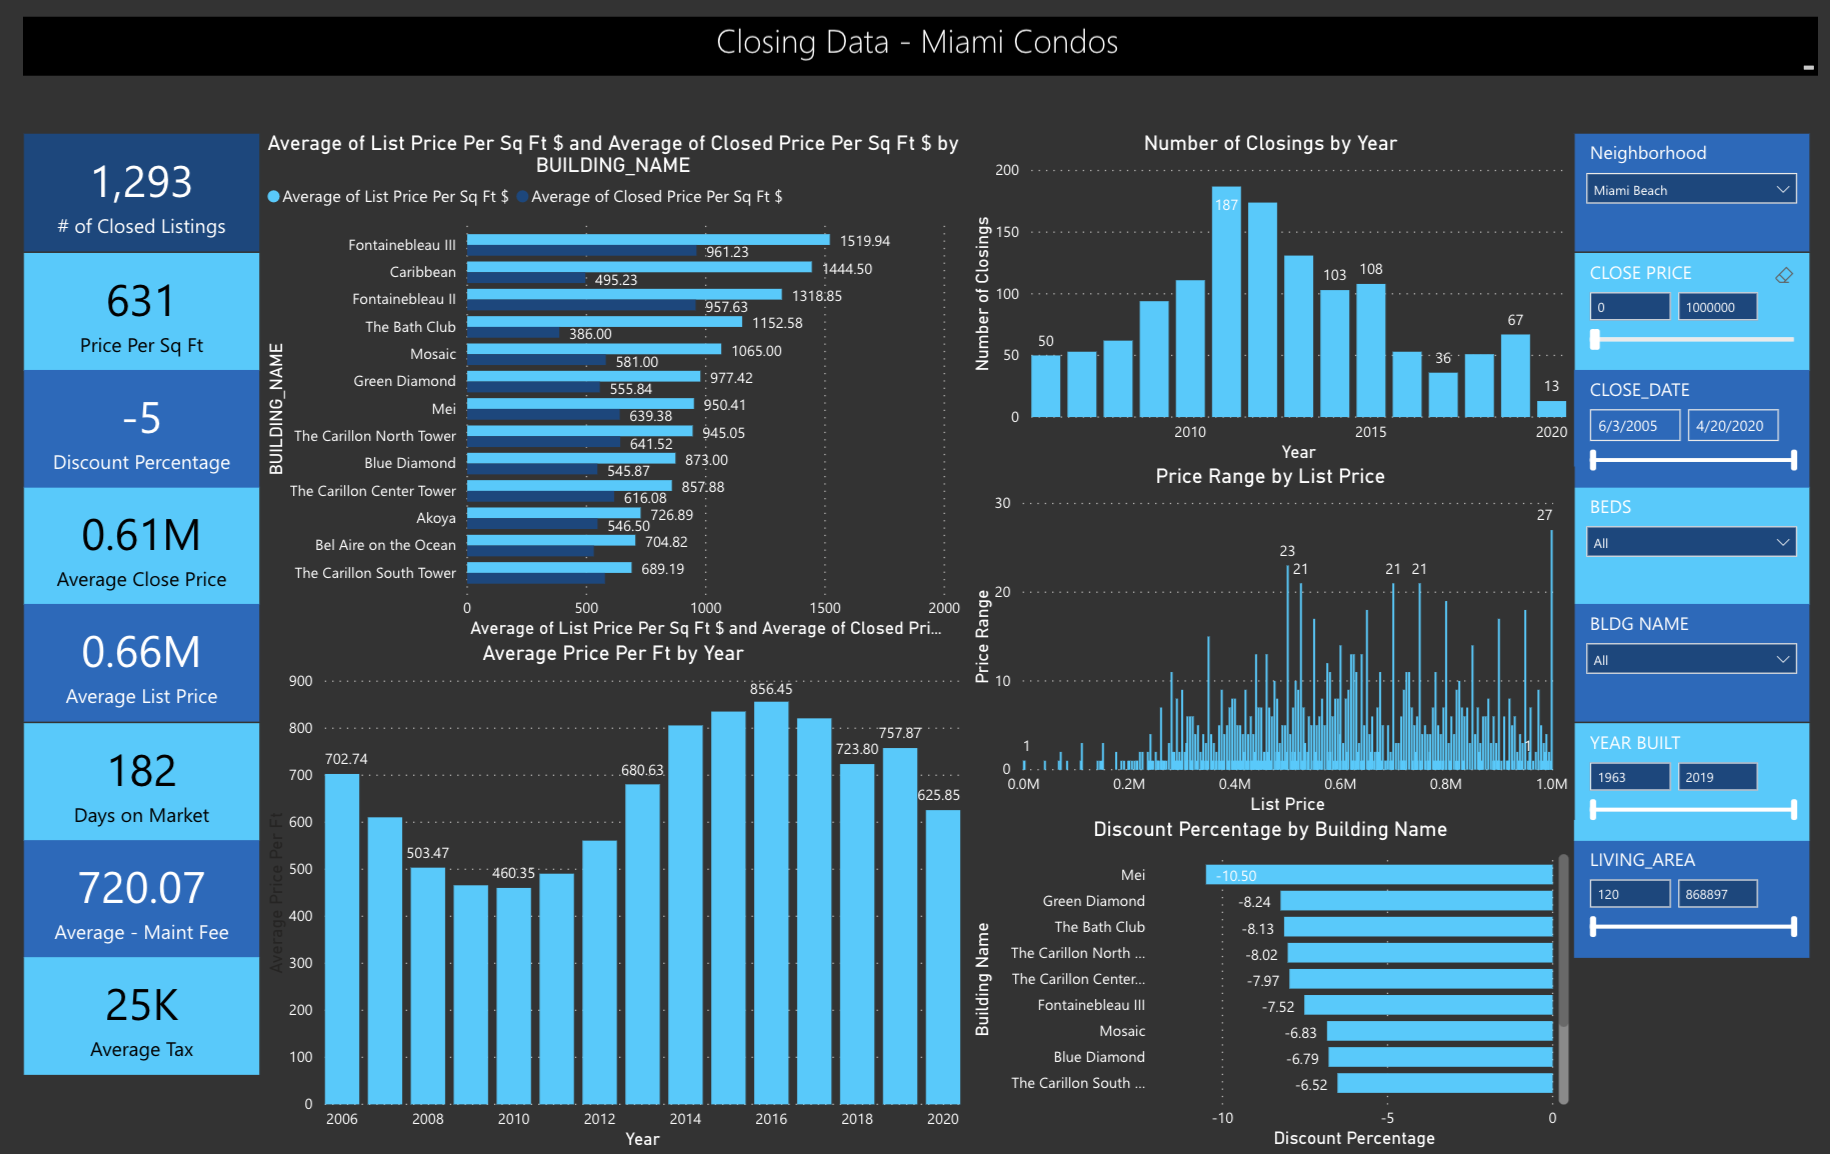
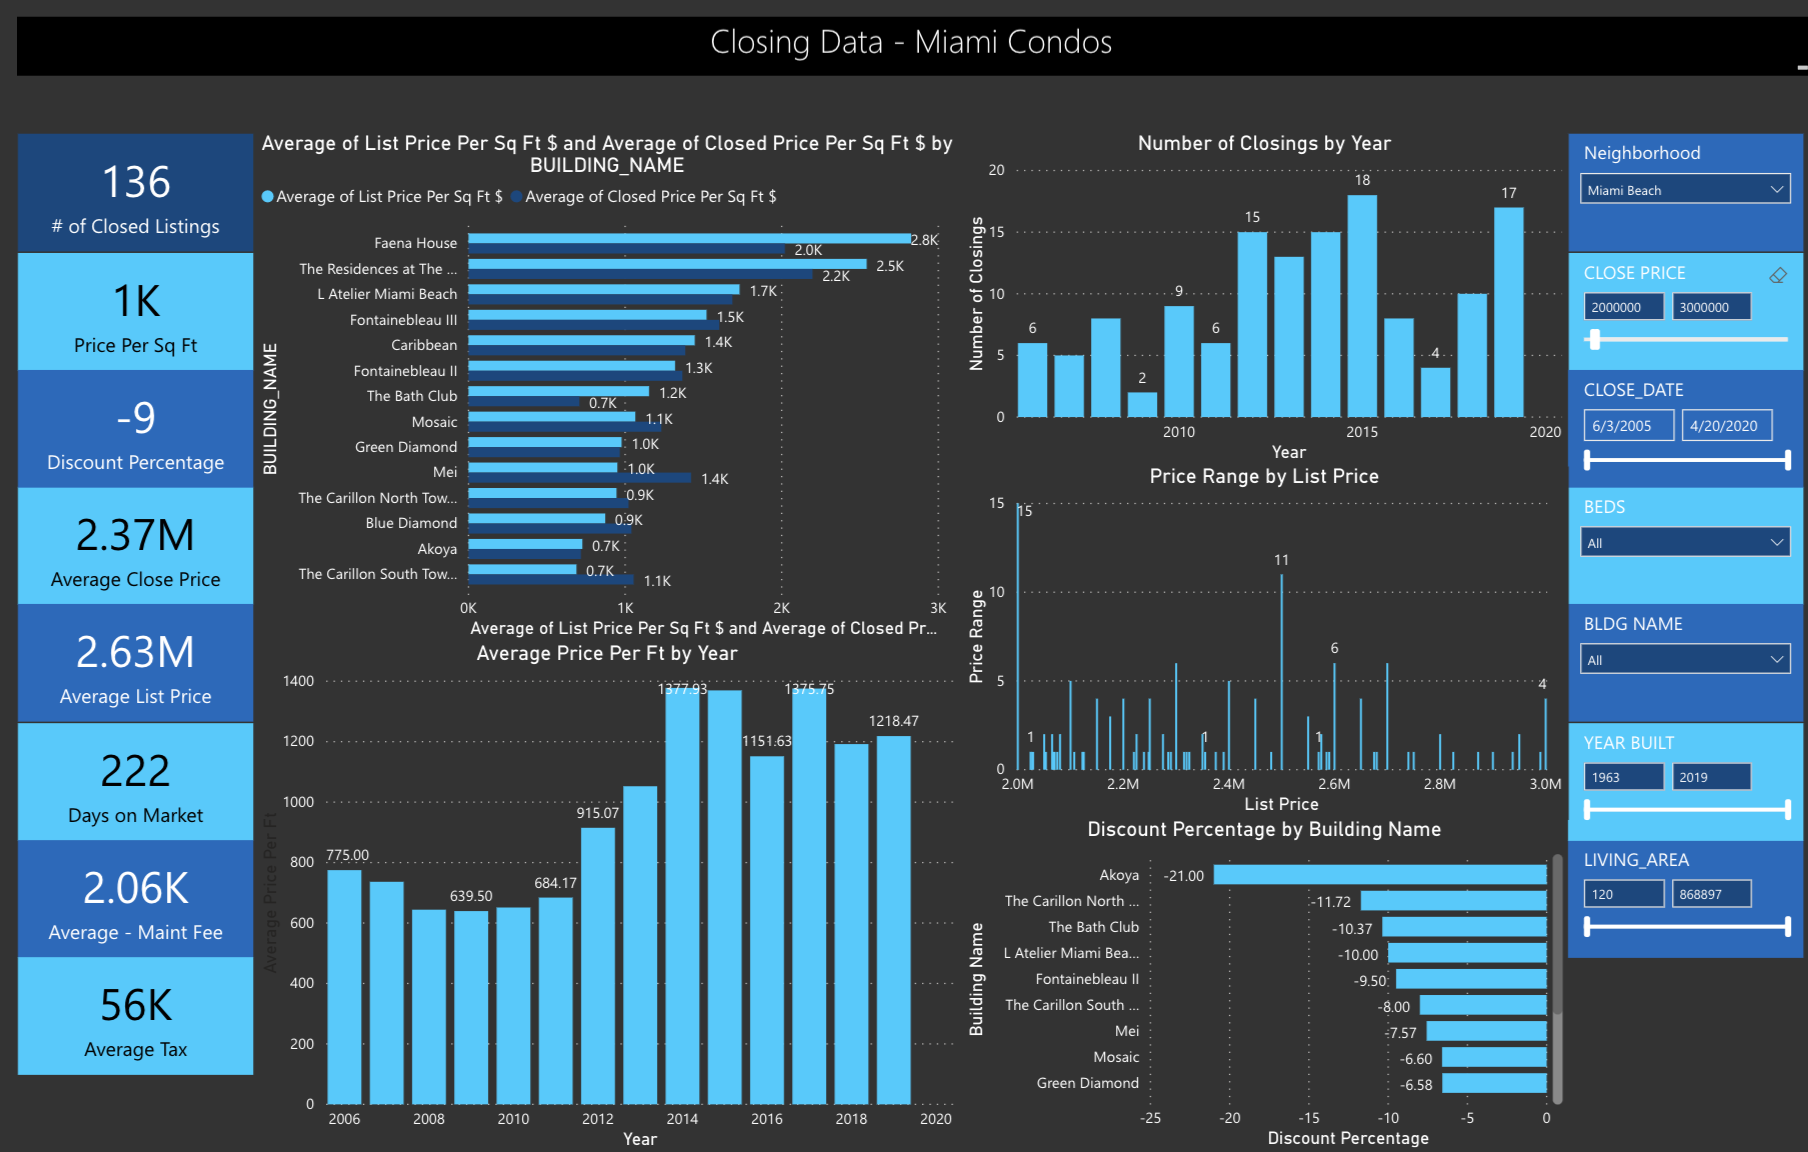
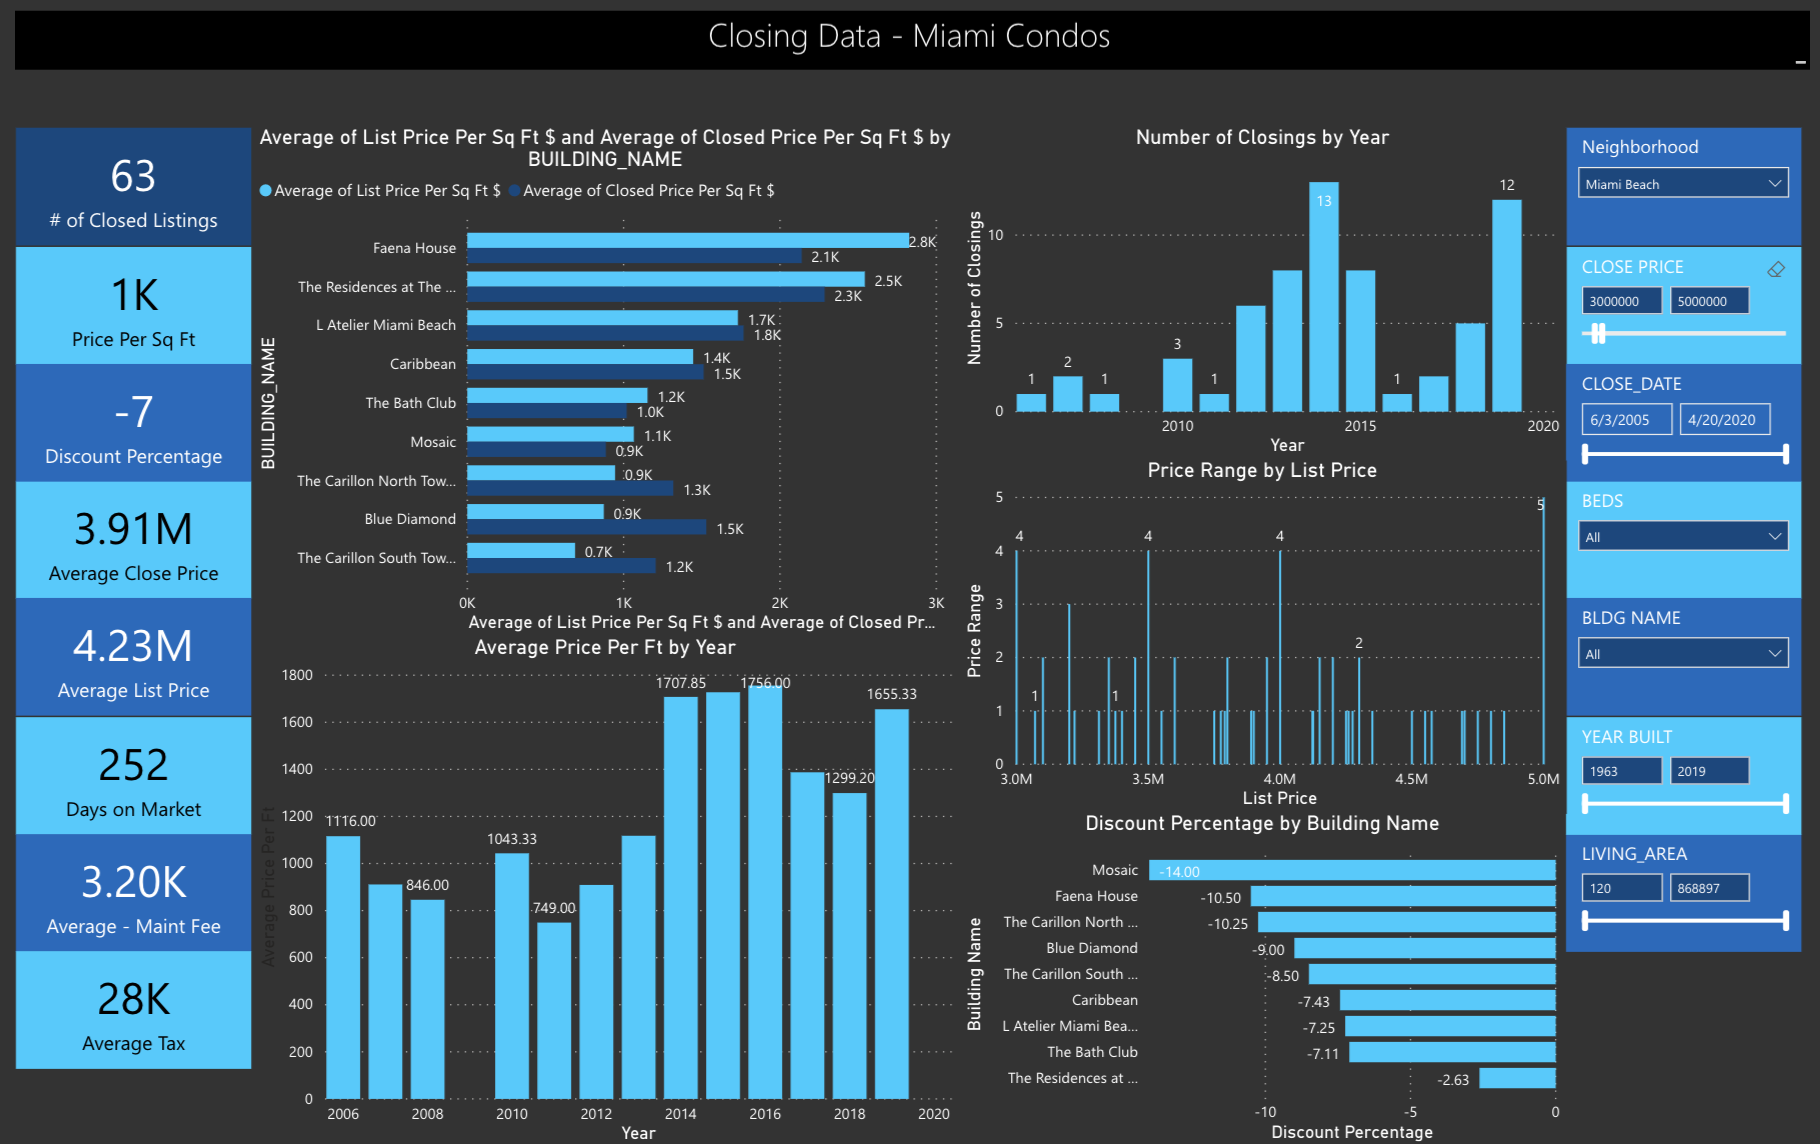
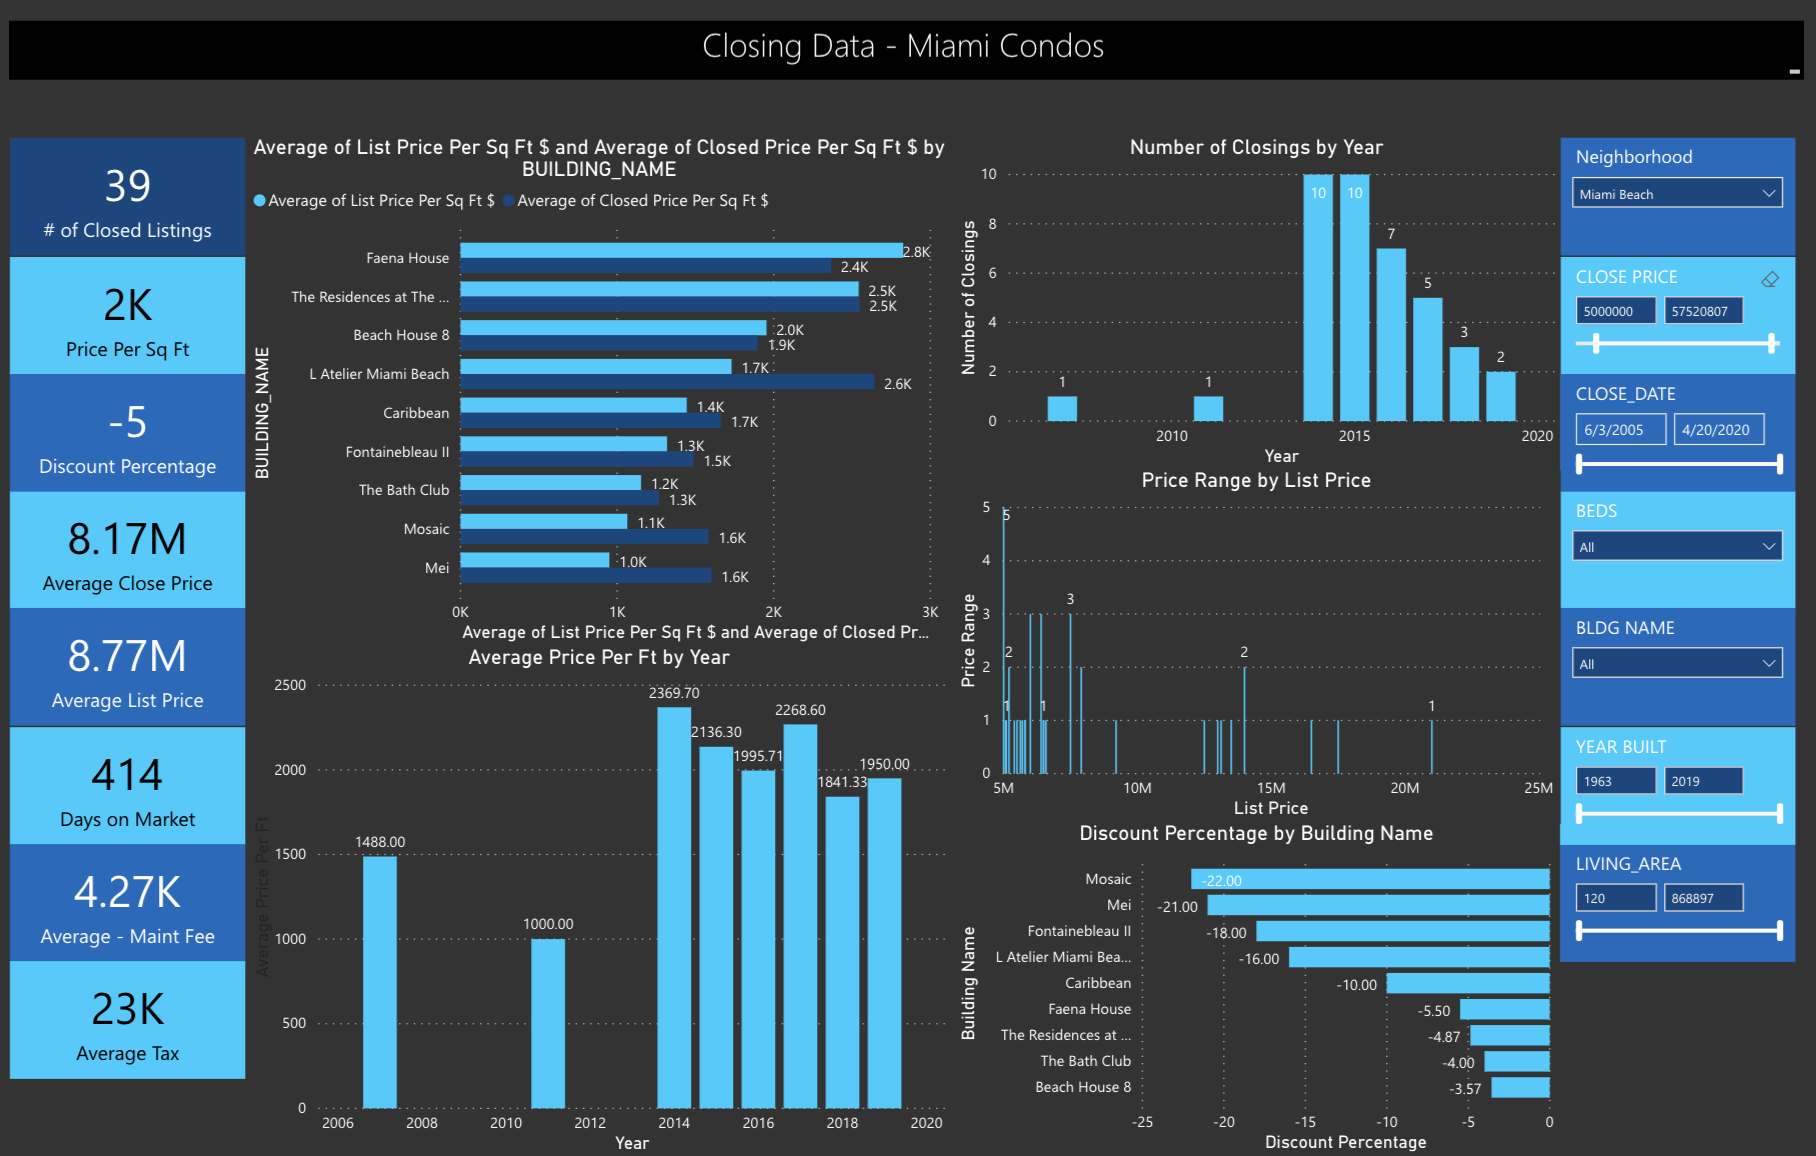
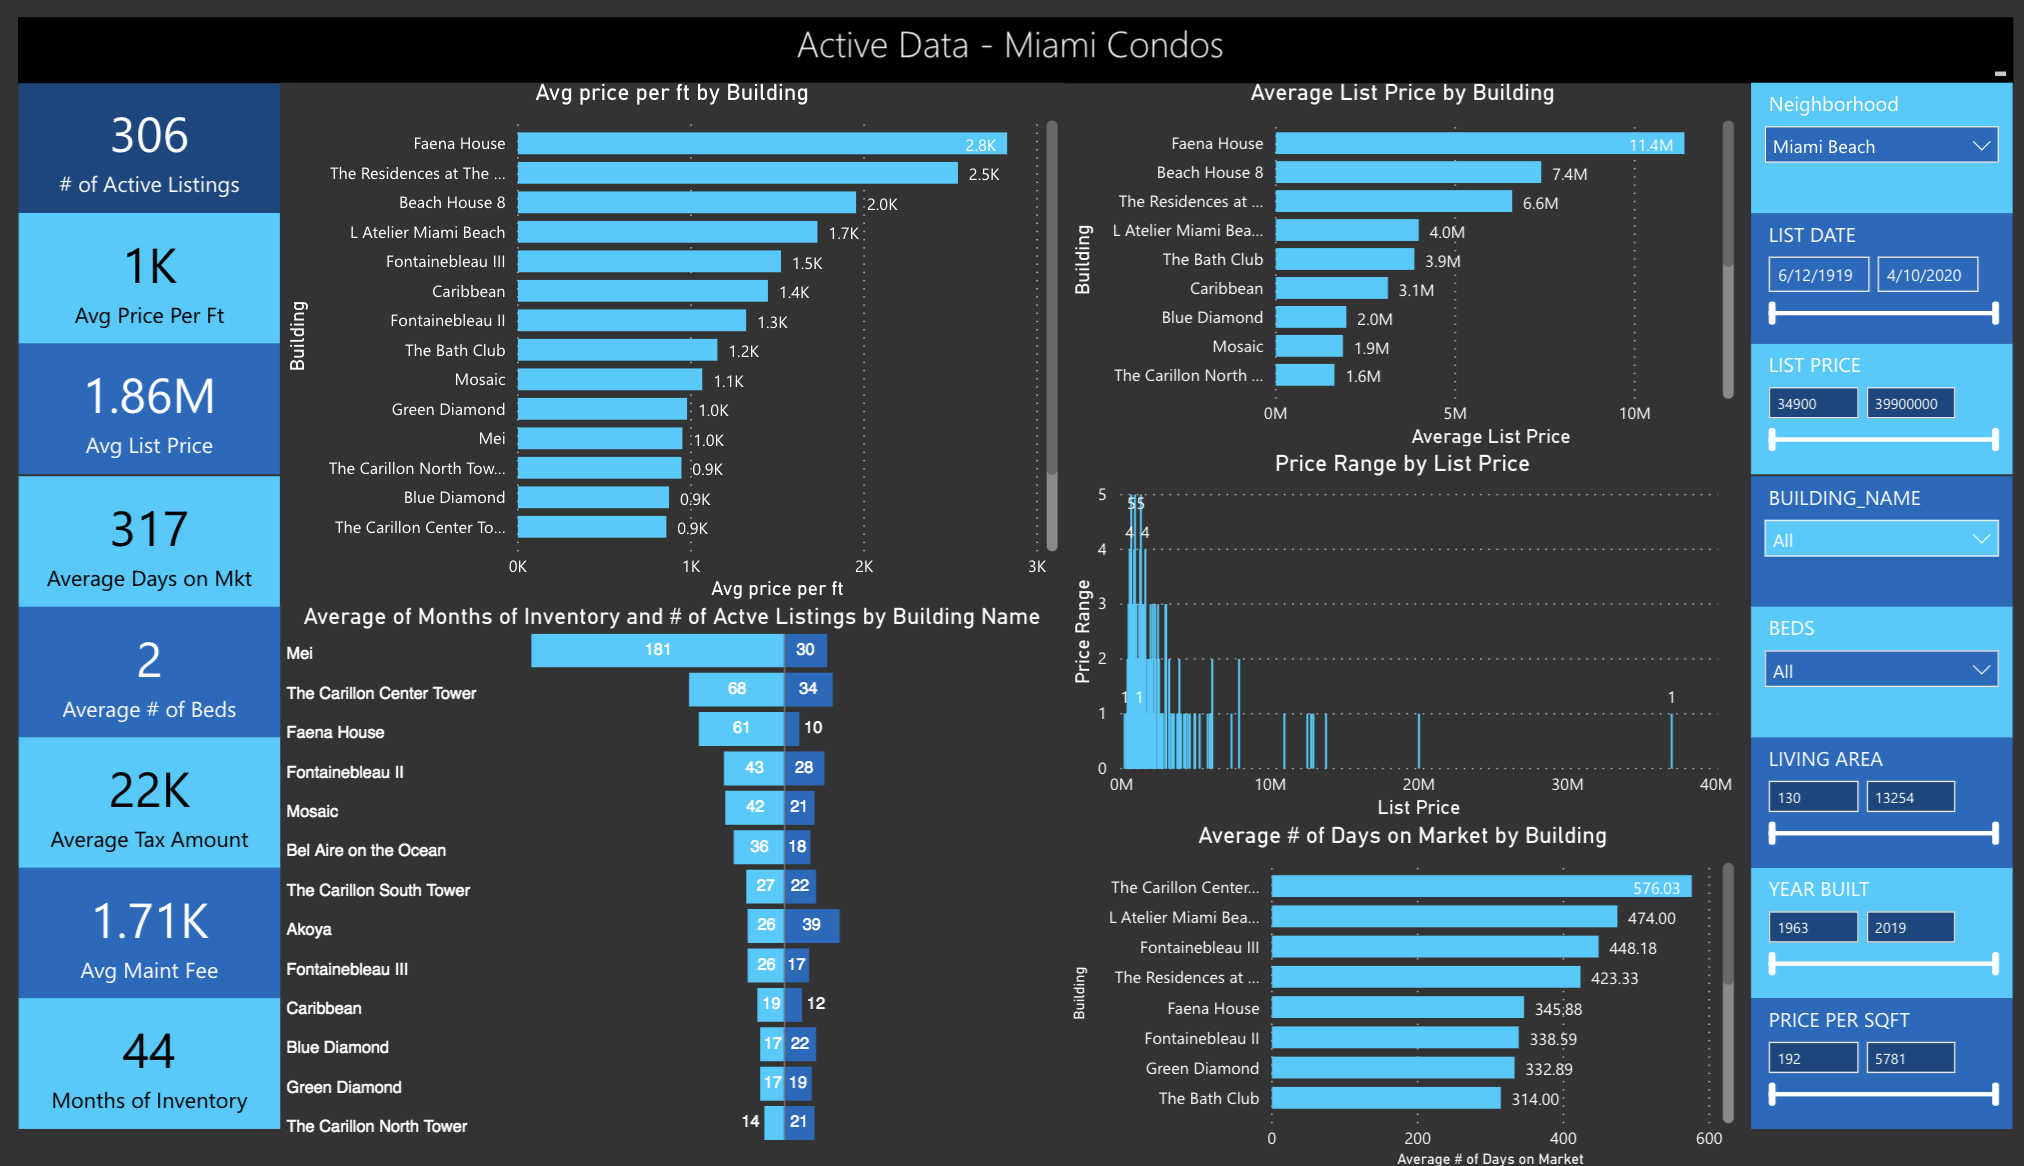
Miami Beach Condos Q1 2020
Miami Beach condo sales slowed down significantly in Q1 2020 (18 sales) compared to Q1 2019 (35 sales). How can we account for this slow down? Simply put; When we take a closer look at the different price points, we see that the decrease in the average price per sqft is due to the fact that there are no sales in 2020 over $2 Mil and below the $2 Mil mark the price per sqft has been much lower this year compared to Q1 of 2019. Up to $1m we saw an average sales price per sqft of $838 in Q1 2019 compared to $653 per sq ft in Q1 2020 and up to $2m we recorded $901 per sqft in Q1 2019 and $831 per sqft in Q1 2020.
Even if the lower-end market is more dynamic, product still sits on the market for over 250 days on average. Sellers seem to be more realistic with on average 7% discount rates from listing prices while Q1 2019 saw sales discounted up to $19% at Bath Club.
The best performing condos are Caribbean, a boutique condo just north of South Beach, Carillon and Green and Blue Diamond. The last 2 have witnessed 12 sales in the past 6 months with prices steady declining since 2018, but still selling at a good pace for this market. There are clearly two different condo markets in Miami Beach; the market below the $2M mark and another one over that mark, almost hibernated. The sales over $2m are mainly happening in South of Fifth, which is taking the wind out of Miami Beach.
87 Park closings started in Q1 2020 and we see this building (which is located just south of Surfside) bringing in massive sales for the luxury market, which is product over $5m.
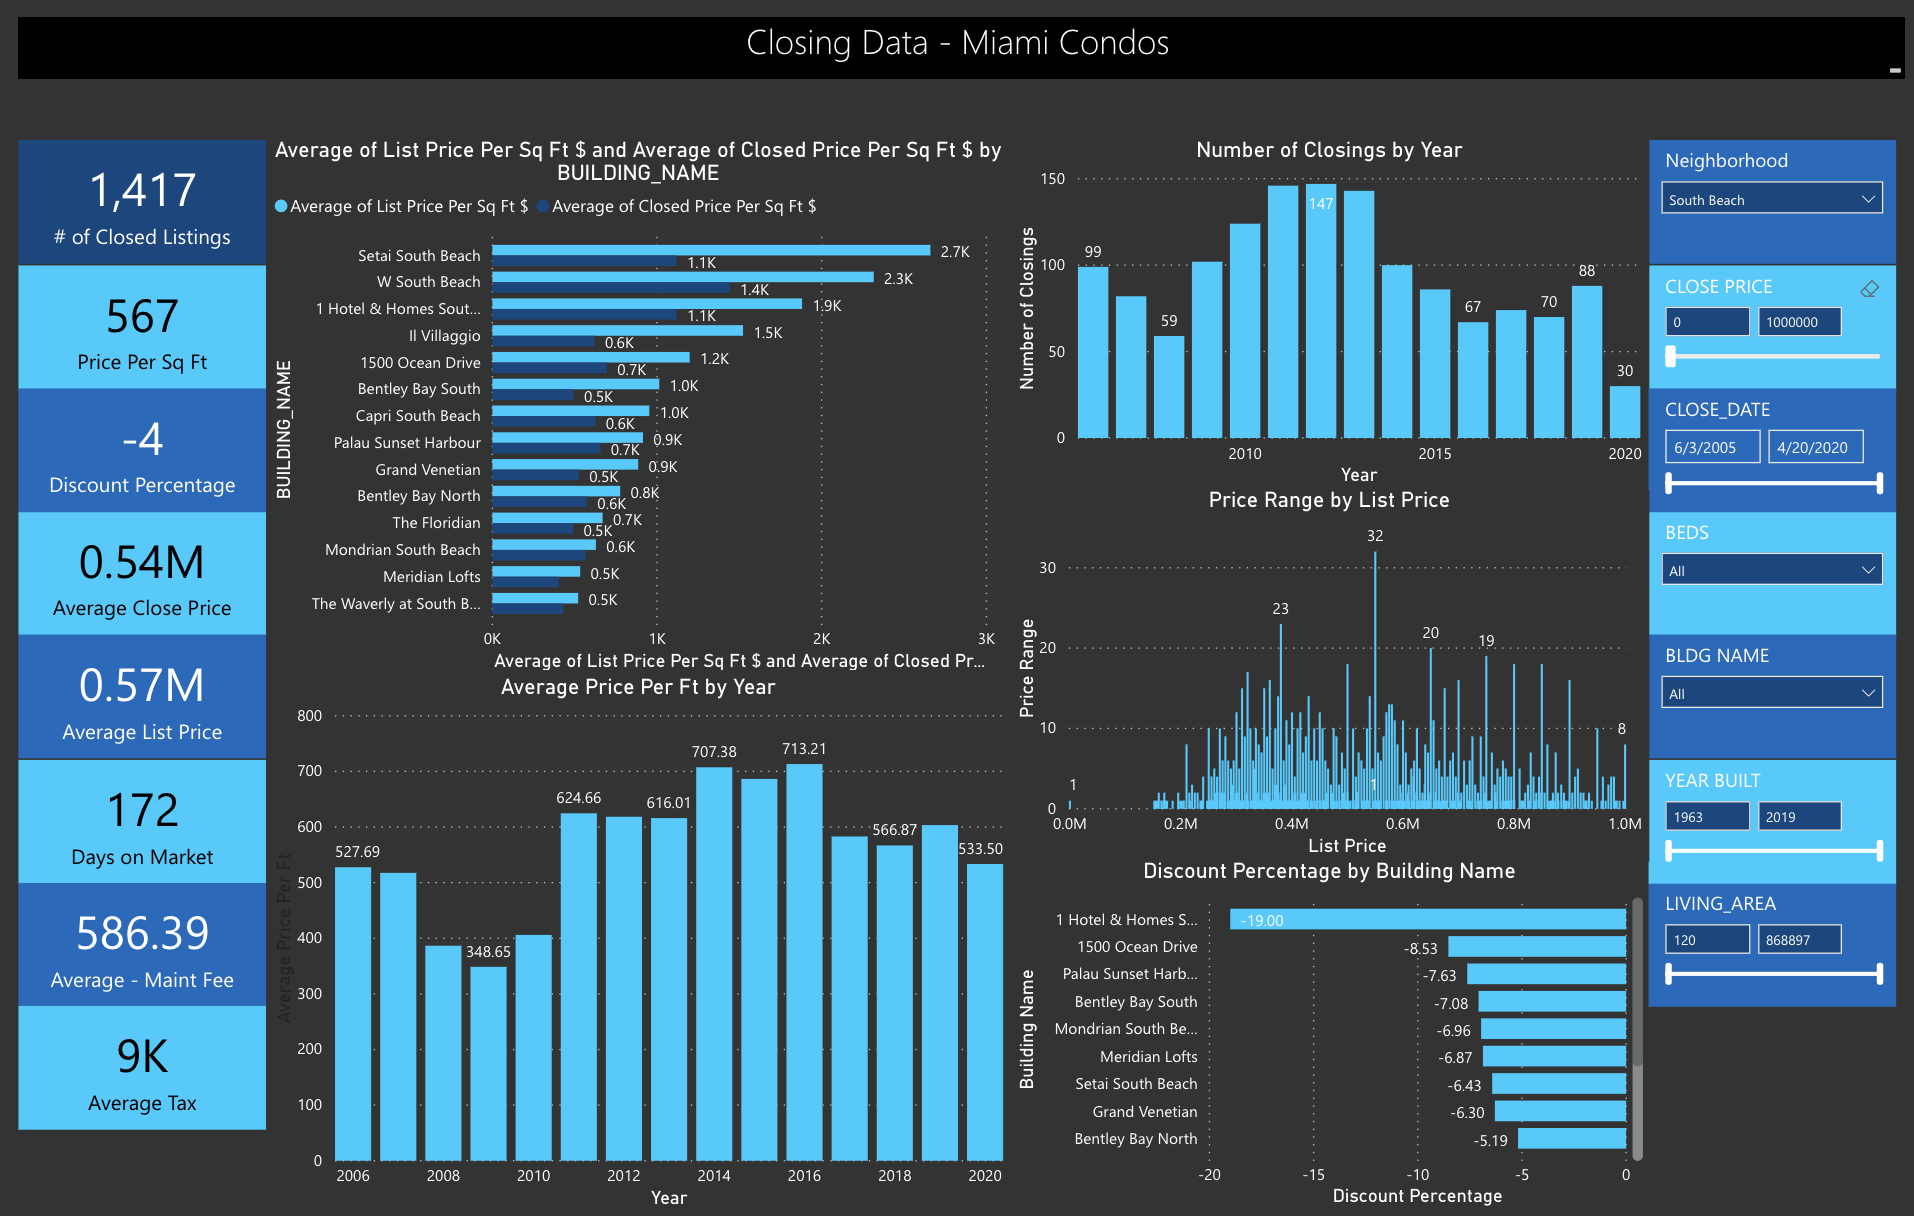
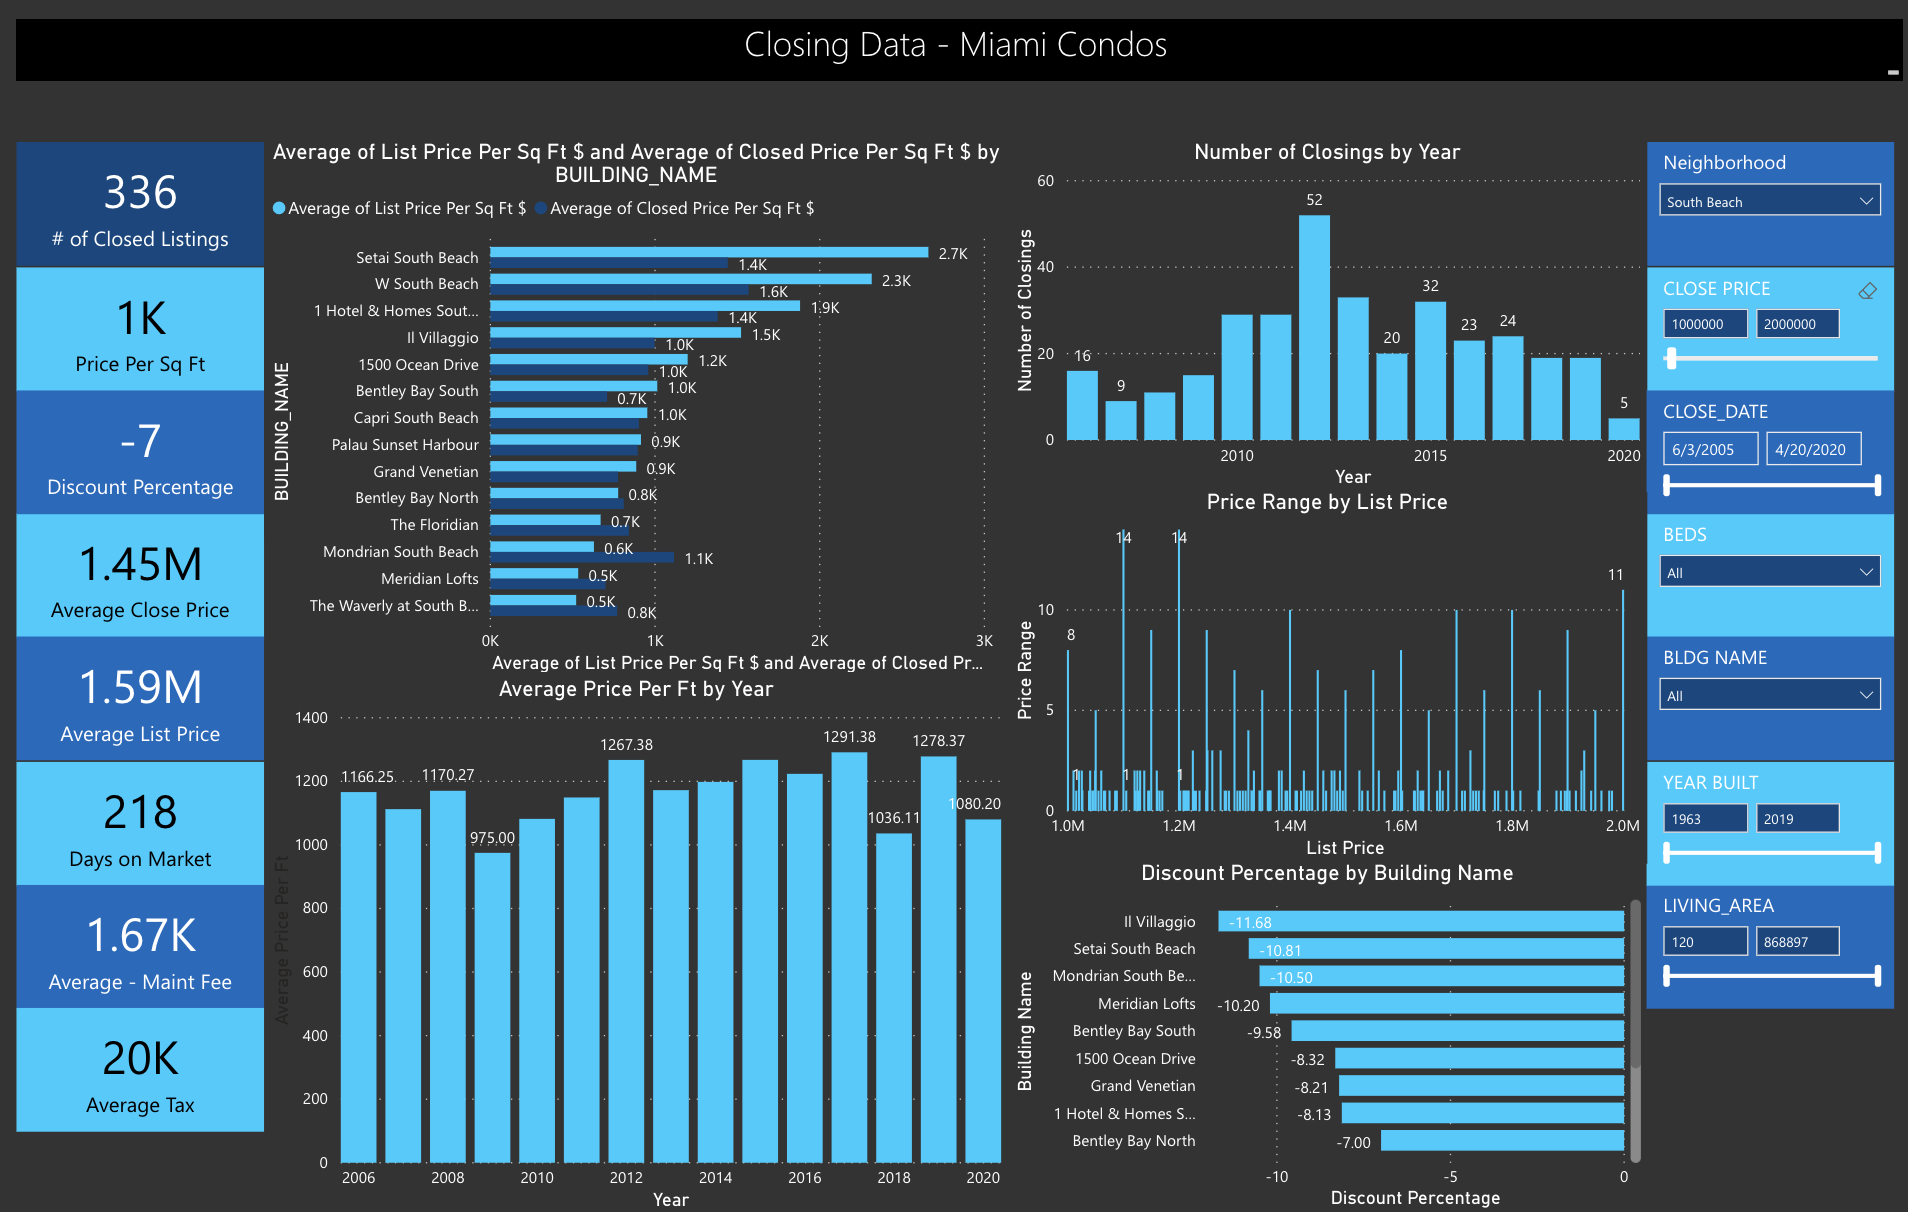
South Beach Condos Q1 2020
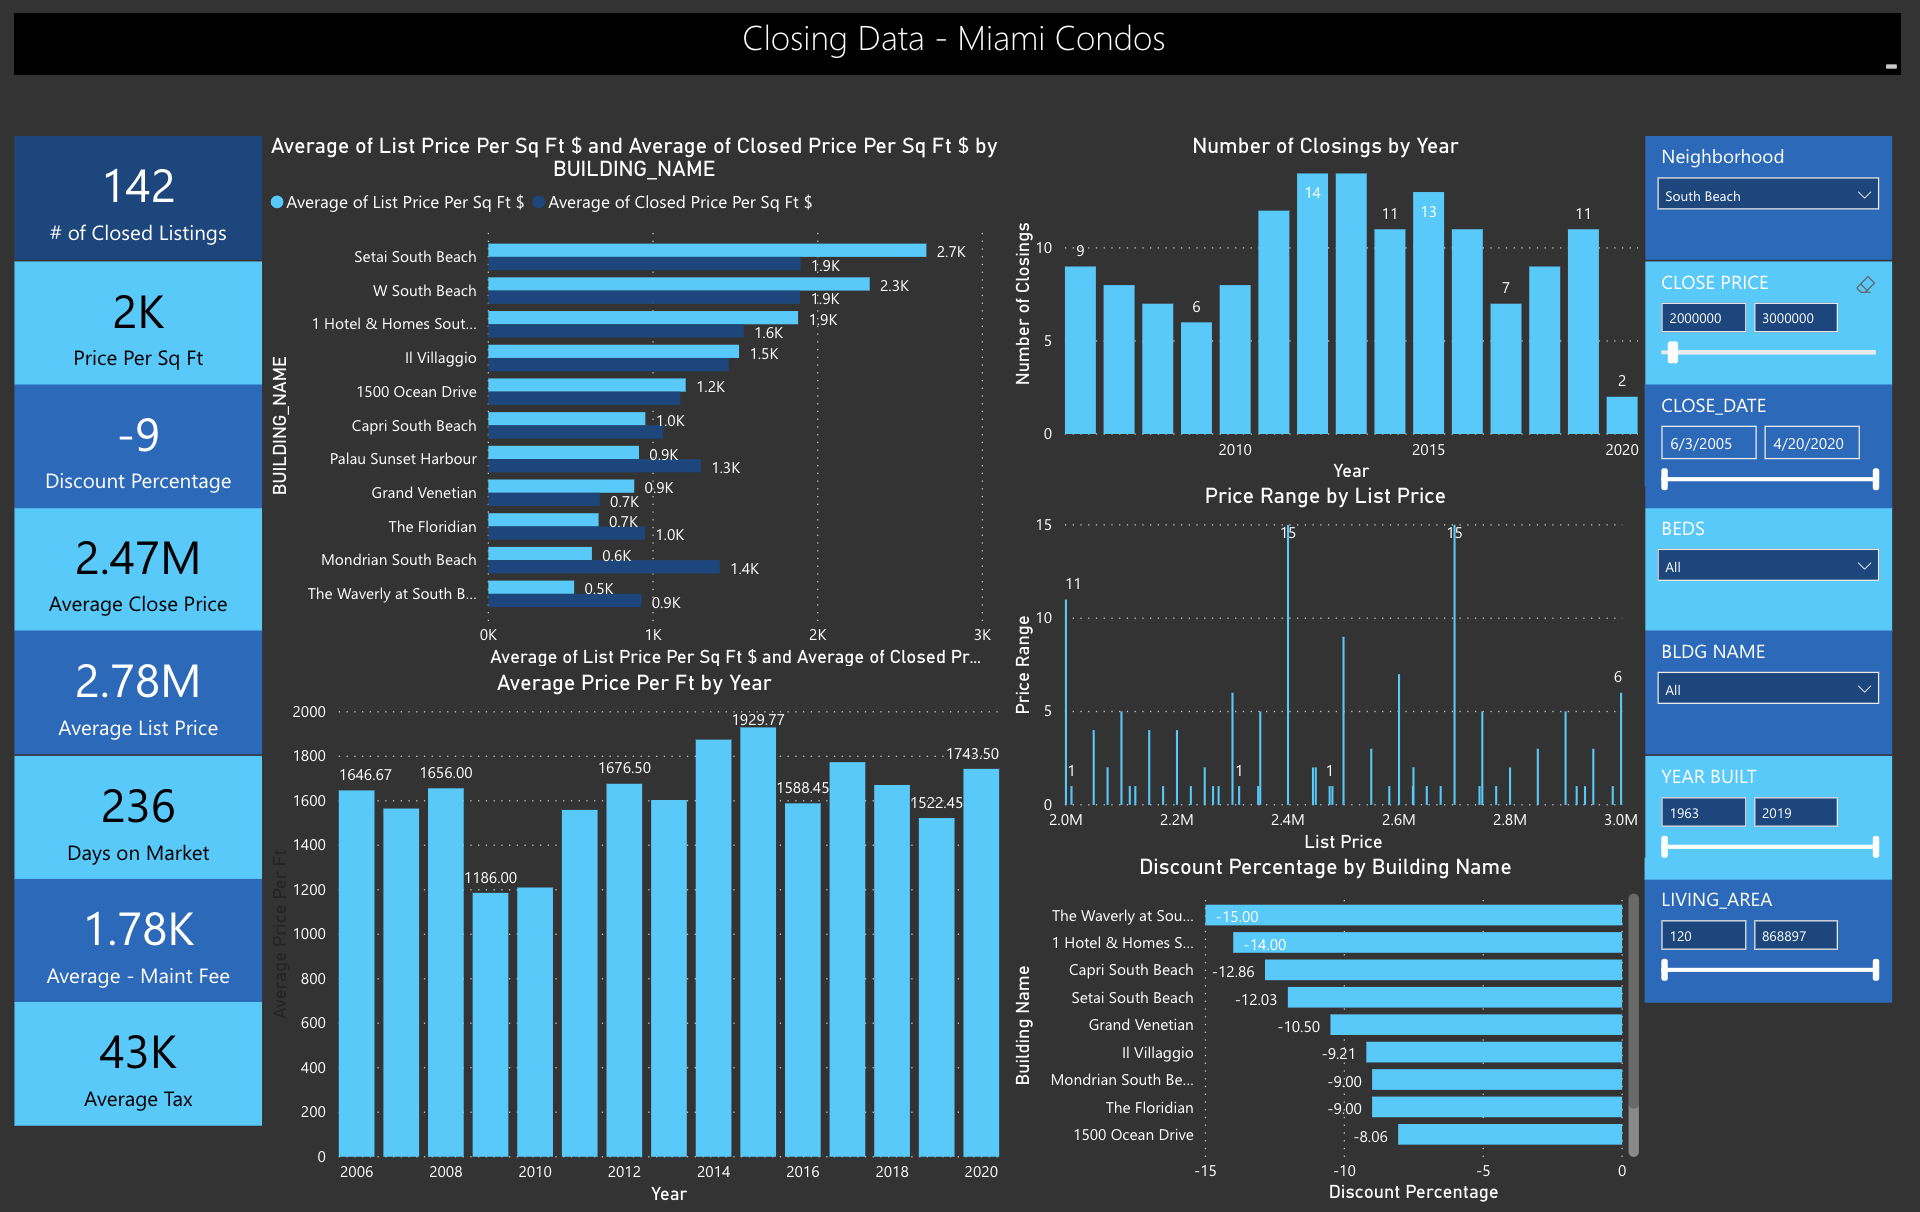
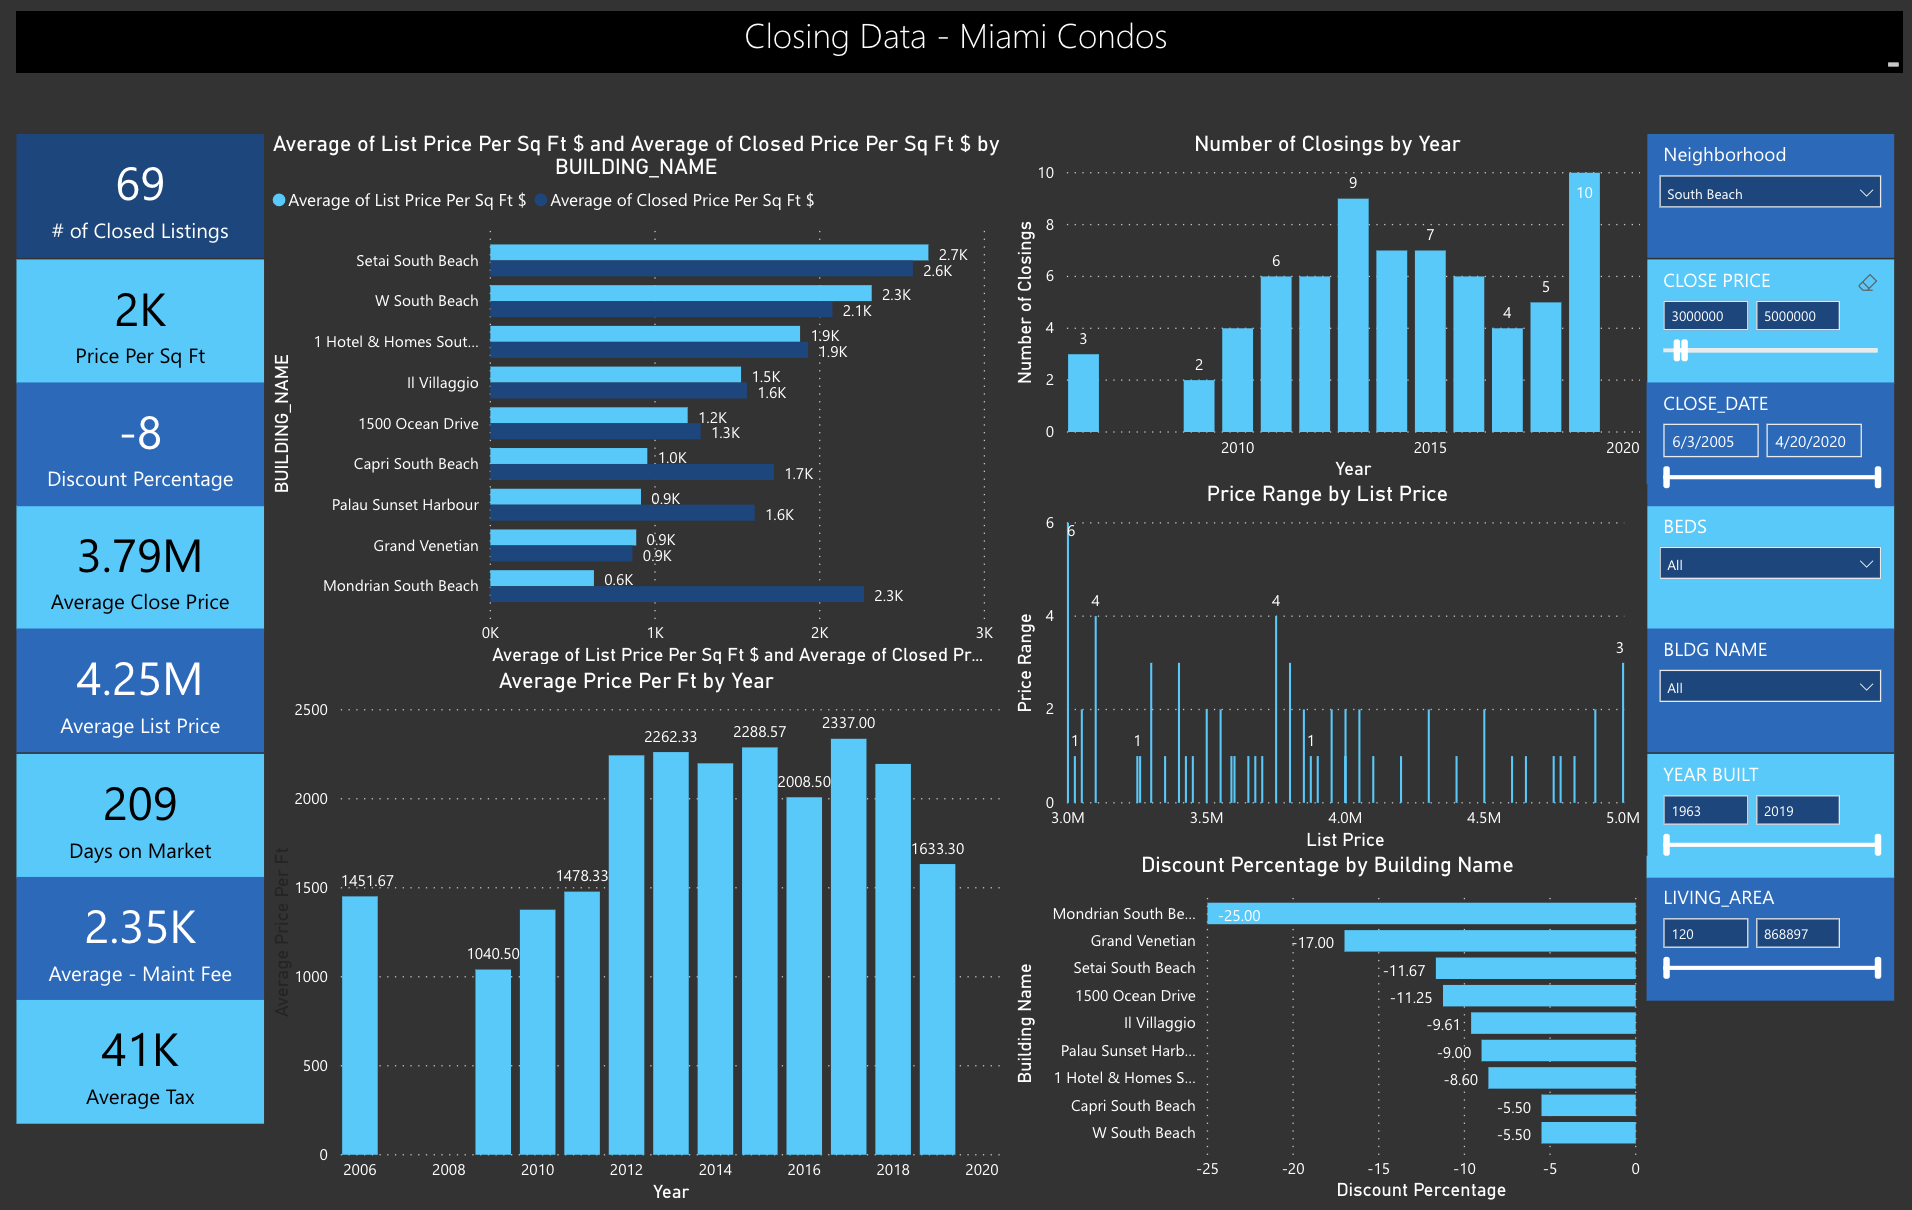
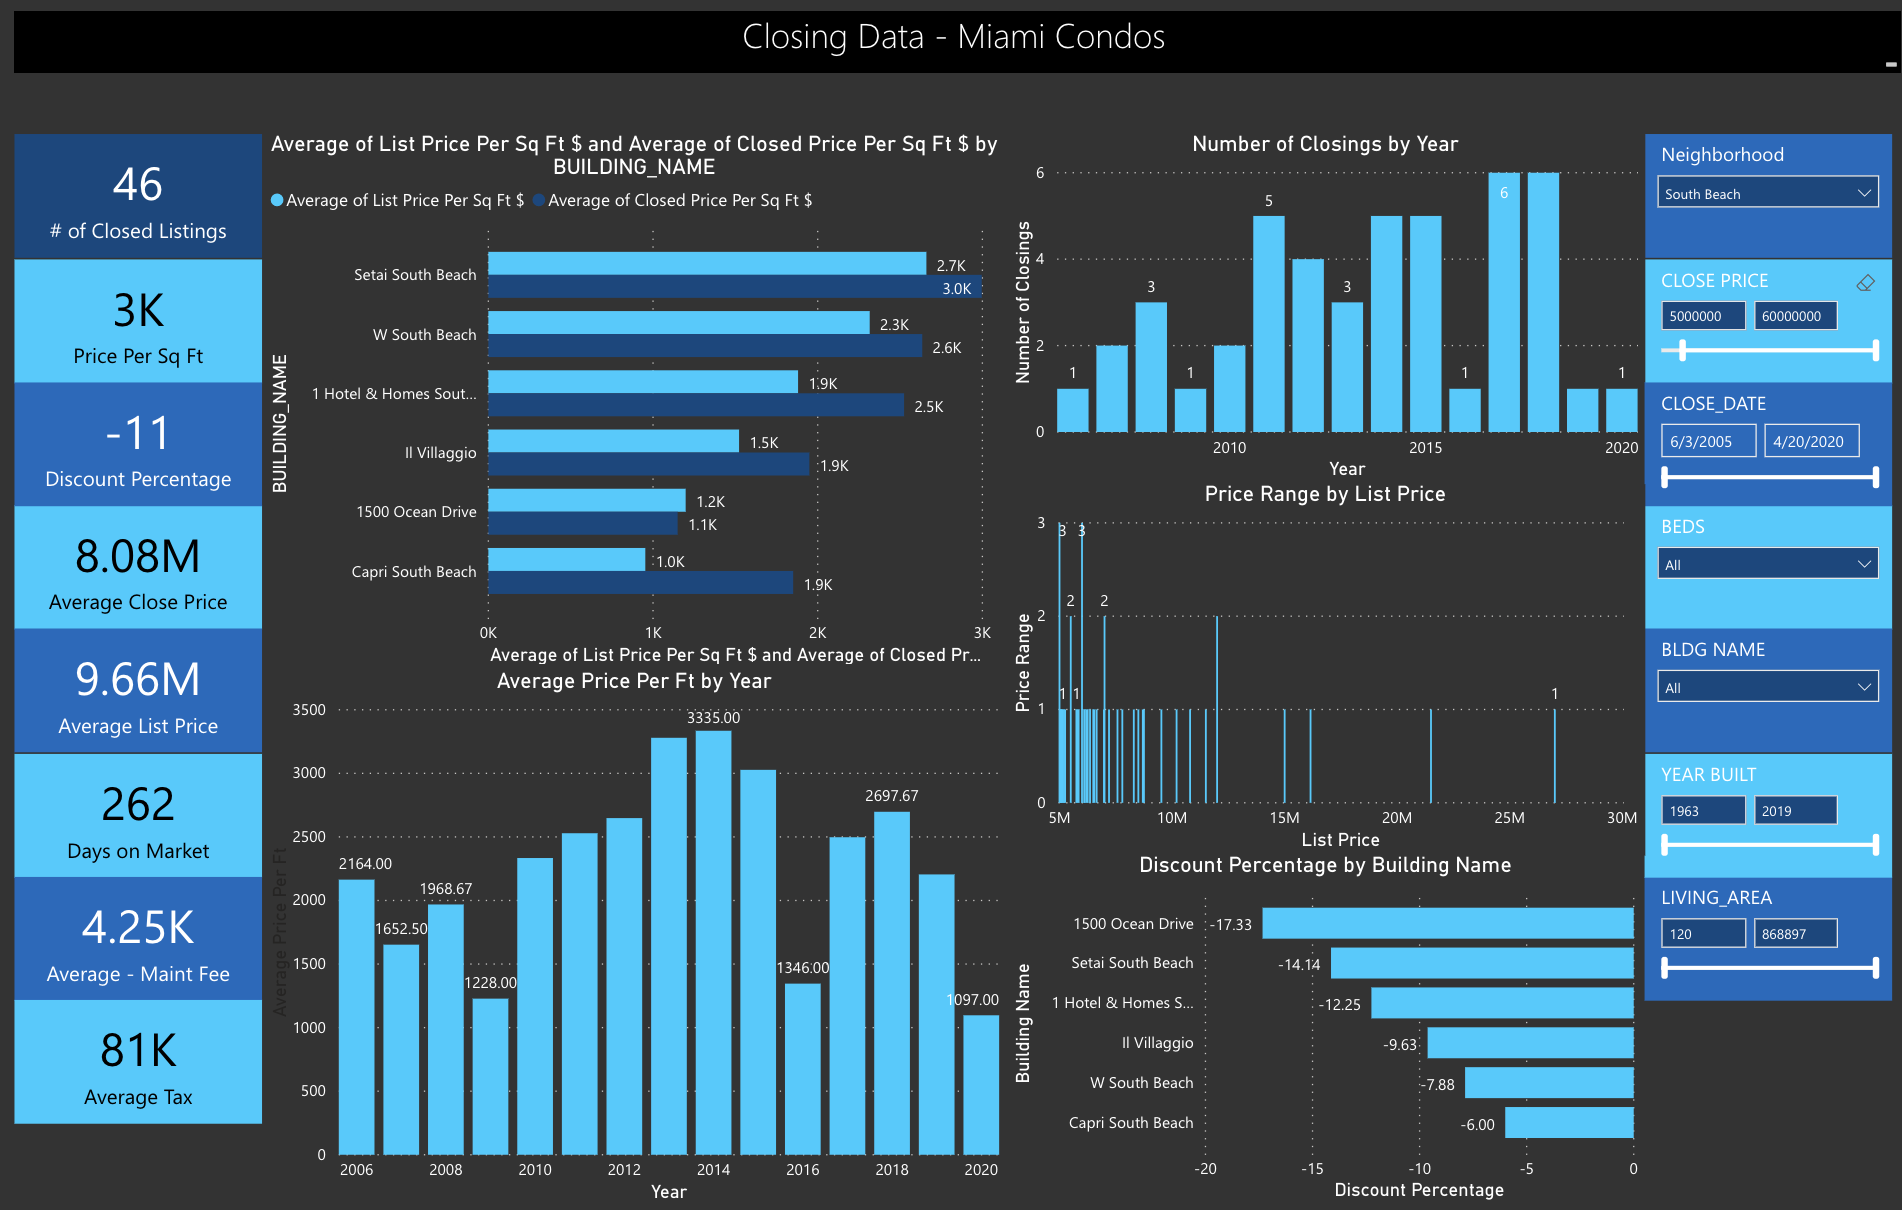
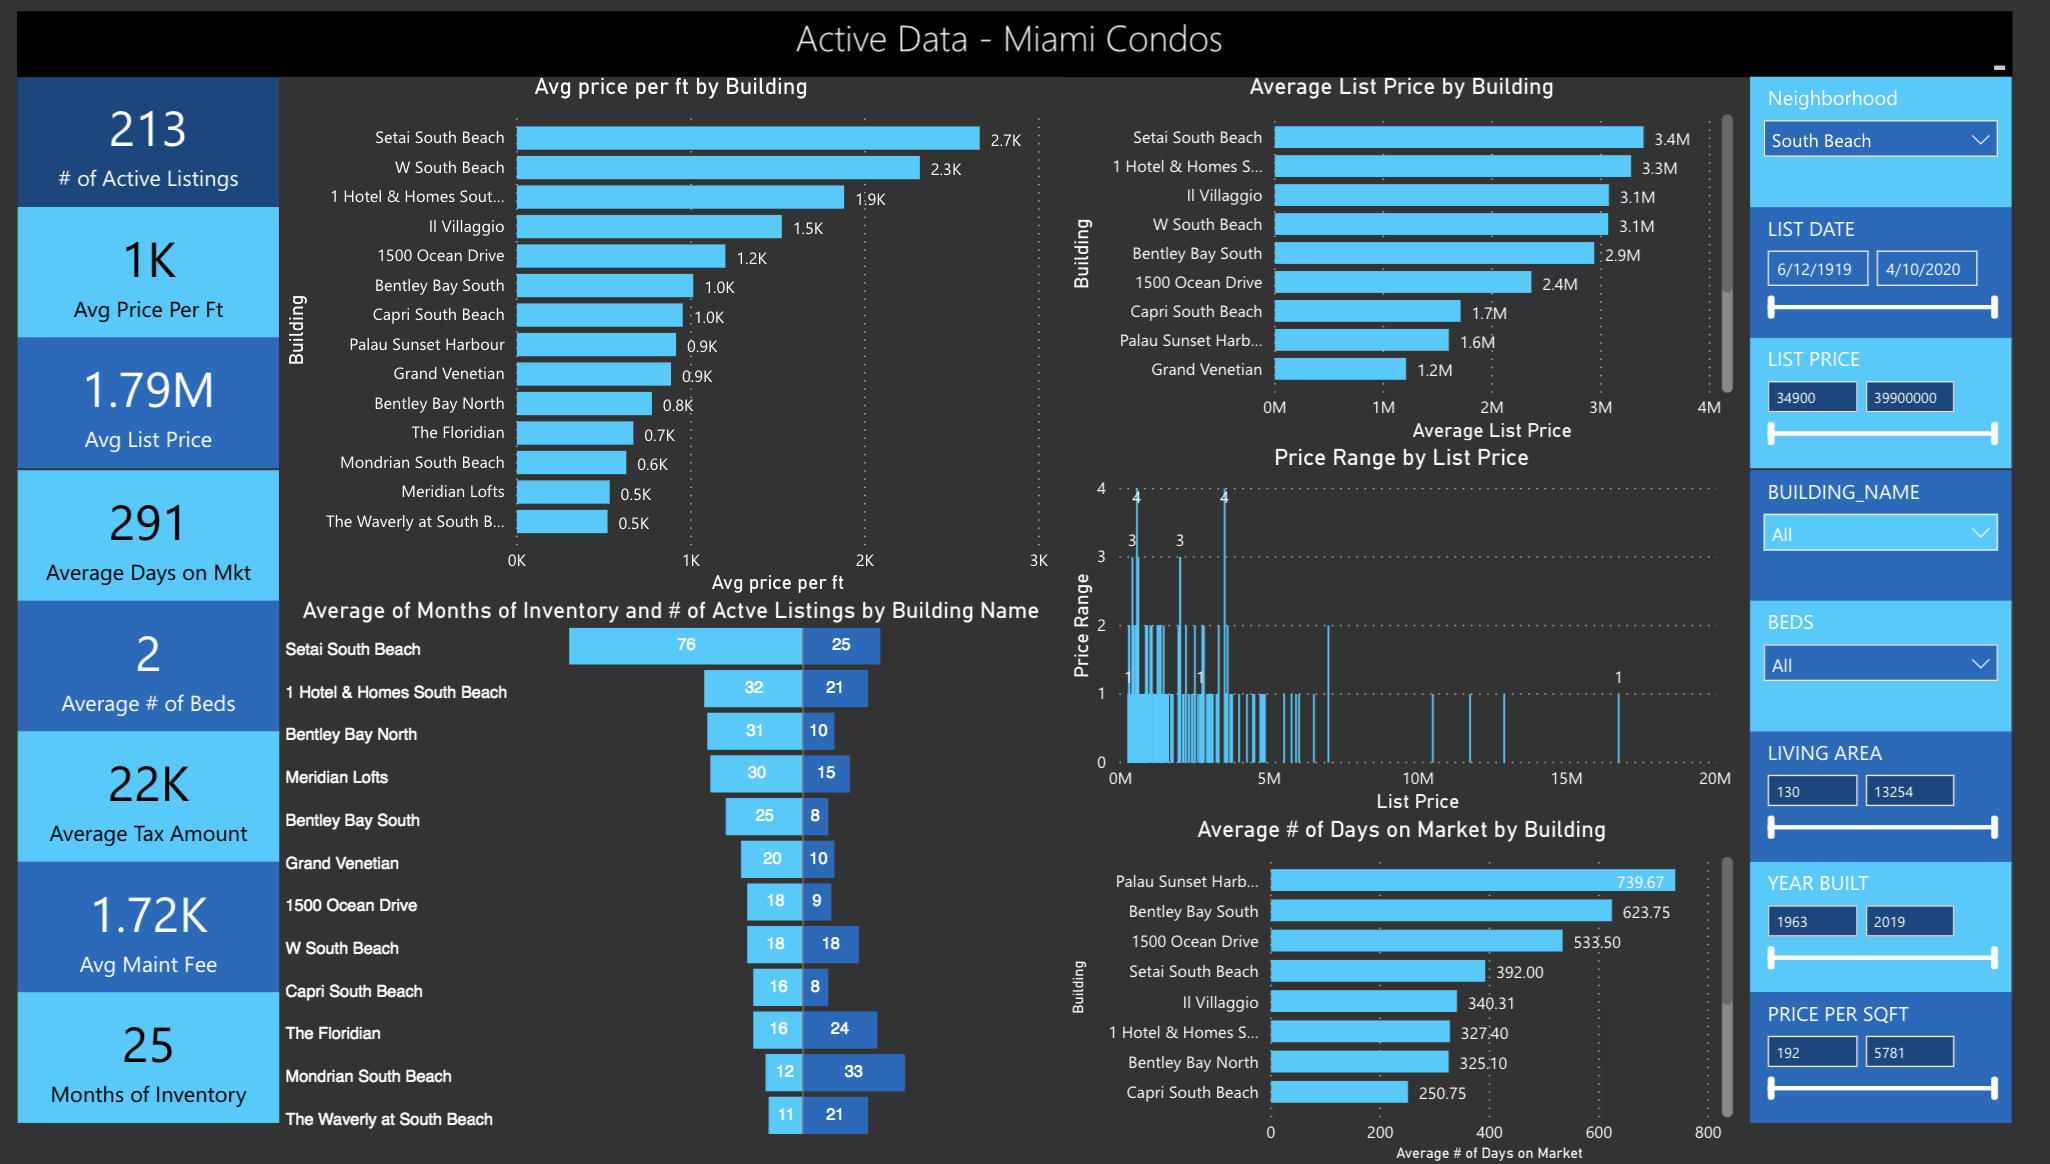
South Beach prices have now dropped so substantially since 2015 that the average price per sqft now matches 2013 sales prices. Velocity of sales in 2020 matches 2019 figures with 12 sales over $1m and 23 sales under $1m. Across all price ranges there is around 24 months of inventory for South Beach. This is simply a sign of a correcting market with soft prices, reduced prices per sqft and a slow absorption rate.
Where and what are the best opportunities and options? The Mondrian and the Waverly lead the pack with the most sales in Q1. 1 Hotel and Homes and the W are the two most expensive condos and Capri offers the best value. Please call me for more info.
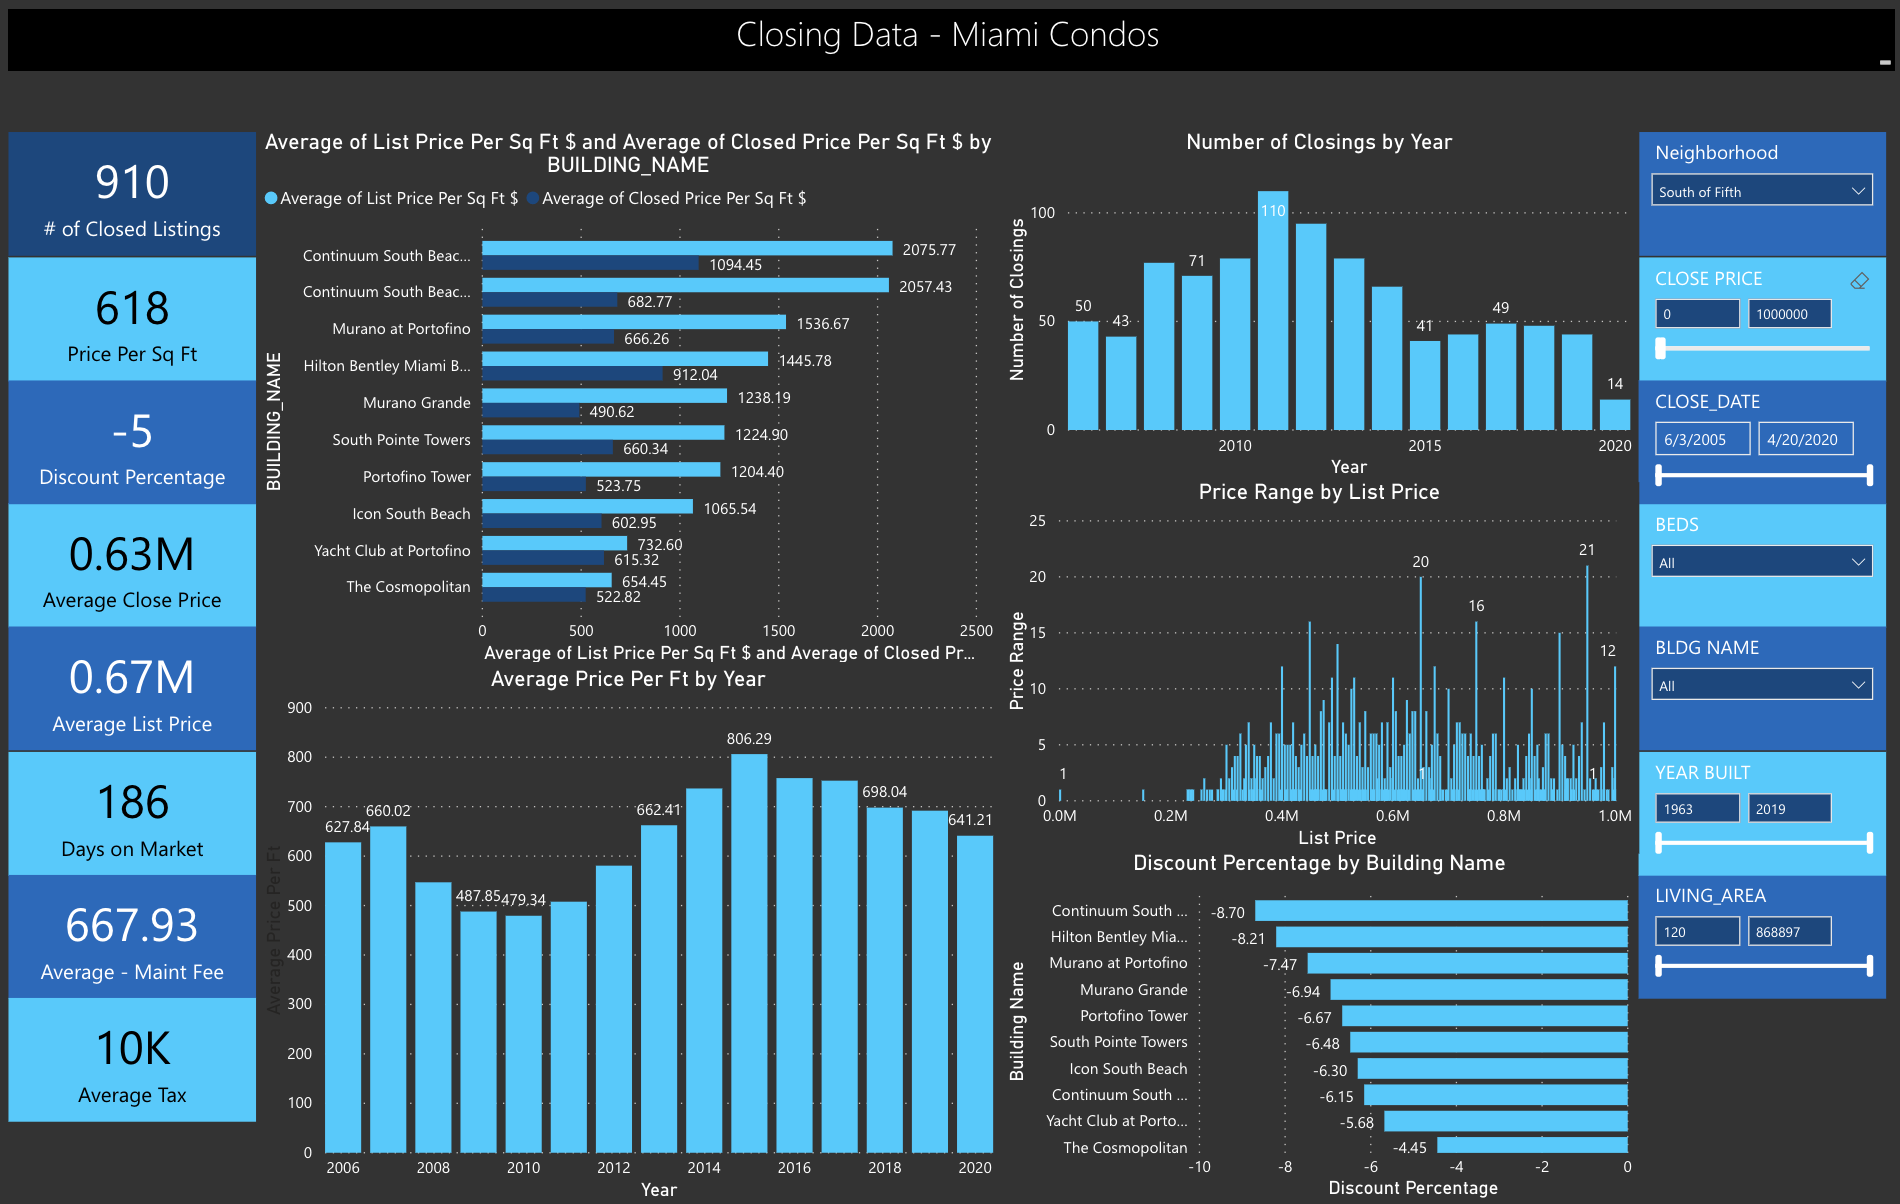
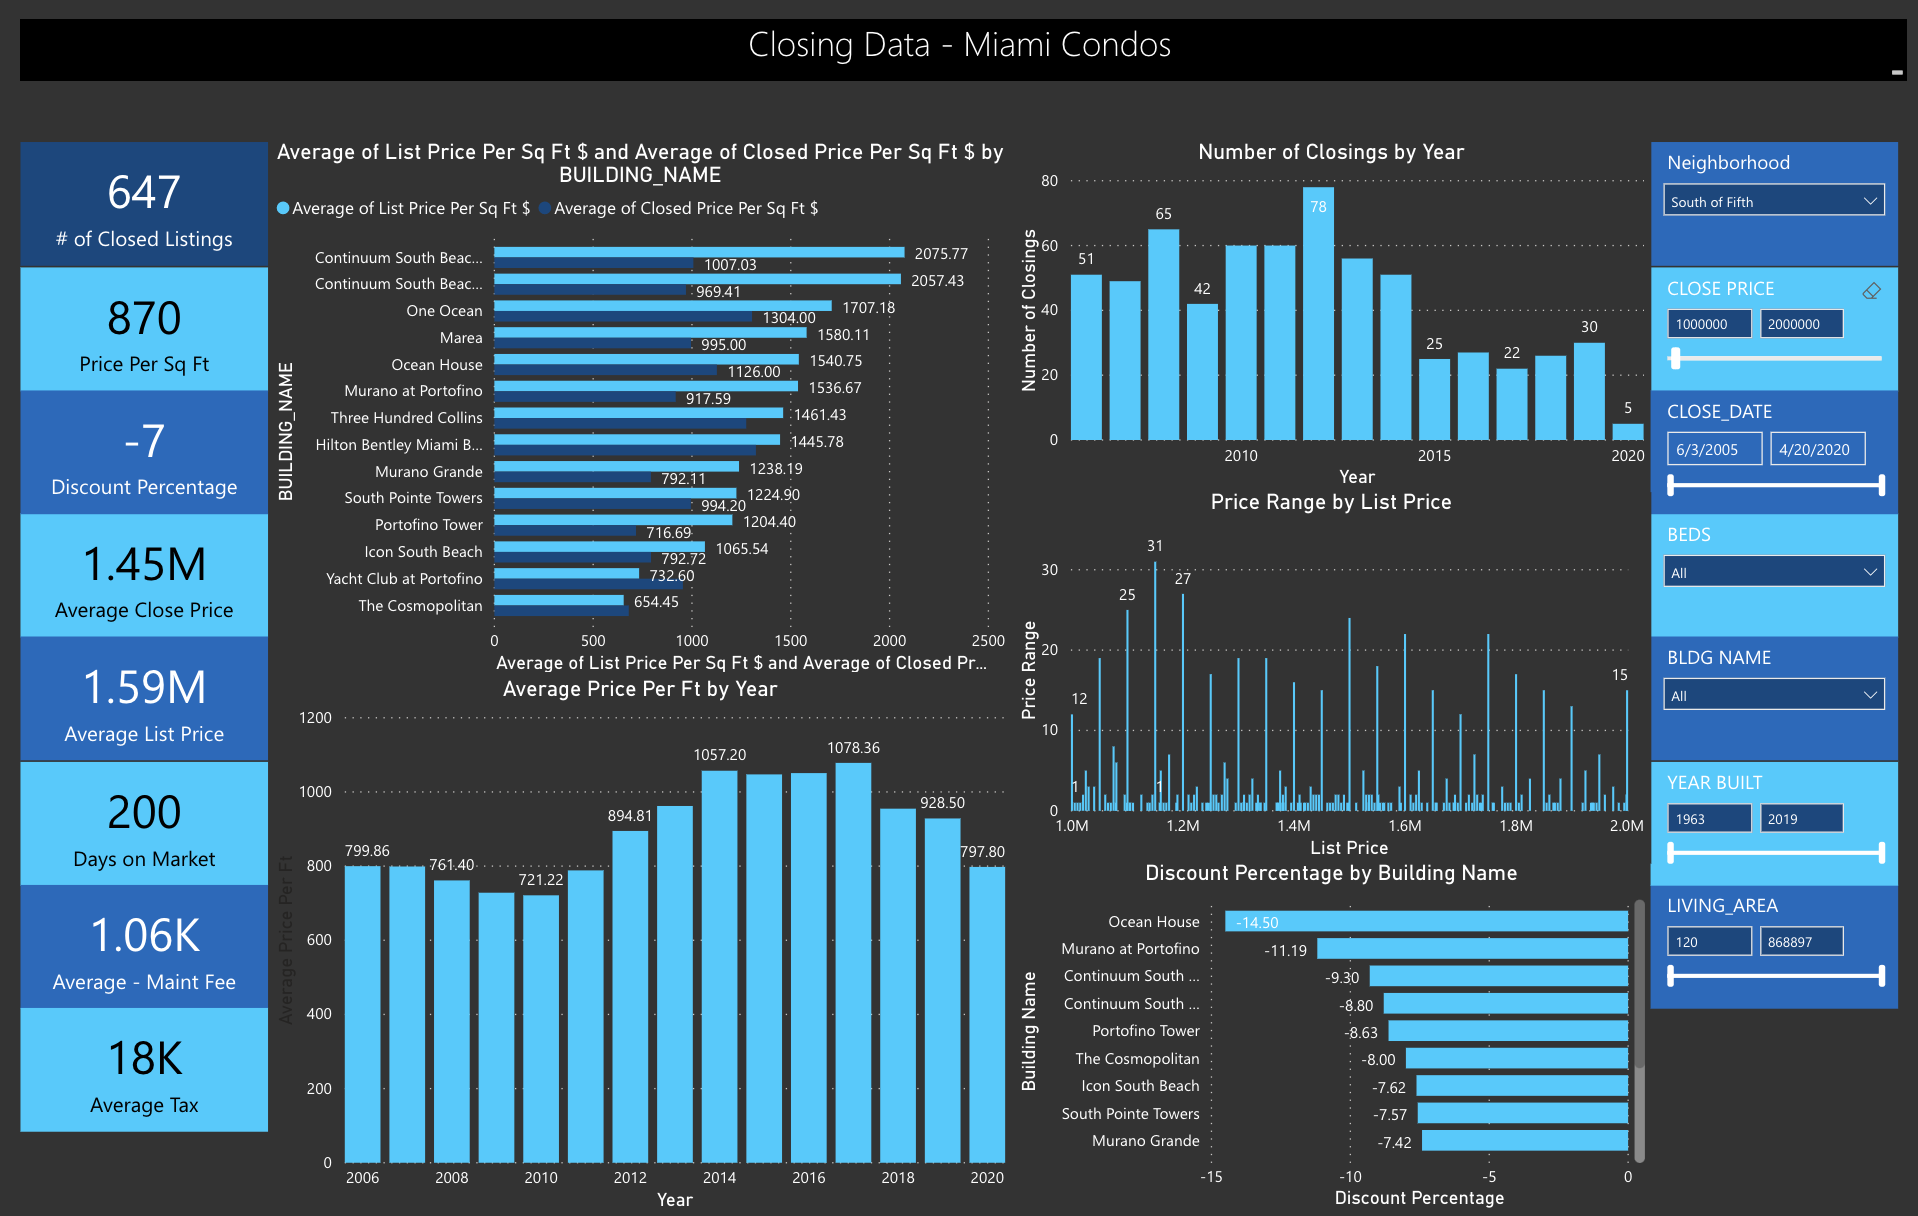
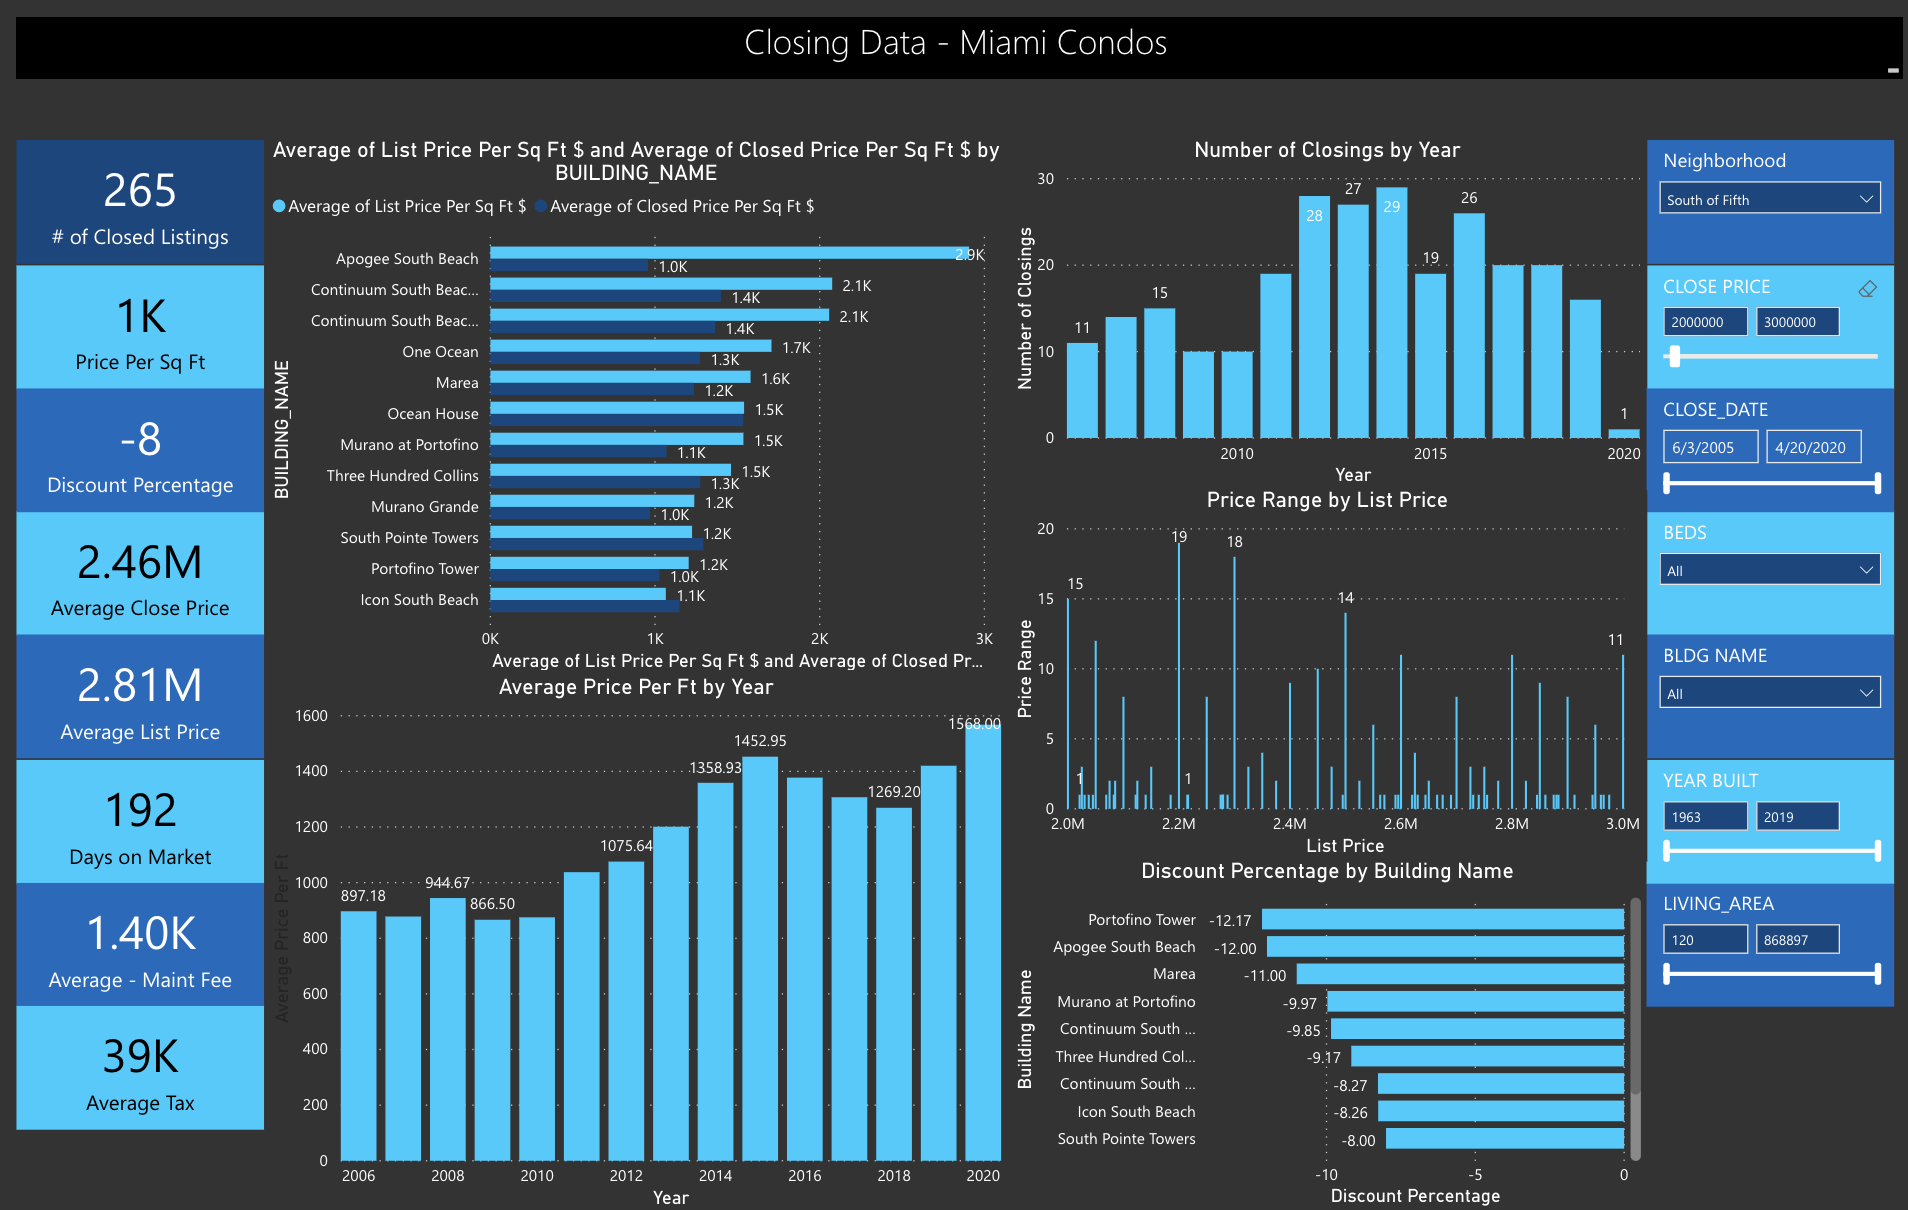
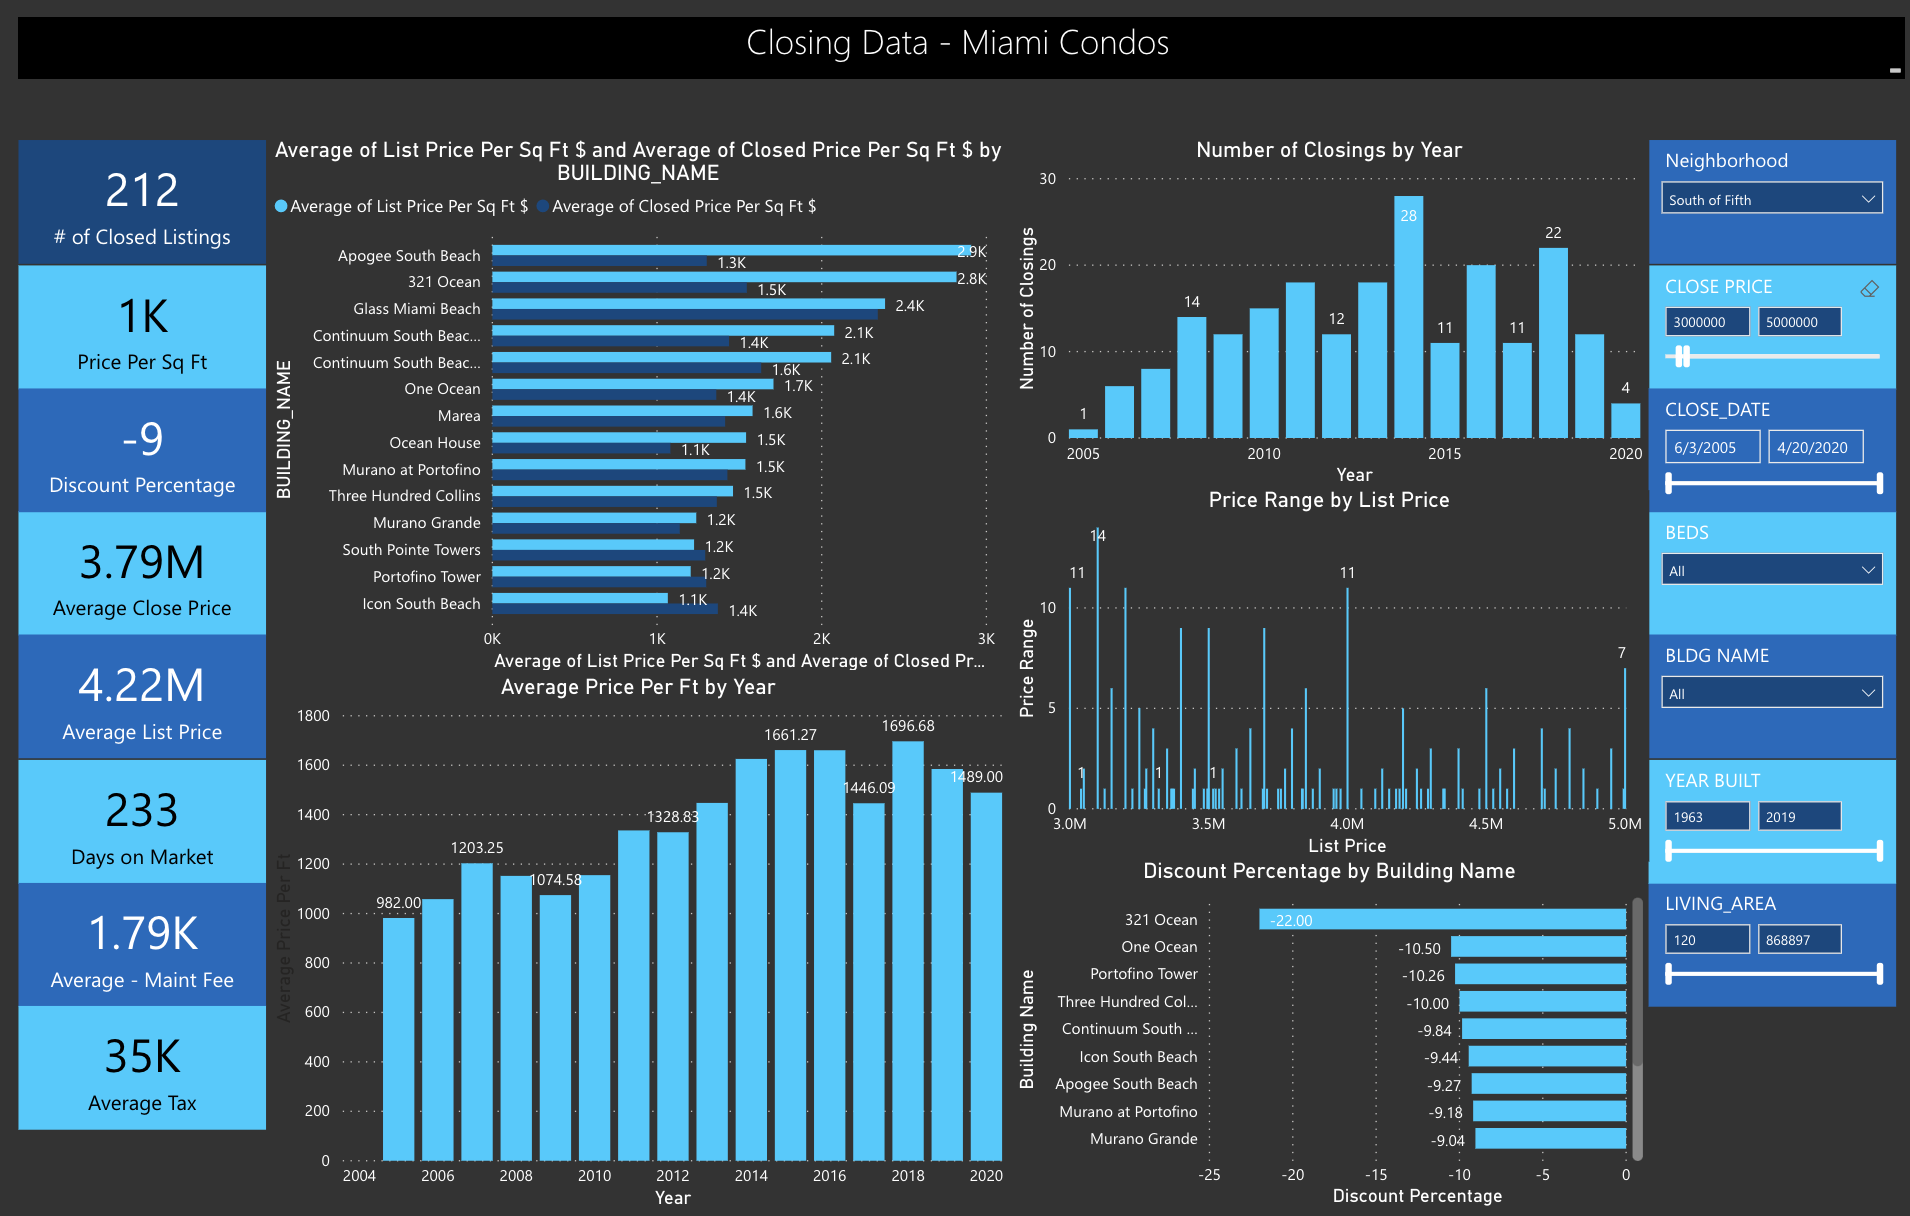
South of Fifth Condos Q1 2020
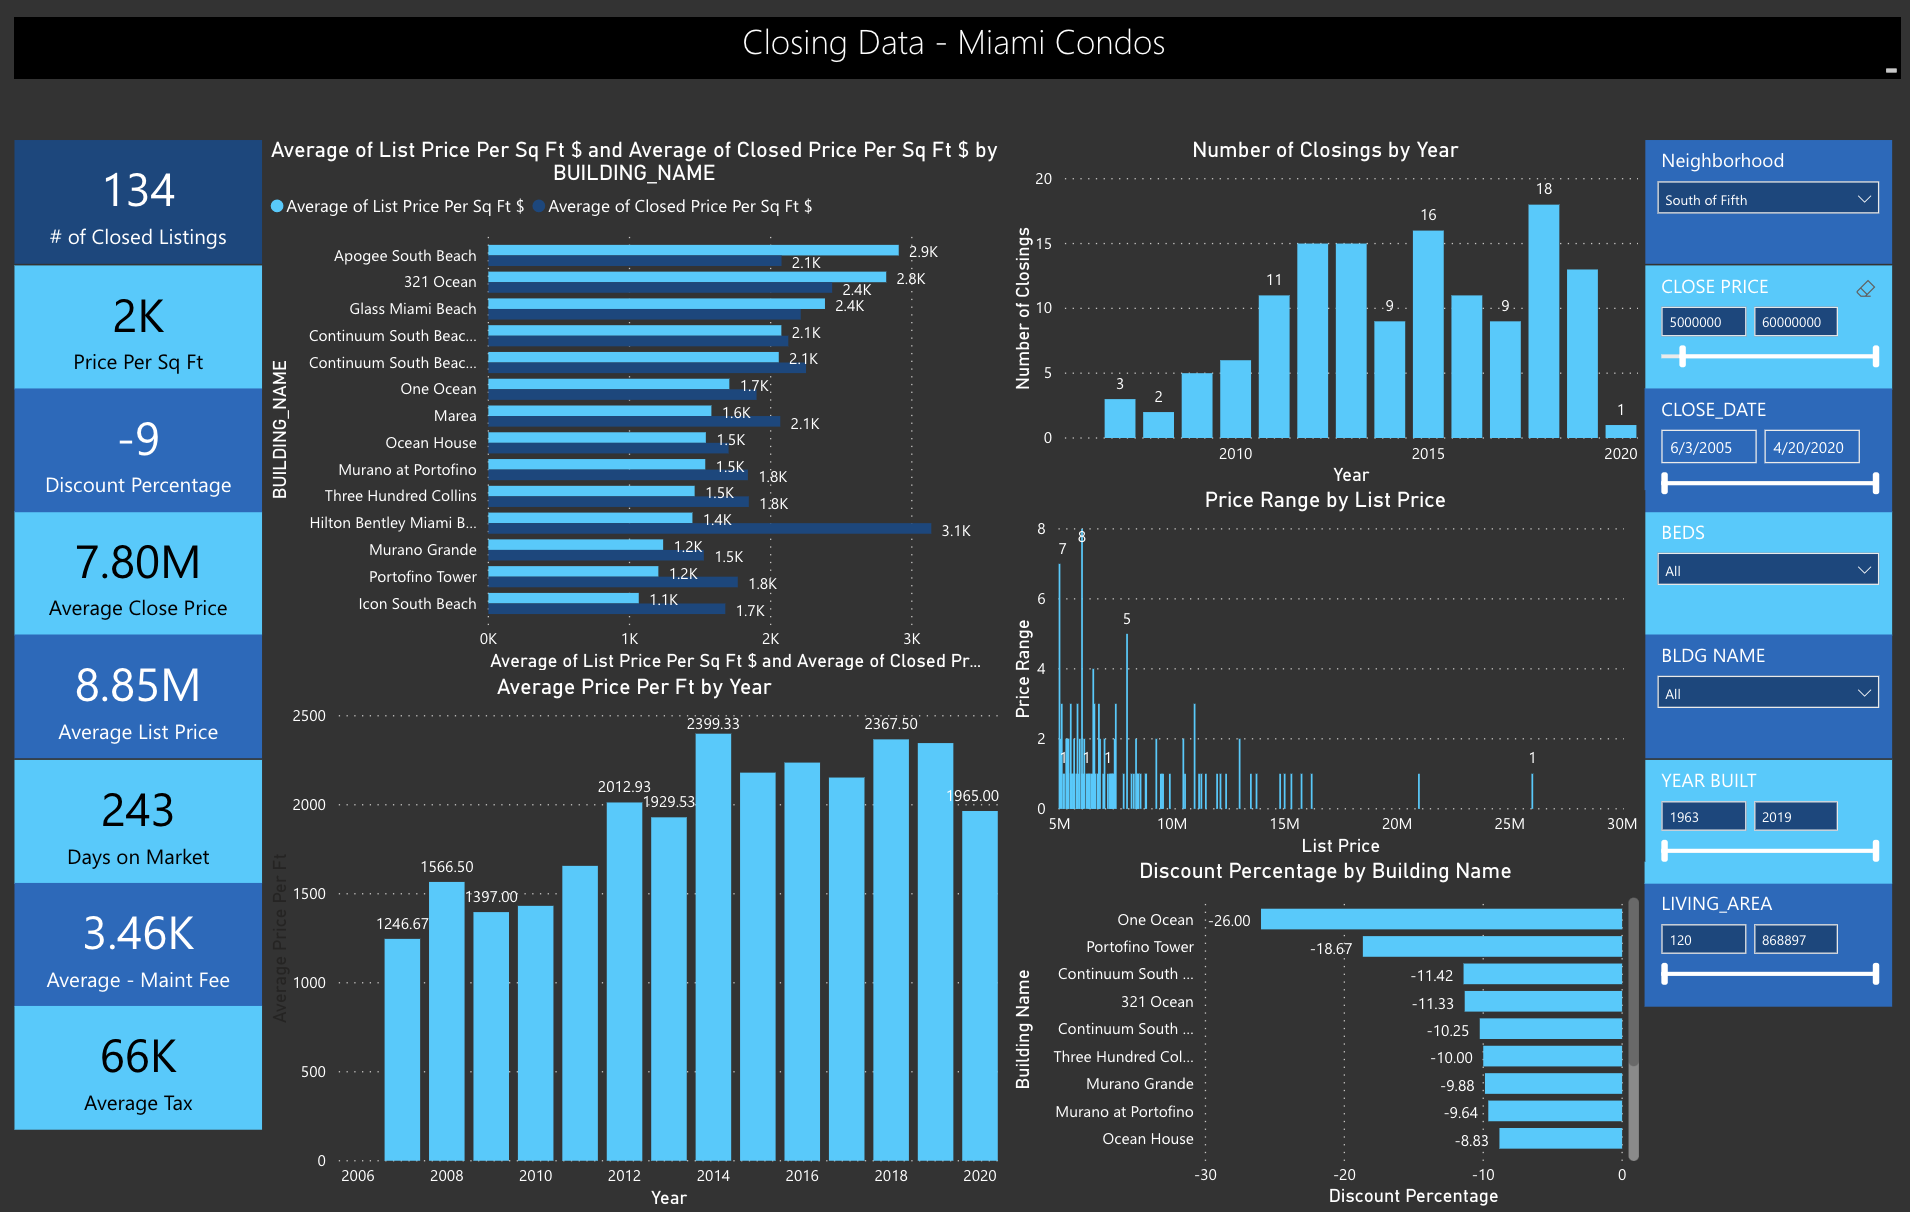
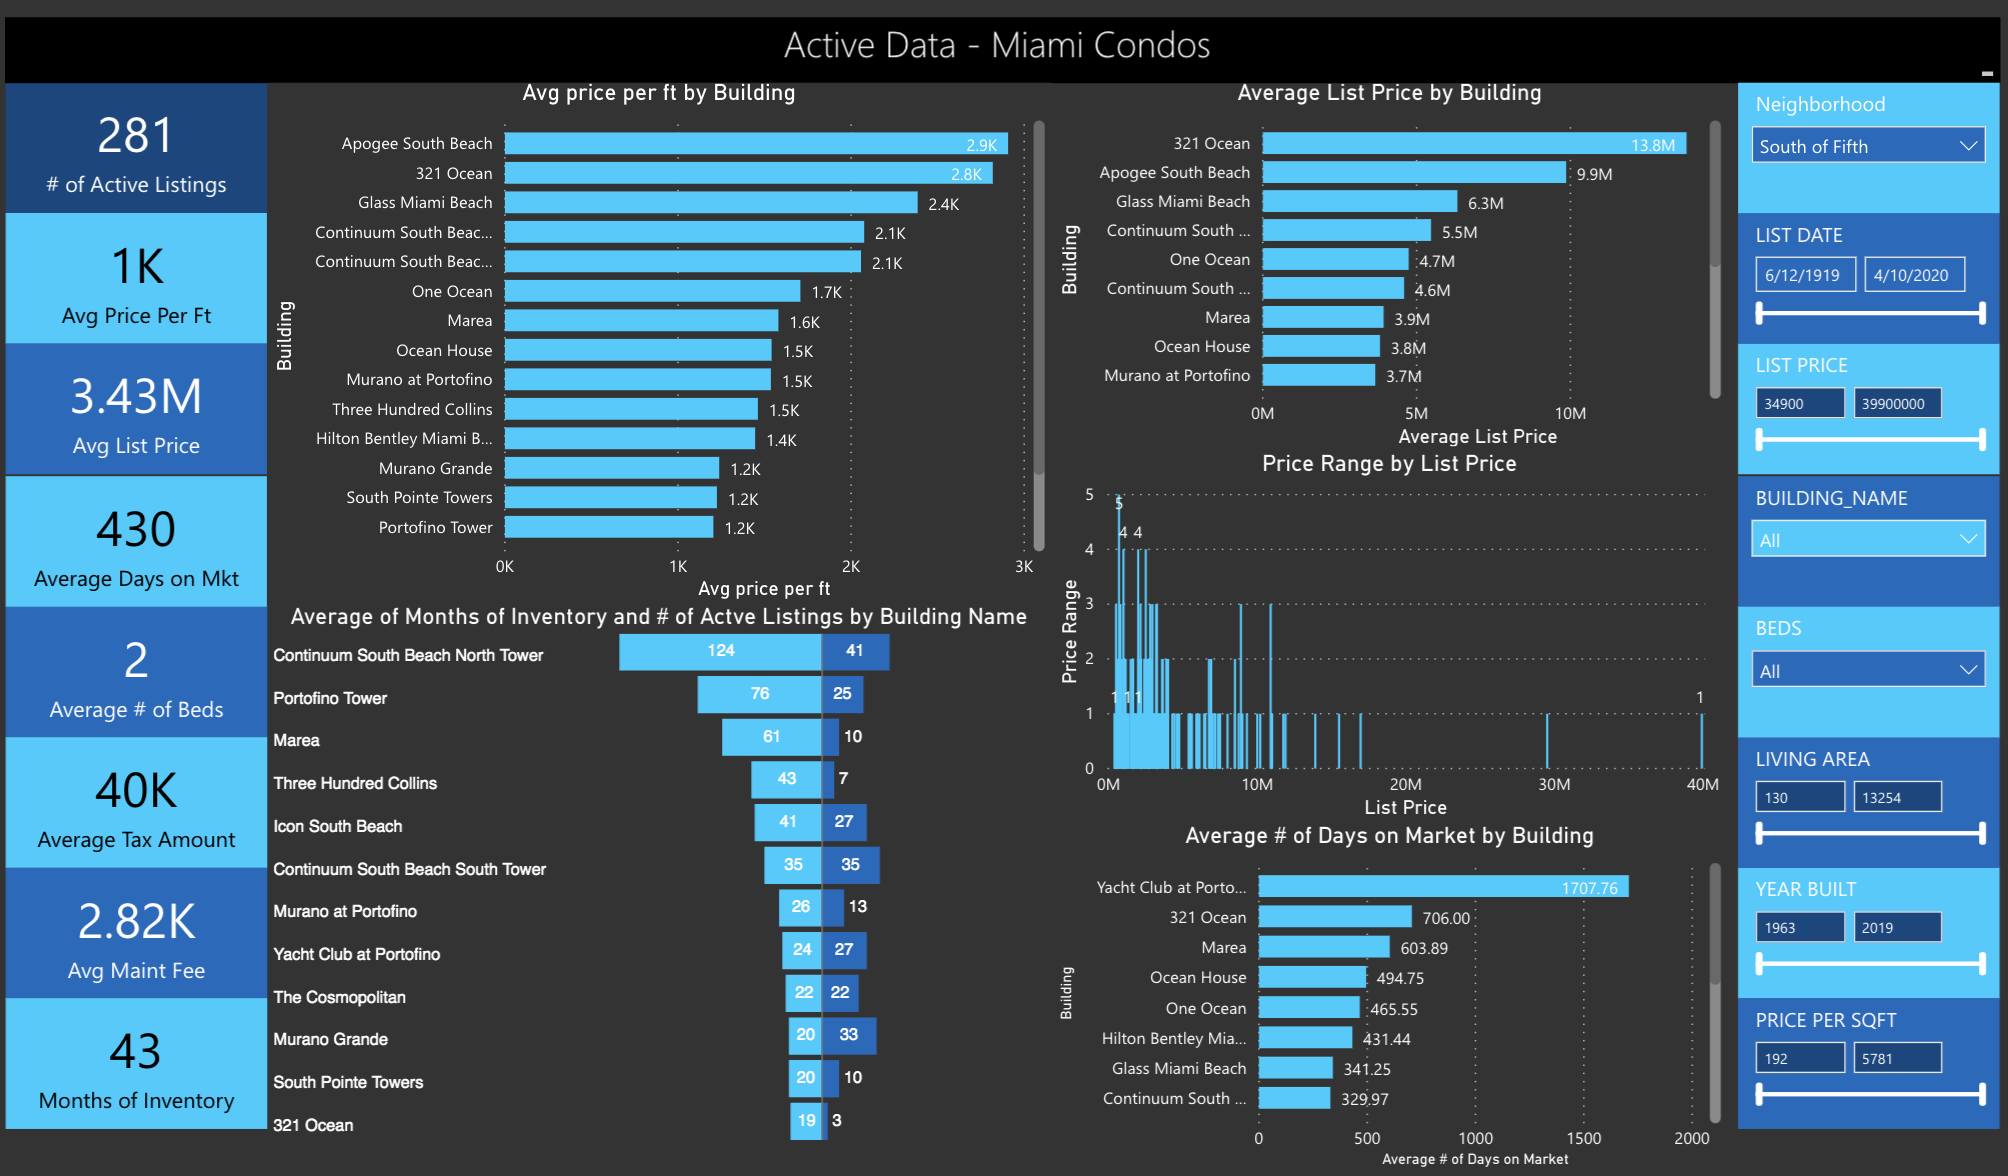
The second most expensive condo market in Miami (after Surfside). This market currently holds 43 months of inventory (across the board), with an average of 300 days on the market. However, if you drill down into the price points, you see that the higher the price point, the longer it sits on the market. For example the market over $5m sees 52 months of inventory and properties sit on average 346 days on the market.
Half of the units in South of Fifth are over $2.5m. We are currently running close to the same prices we saw in 2013, which is a familiar story to other neighborhoods. Now in 2020 we are seeing true value and for the first time many units are touching the bottom or close to the bottom of the market.
Continuum remains a top choice for South of Fifth buyers. See part 3 of the report, which discusses the best condos in Miami and where you will find 4 of Miami’s most expensive condos are all in South of Fifth: Apogee, Continuum, 321 Ocean and Glass. Regardless ALL of these condos are trading at 2013 prices or less.
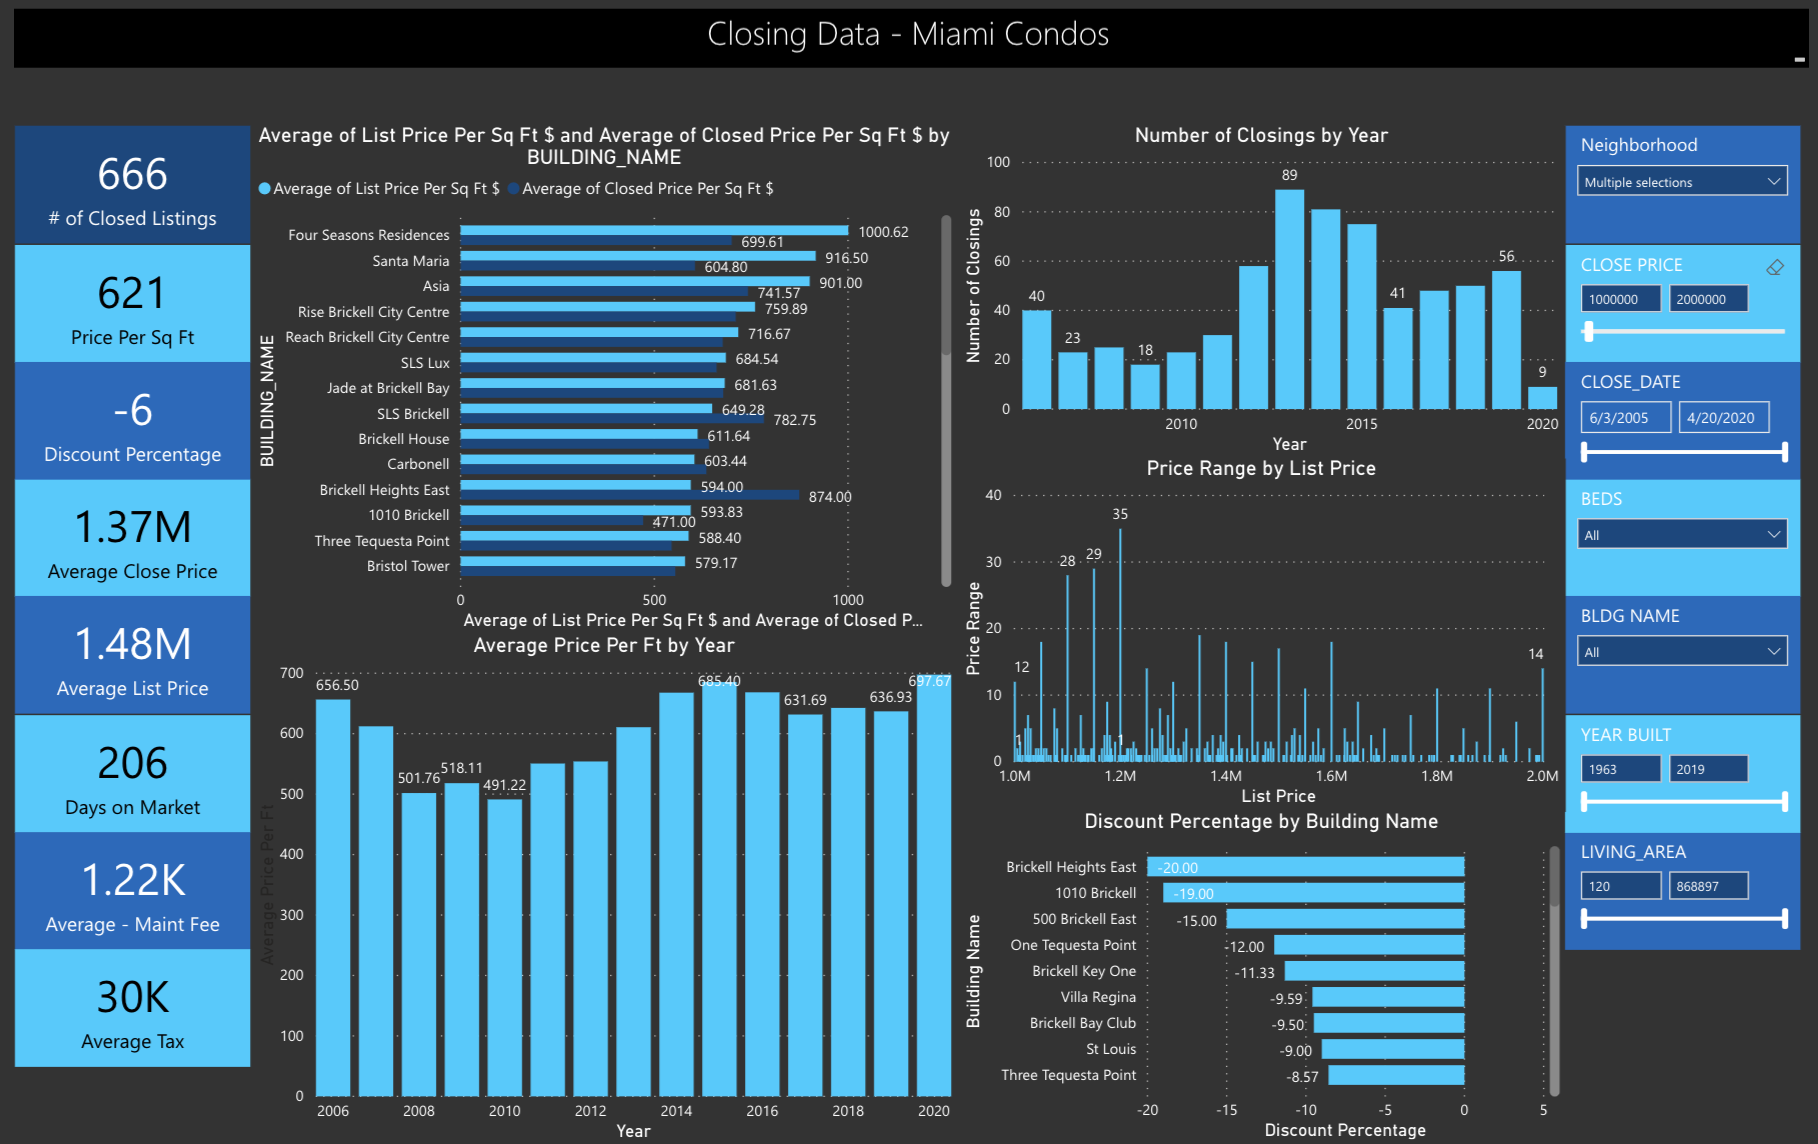
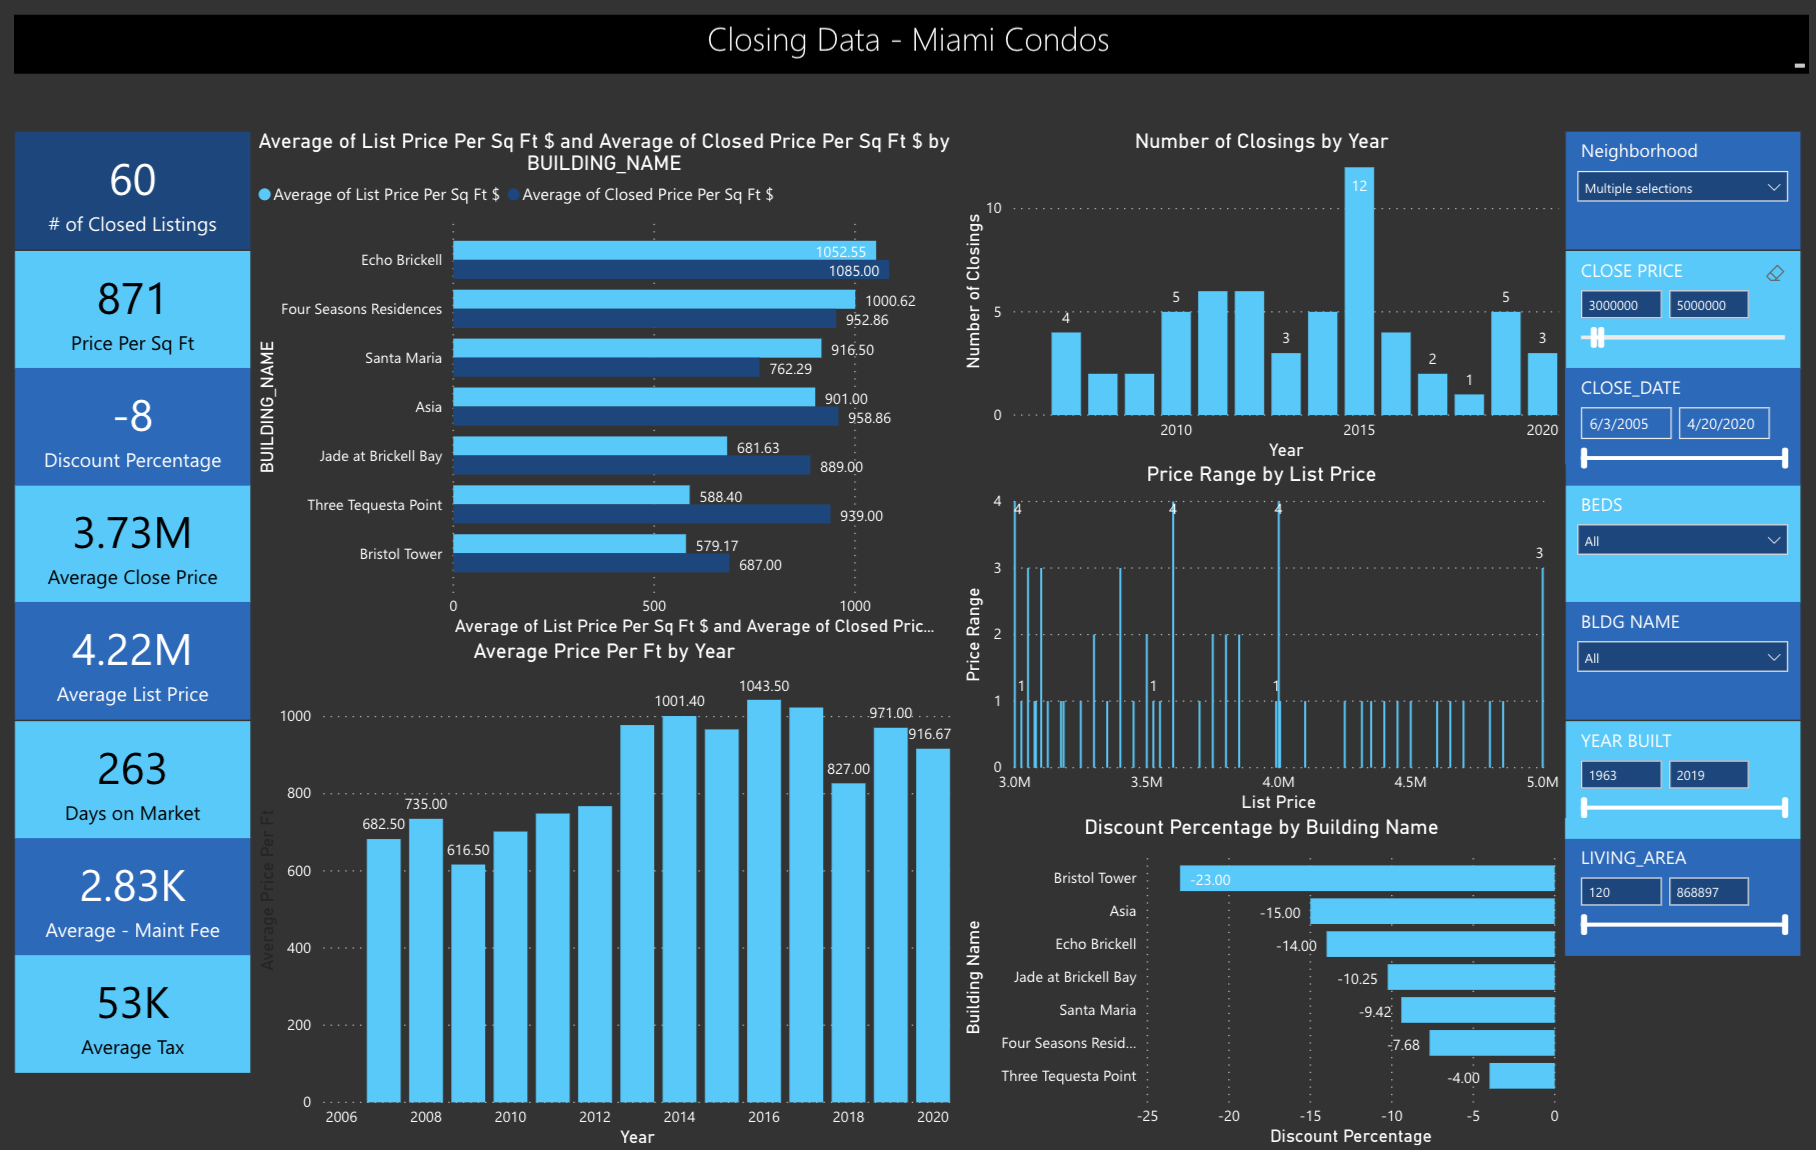
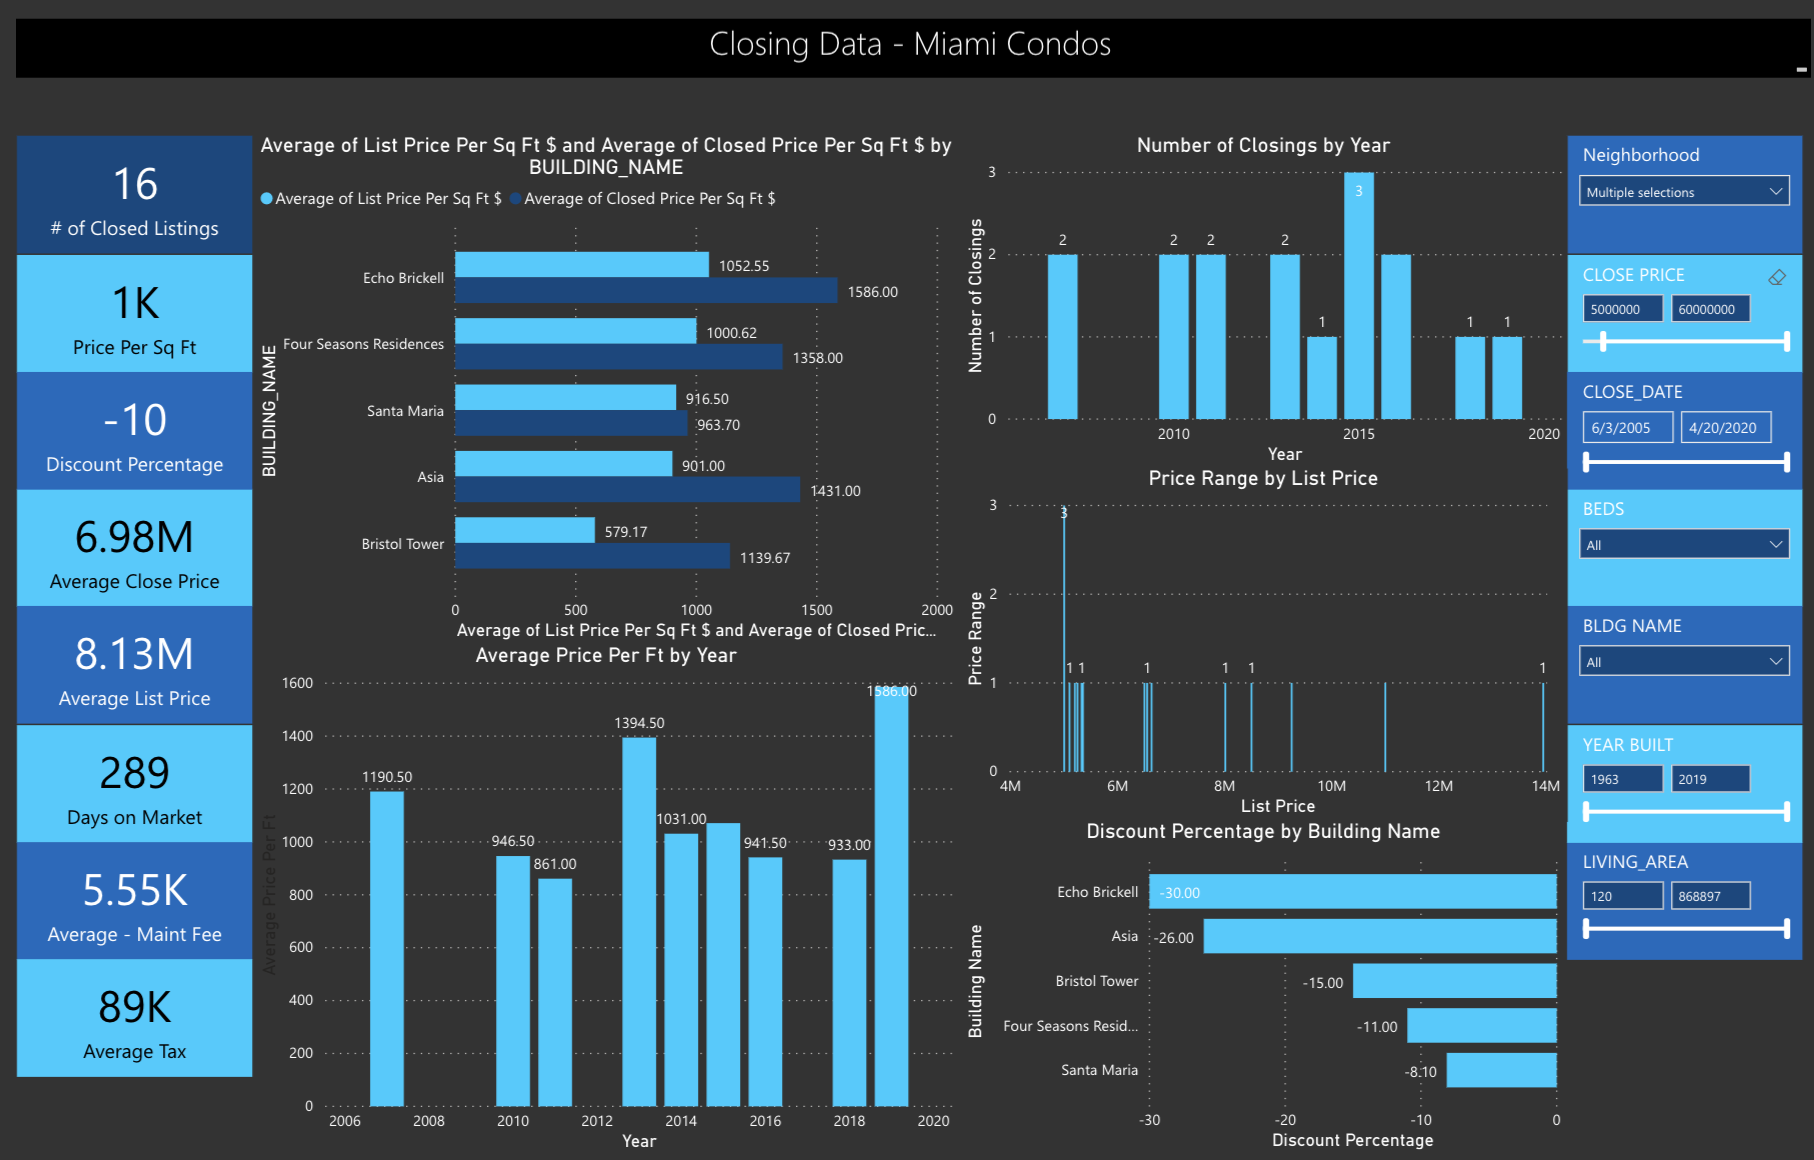
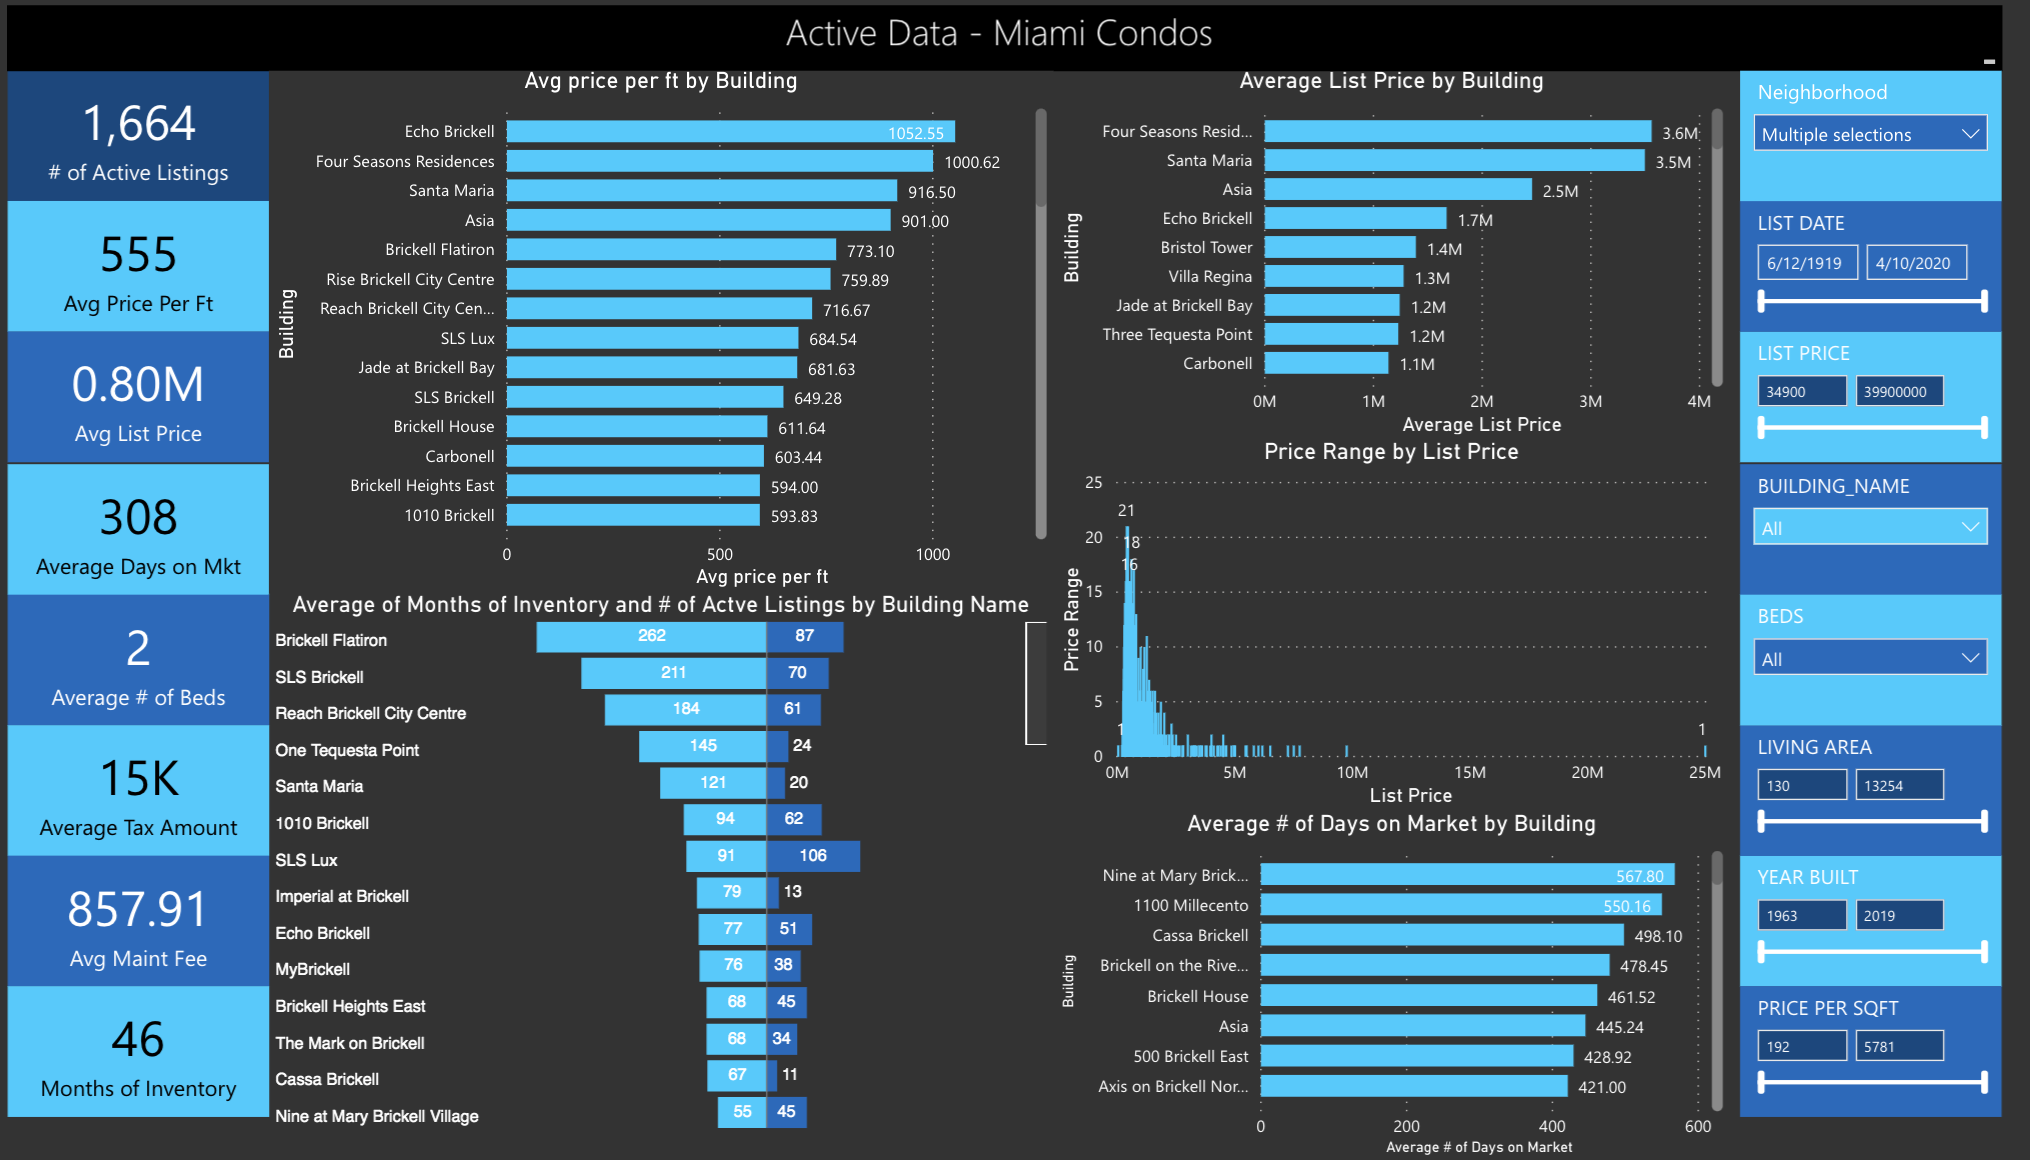
Brickell Condos Q1 2020
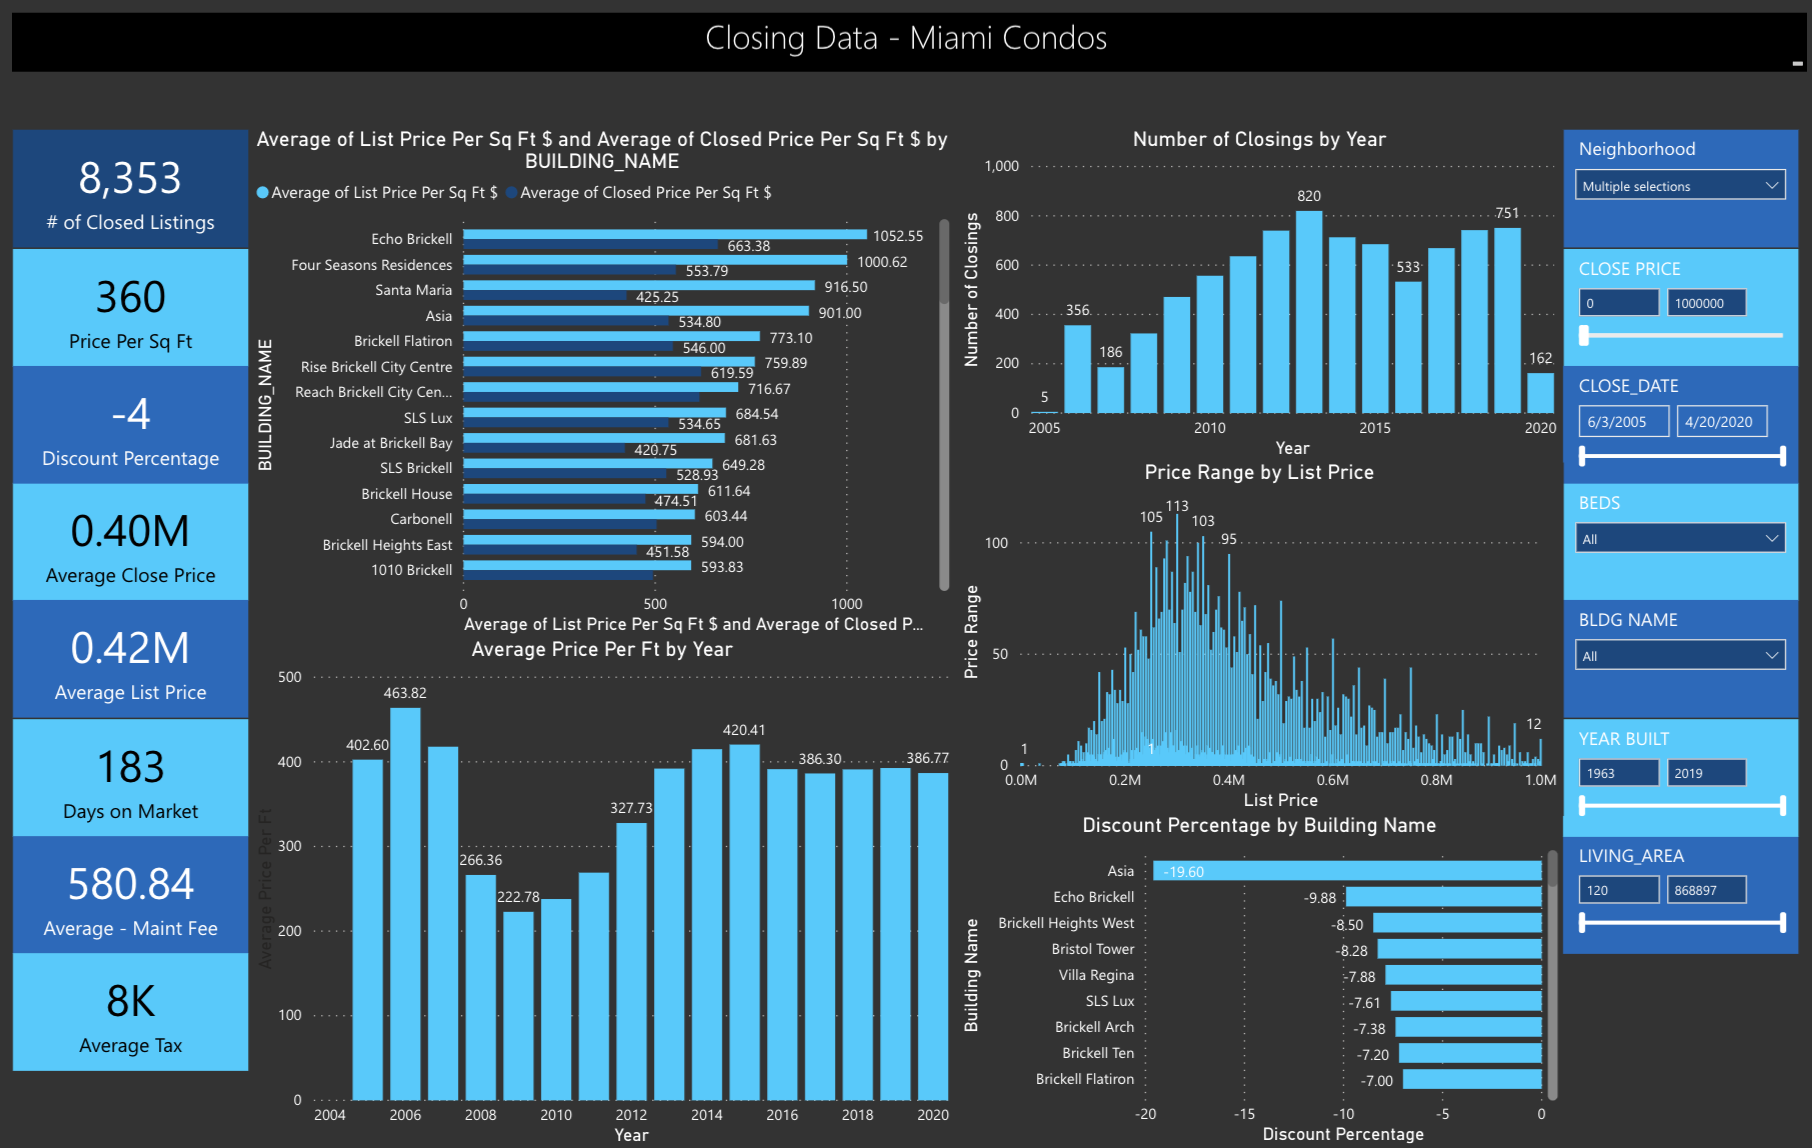
In Q1 2020 Brickell seemed to be on track to replicate its 2019 performance averaging $415 per sqft in sales. However, the specific price bracket of $1m – $2m was actually doing significantly BETTER than last year with an average price per sqft jump from $636 to $697. Nine sales were recorded. The average sales price in Q1 was $550,000 with an average list price of $590,000. This is marginally better than its 2019 performance. These are the 5 buildings holding the most inventory right now: SLS, Flatiron, SLS Lux, 1010 Brickell and Reach. The most expensive buildings: Santa Maria, Four Seasons and Echo.
Concerns for Brickell moving into Q2? Brickell is home to a lot of rentals and concerns may exist for tenants becoming unable to pay their rent. This is a concern for sellers and buyers of lower-end units ($300k – $700k). Generally speaking, Brickell remains a weak market.
Downtown Condos Q1 2020
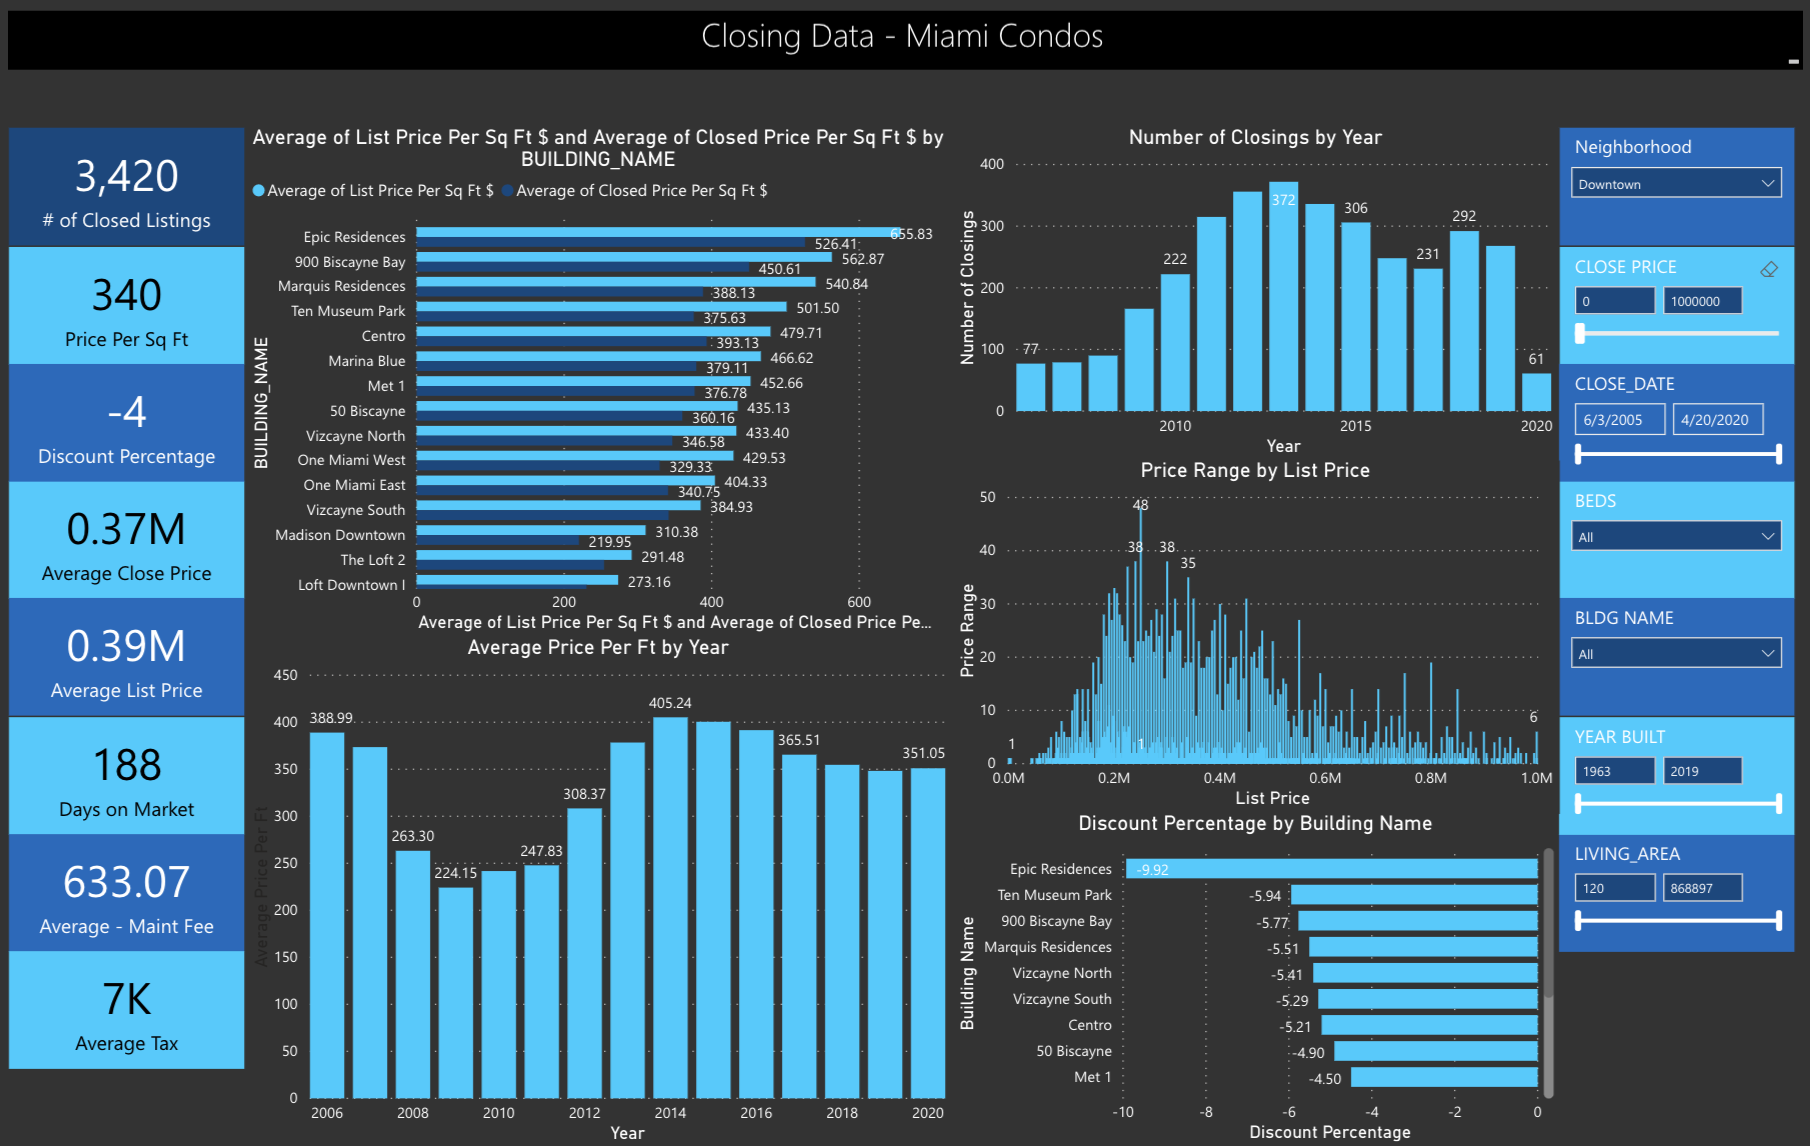
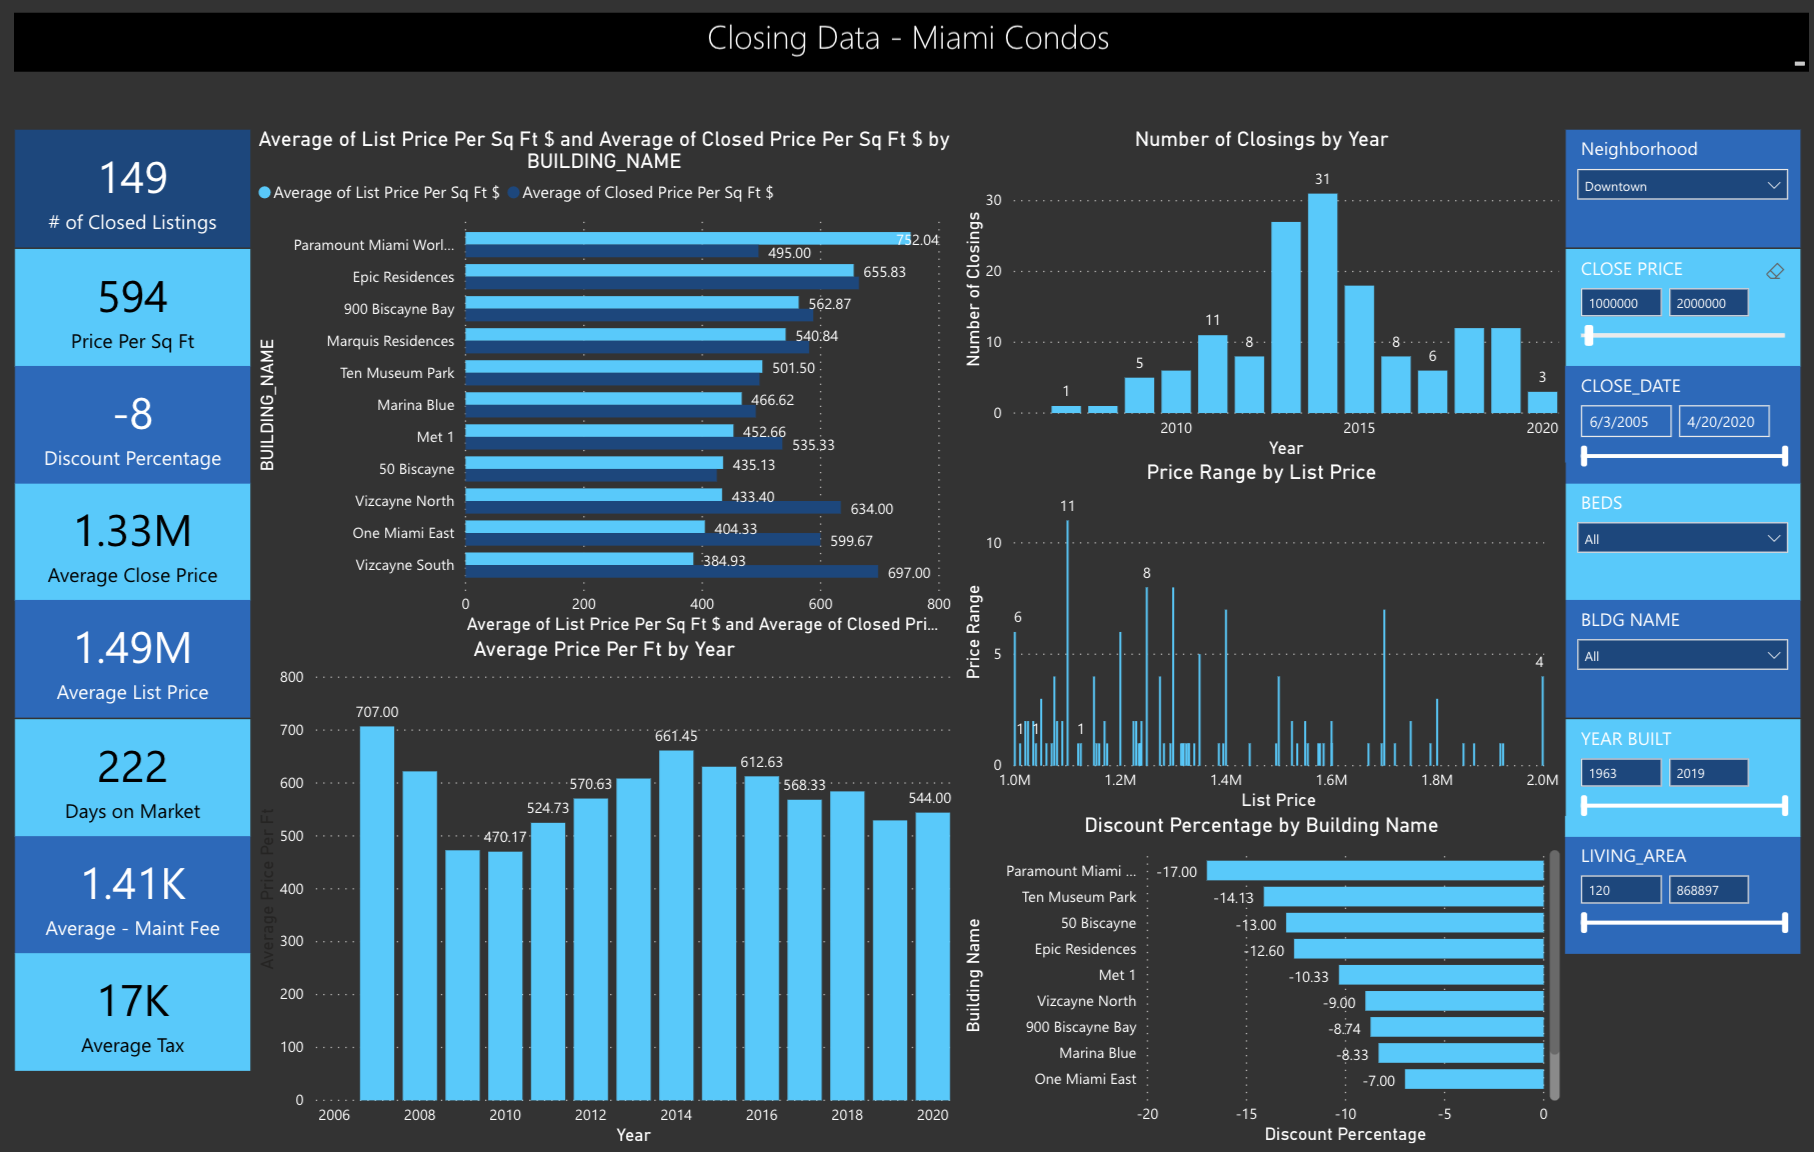
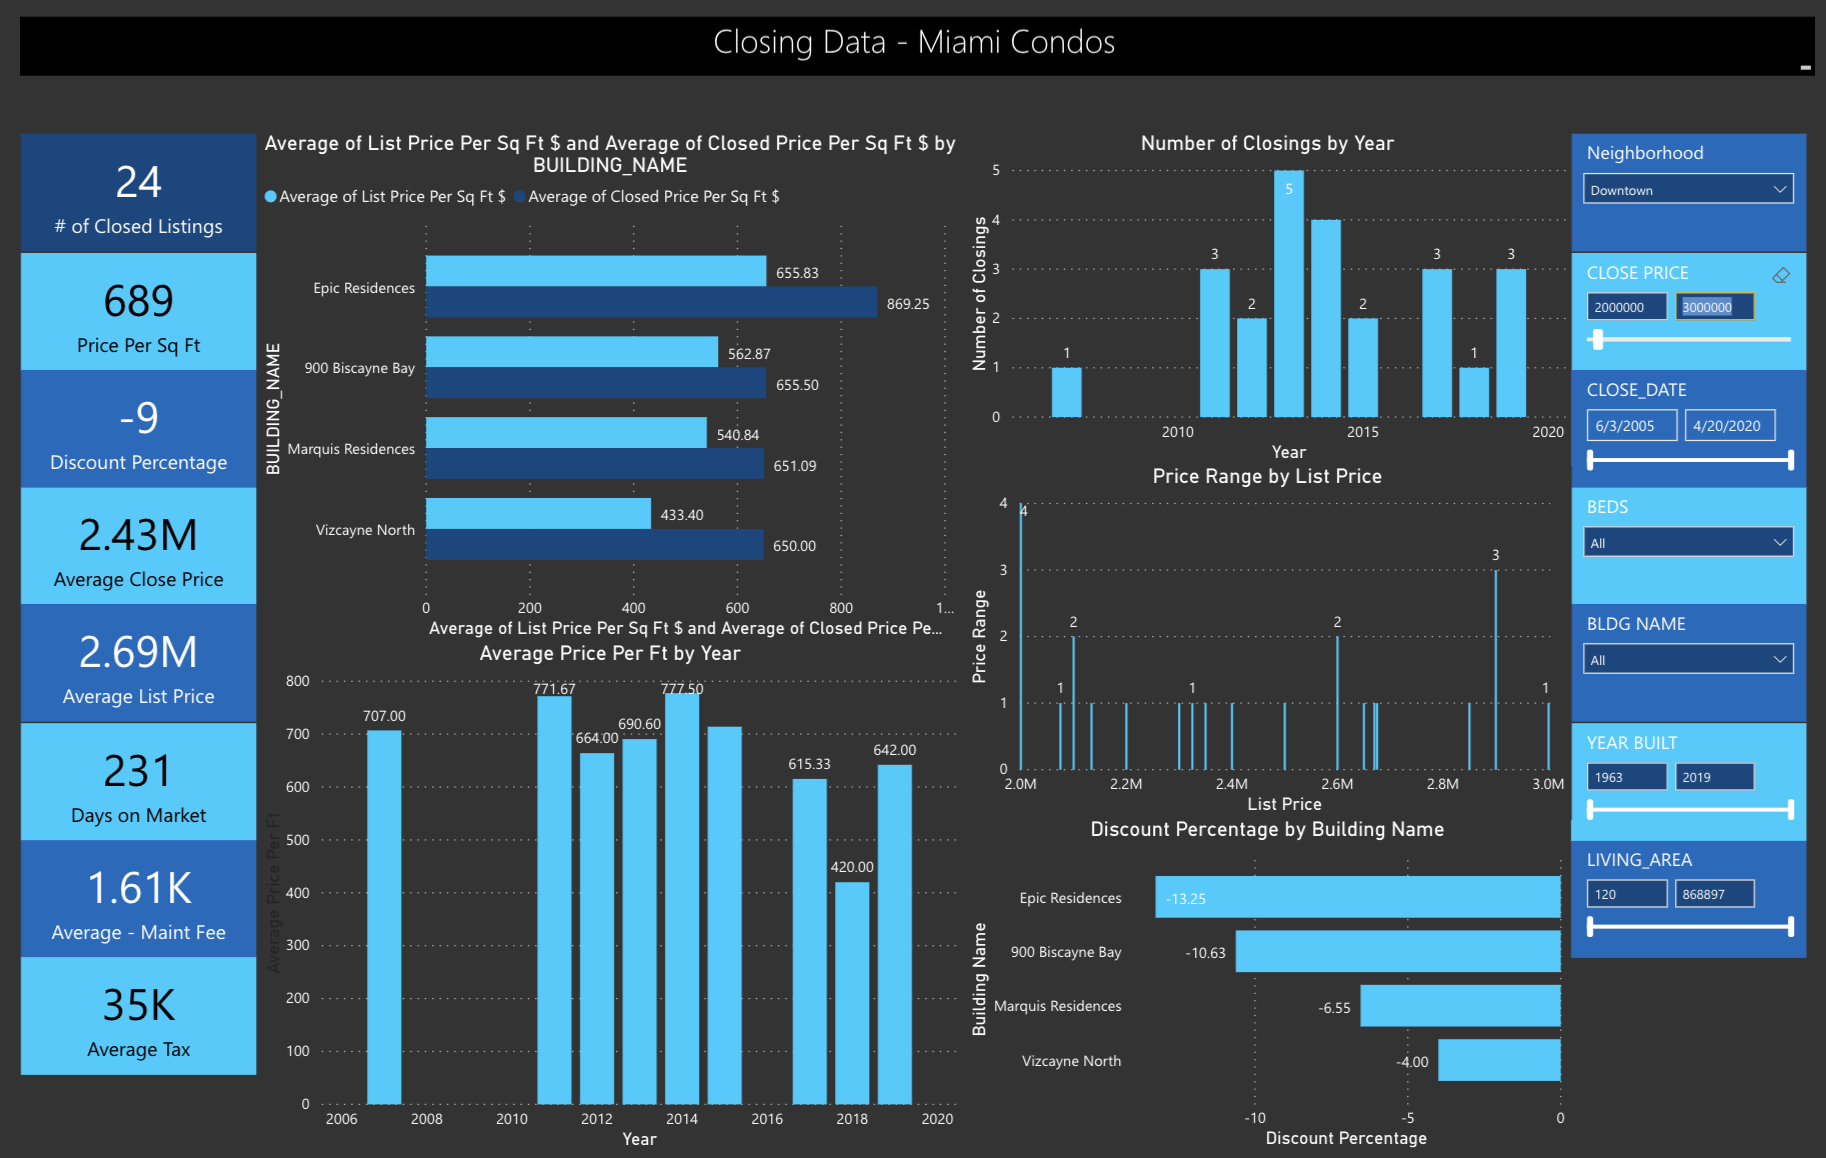
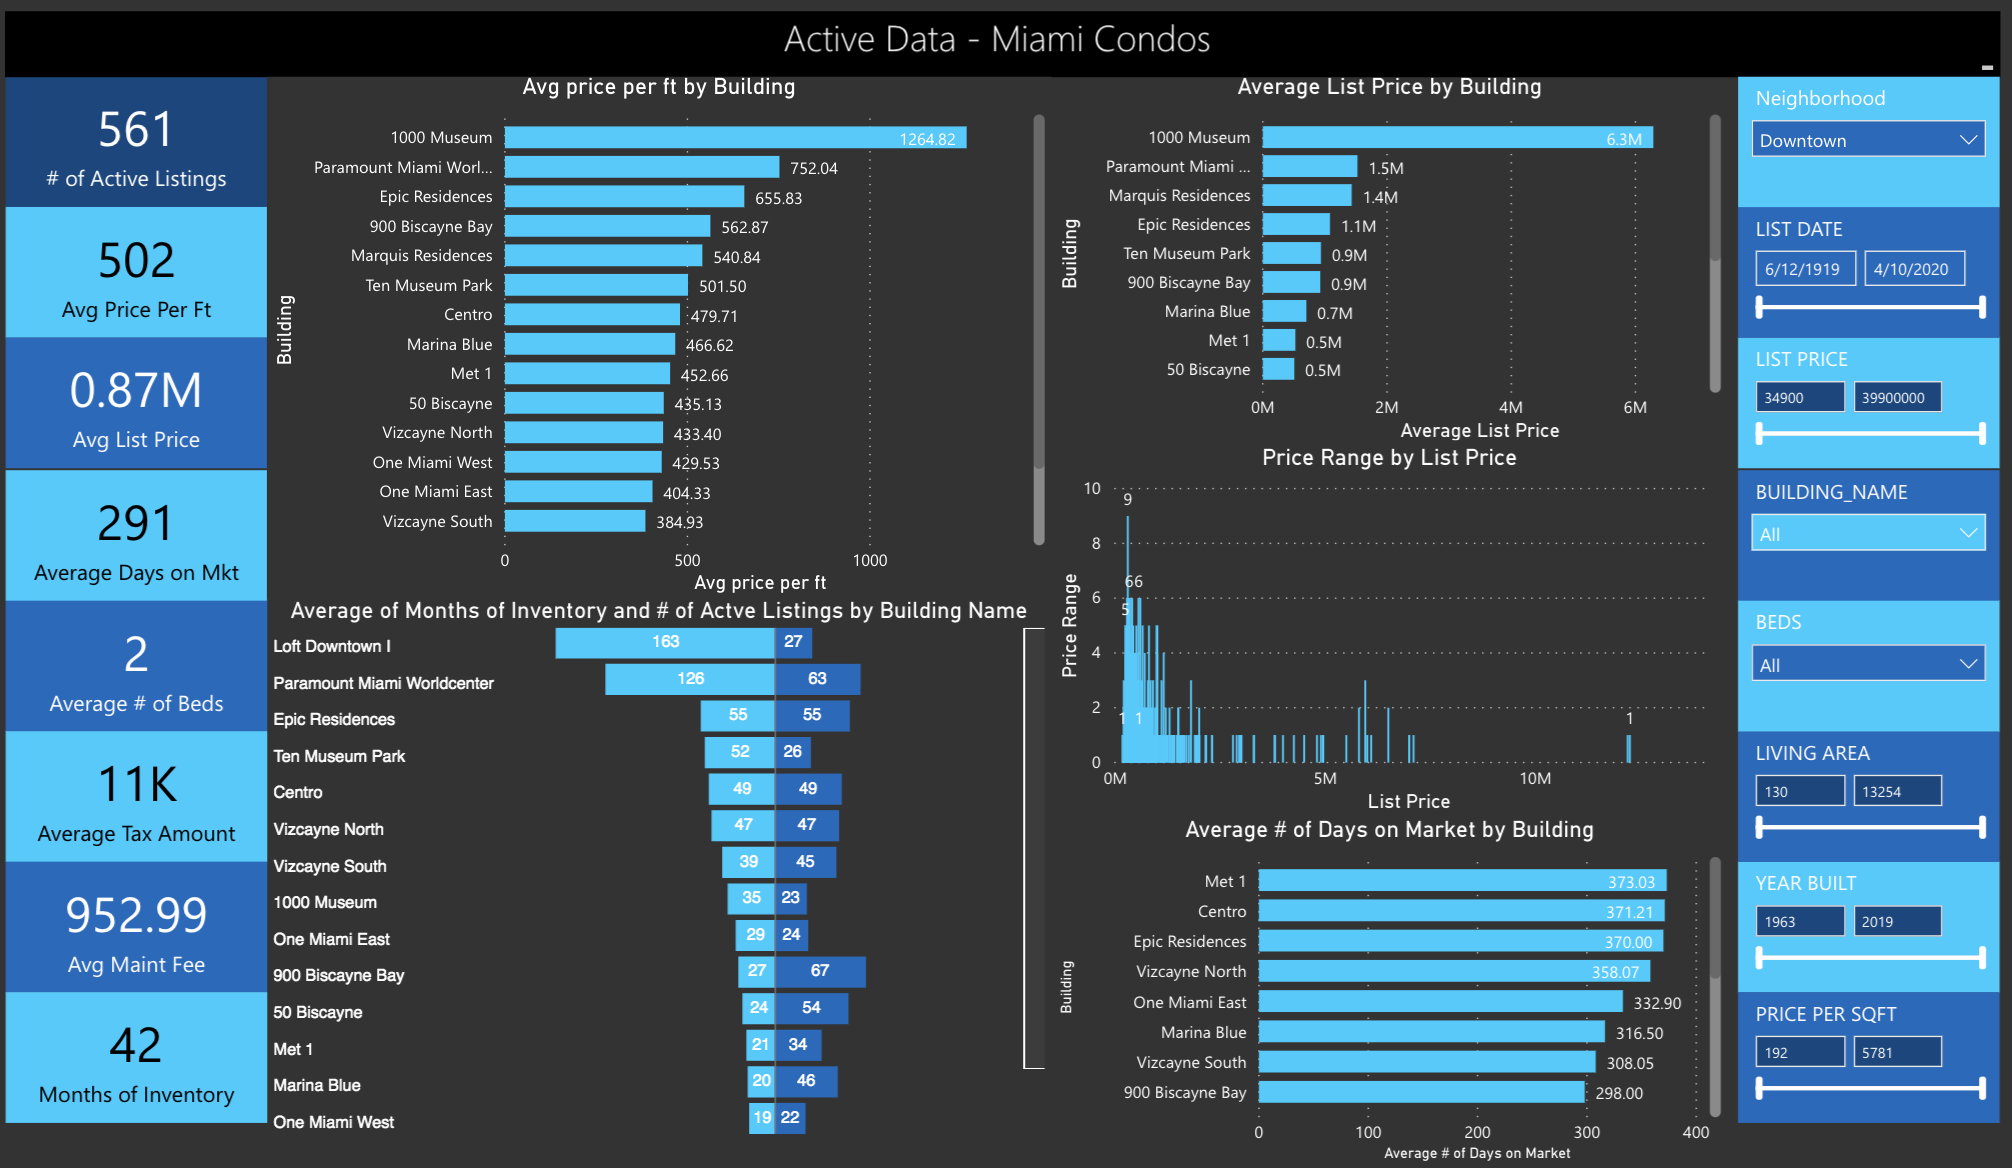
One Thousand Museum and Epic are clearly the top two most expensive condos in downtown. One Thousand Museum sits very much apart from the crowd. The introduction of Aston Martin Residences ready in 2021 will provide much needed elevation of luxury product in this market. Downtown tracks closely alongside Brickell and Edgewater and is all part of the same condo eco-system we call the ‘Urban Core’. How did every Miami Neighborhood Perform in Q1 2020?
Edgewater Condos Q1 2020
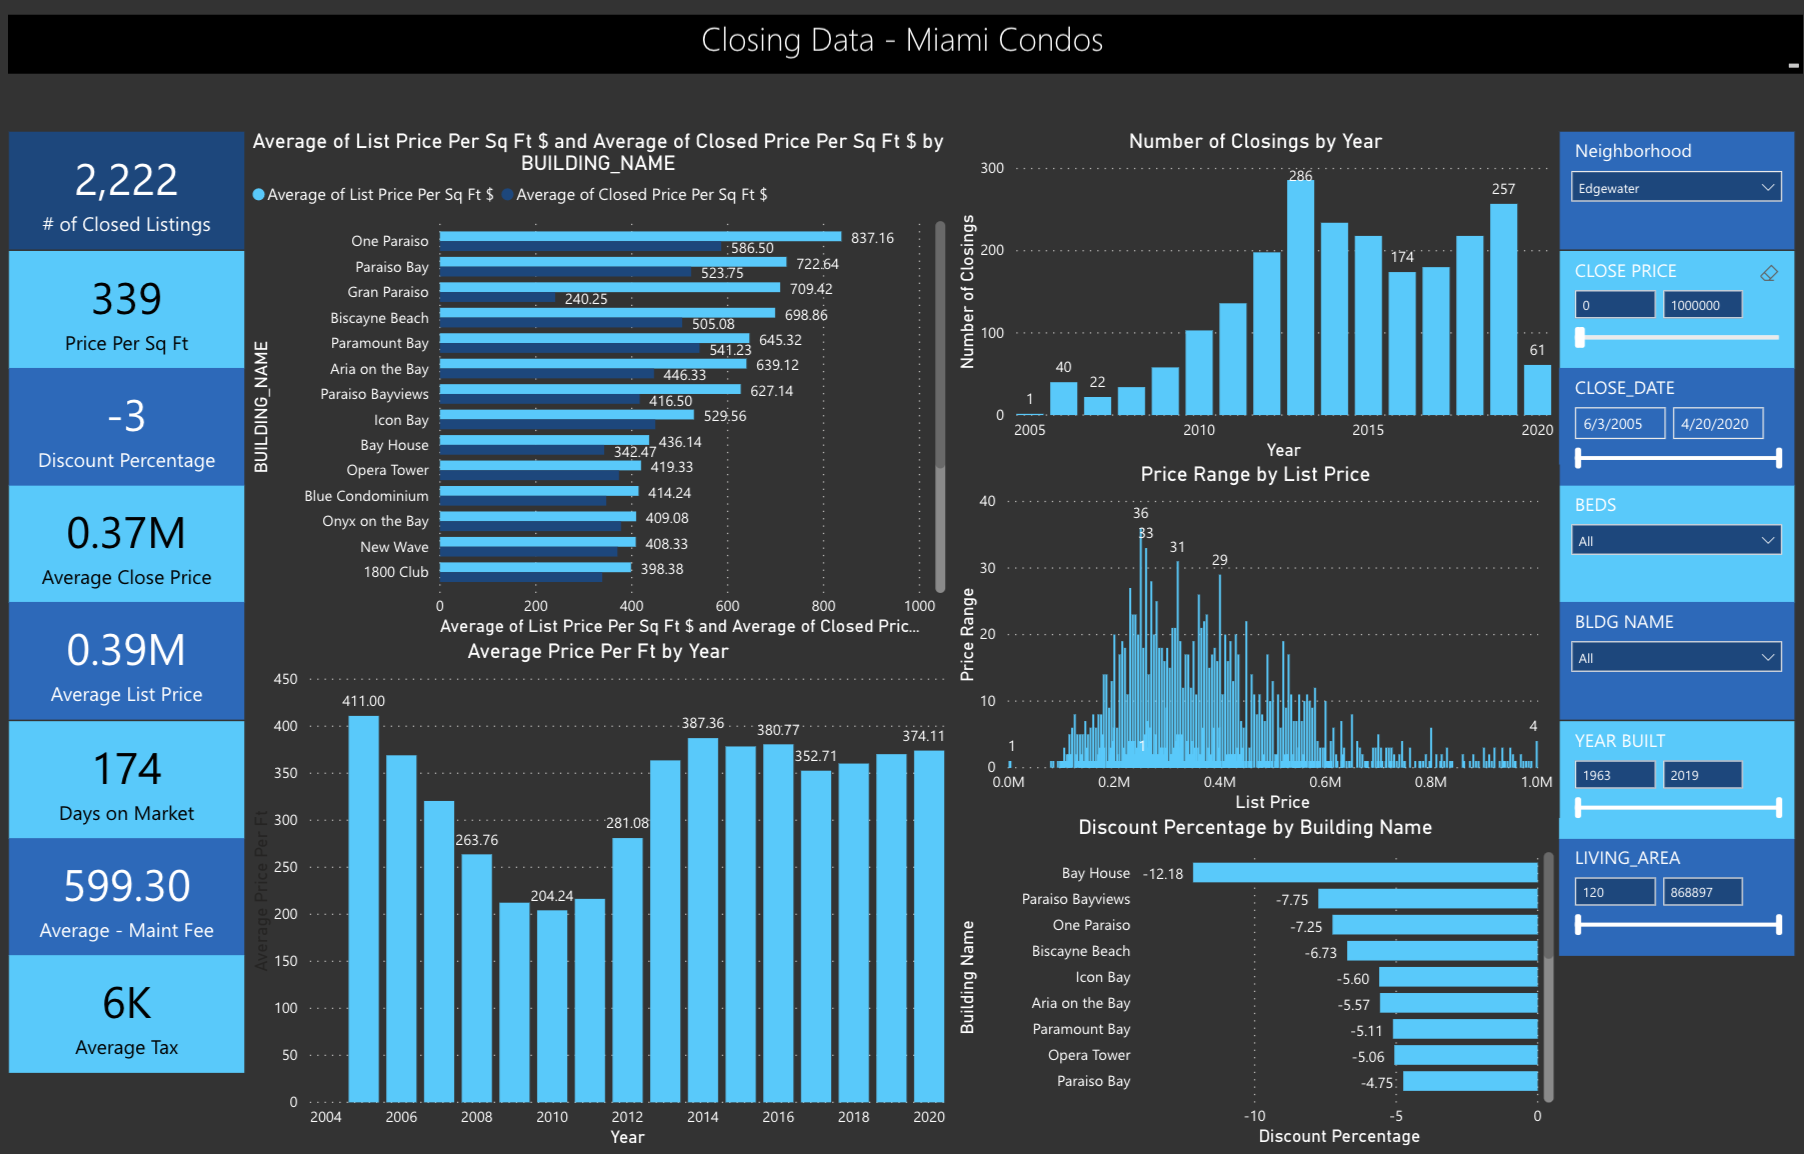
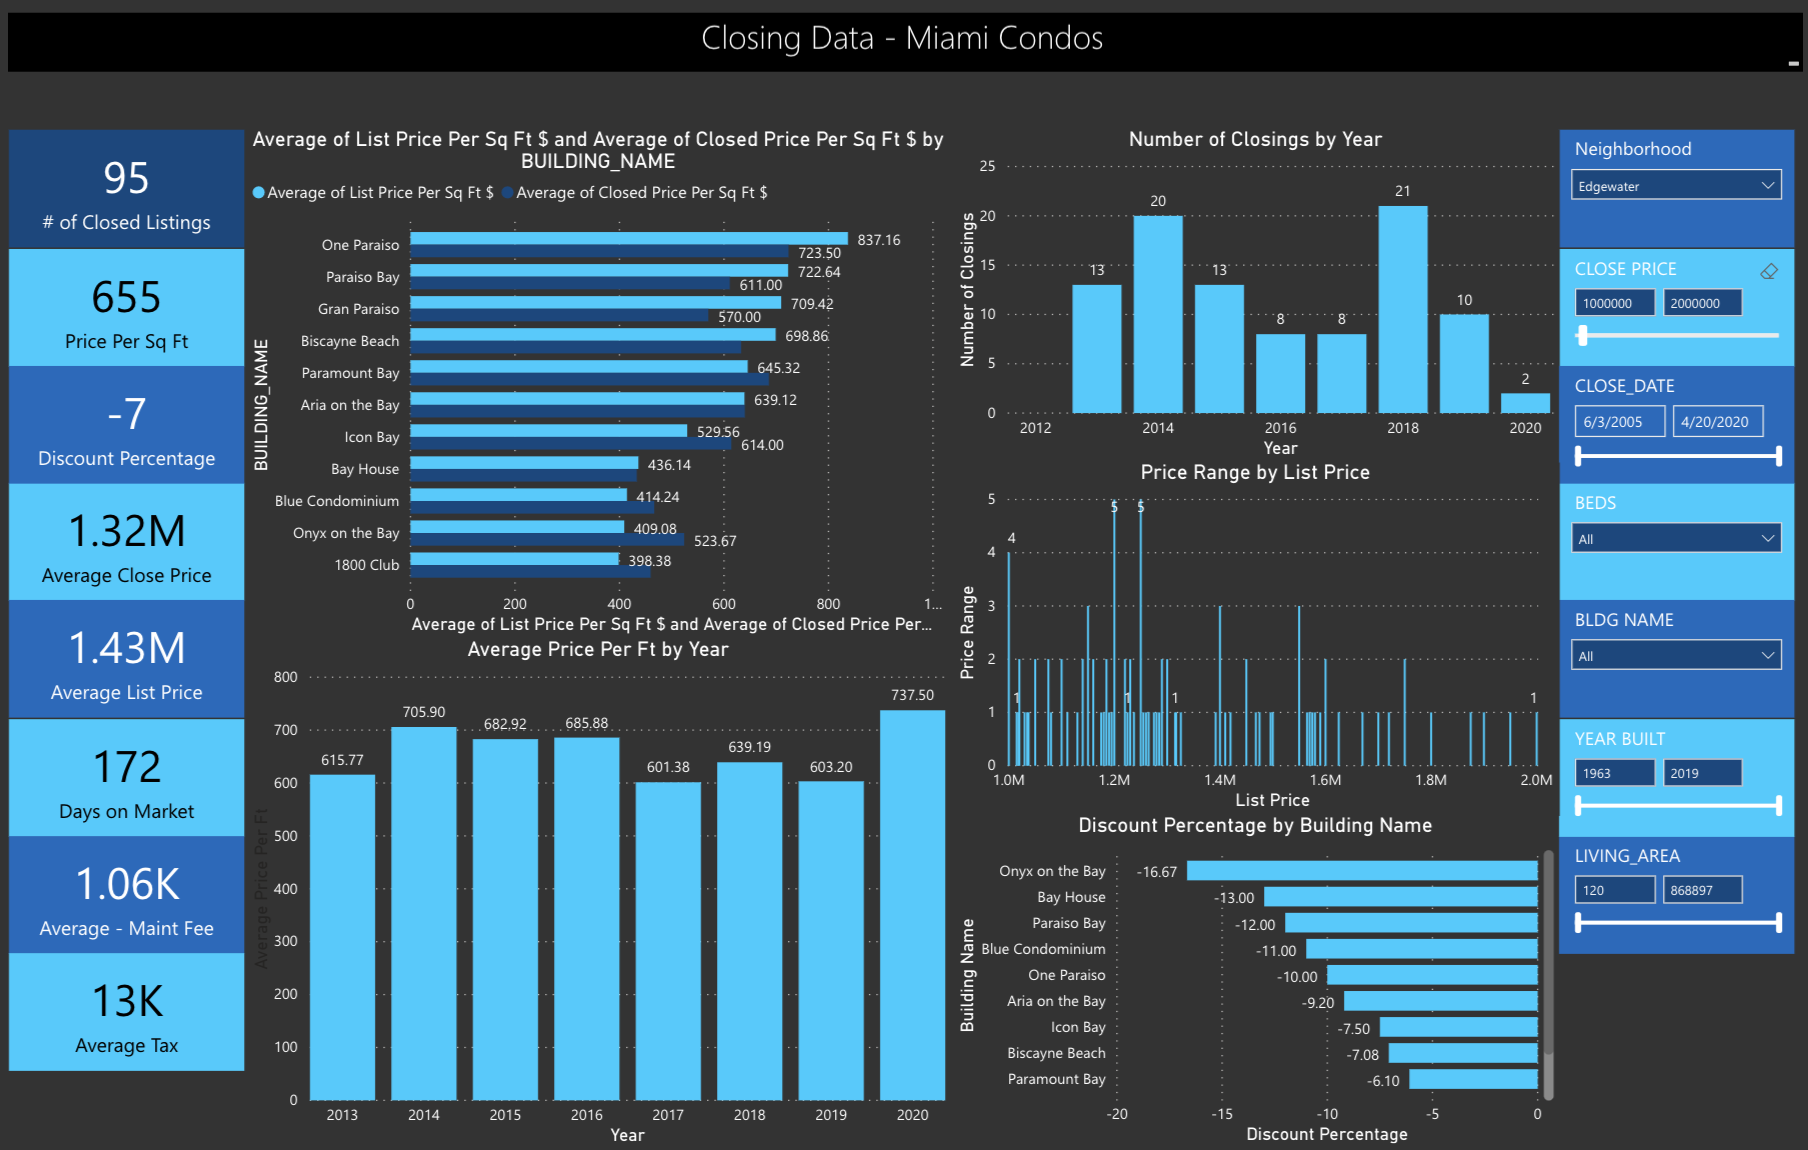
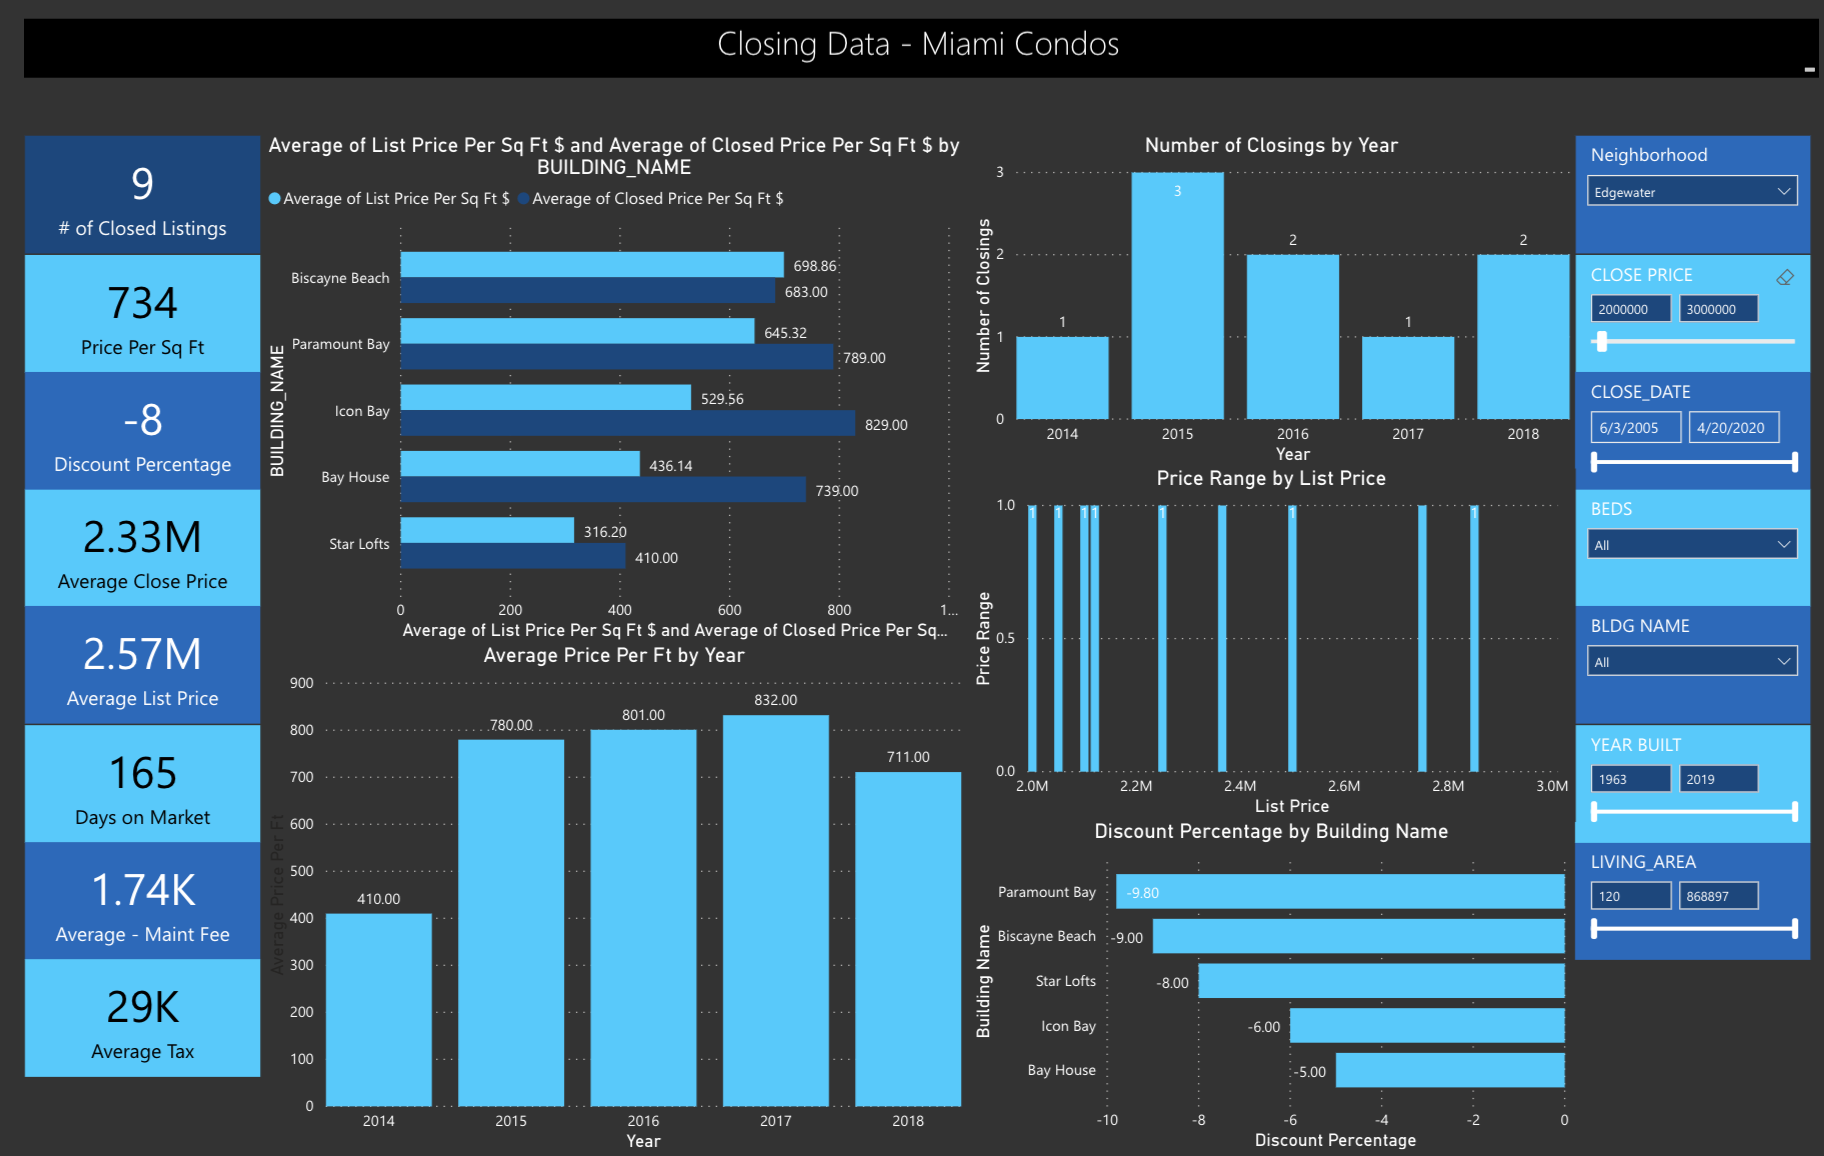
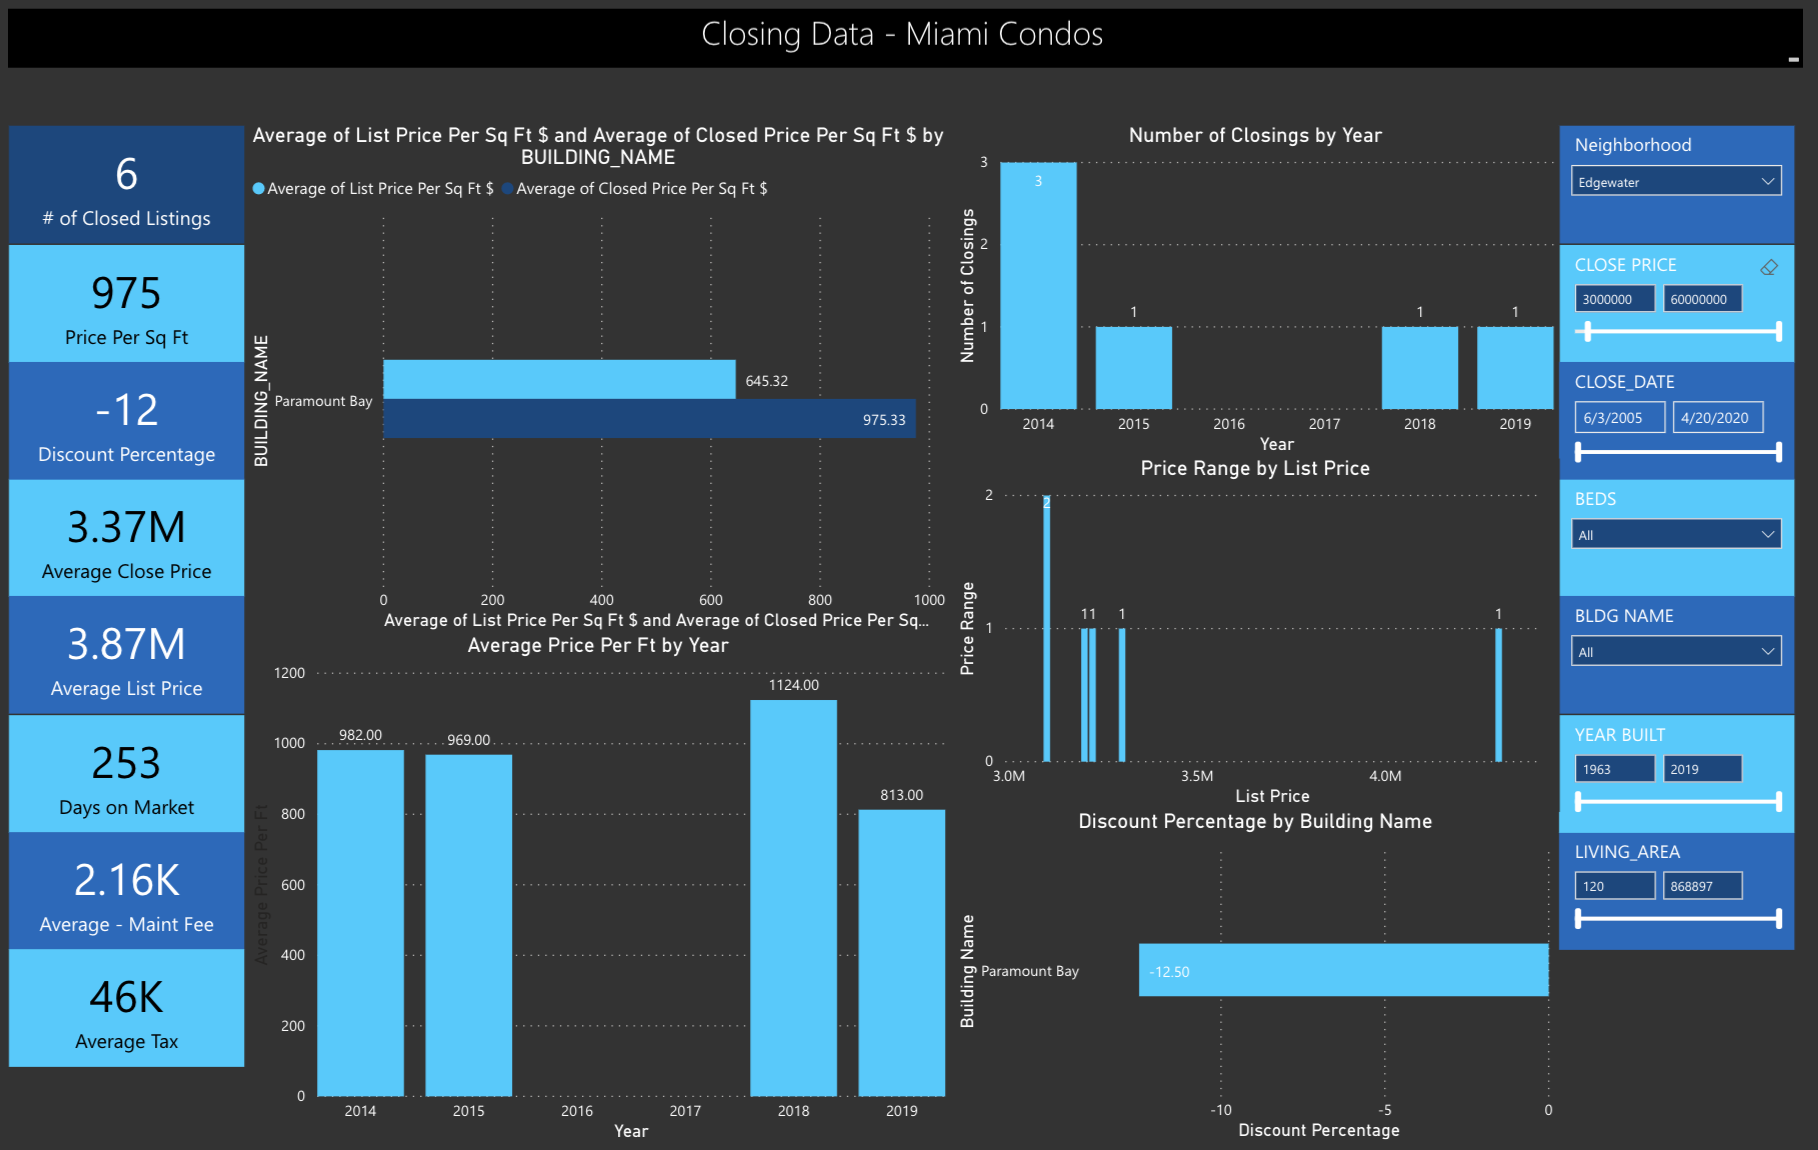
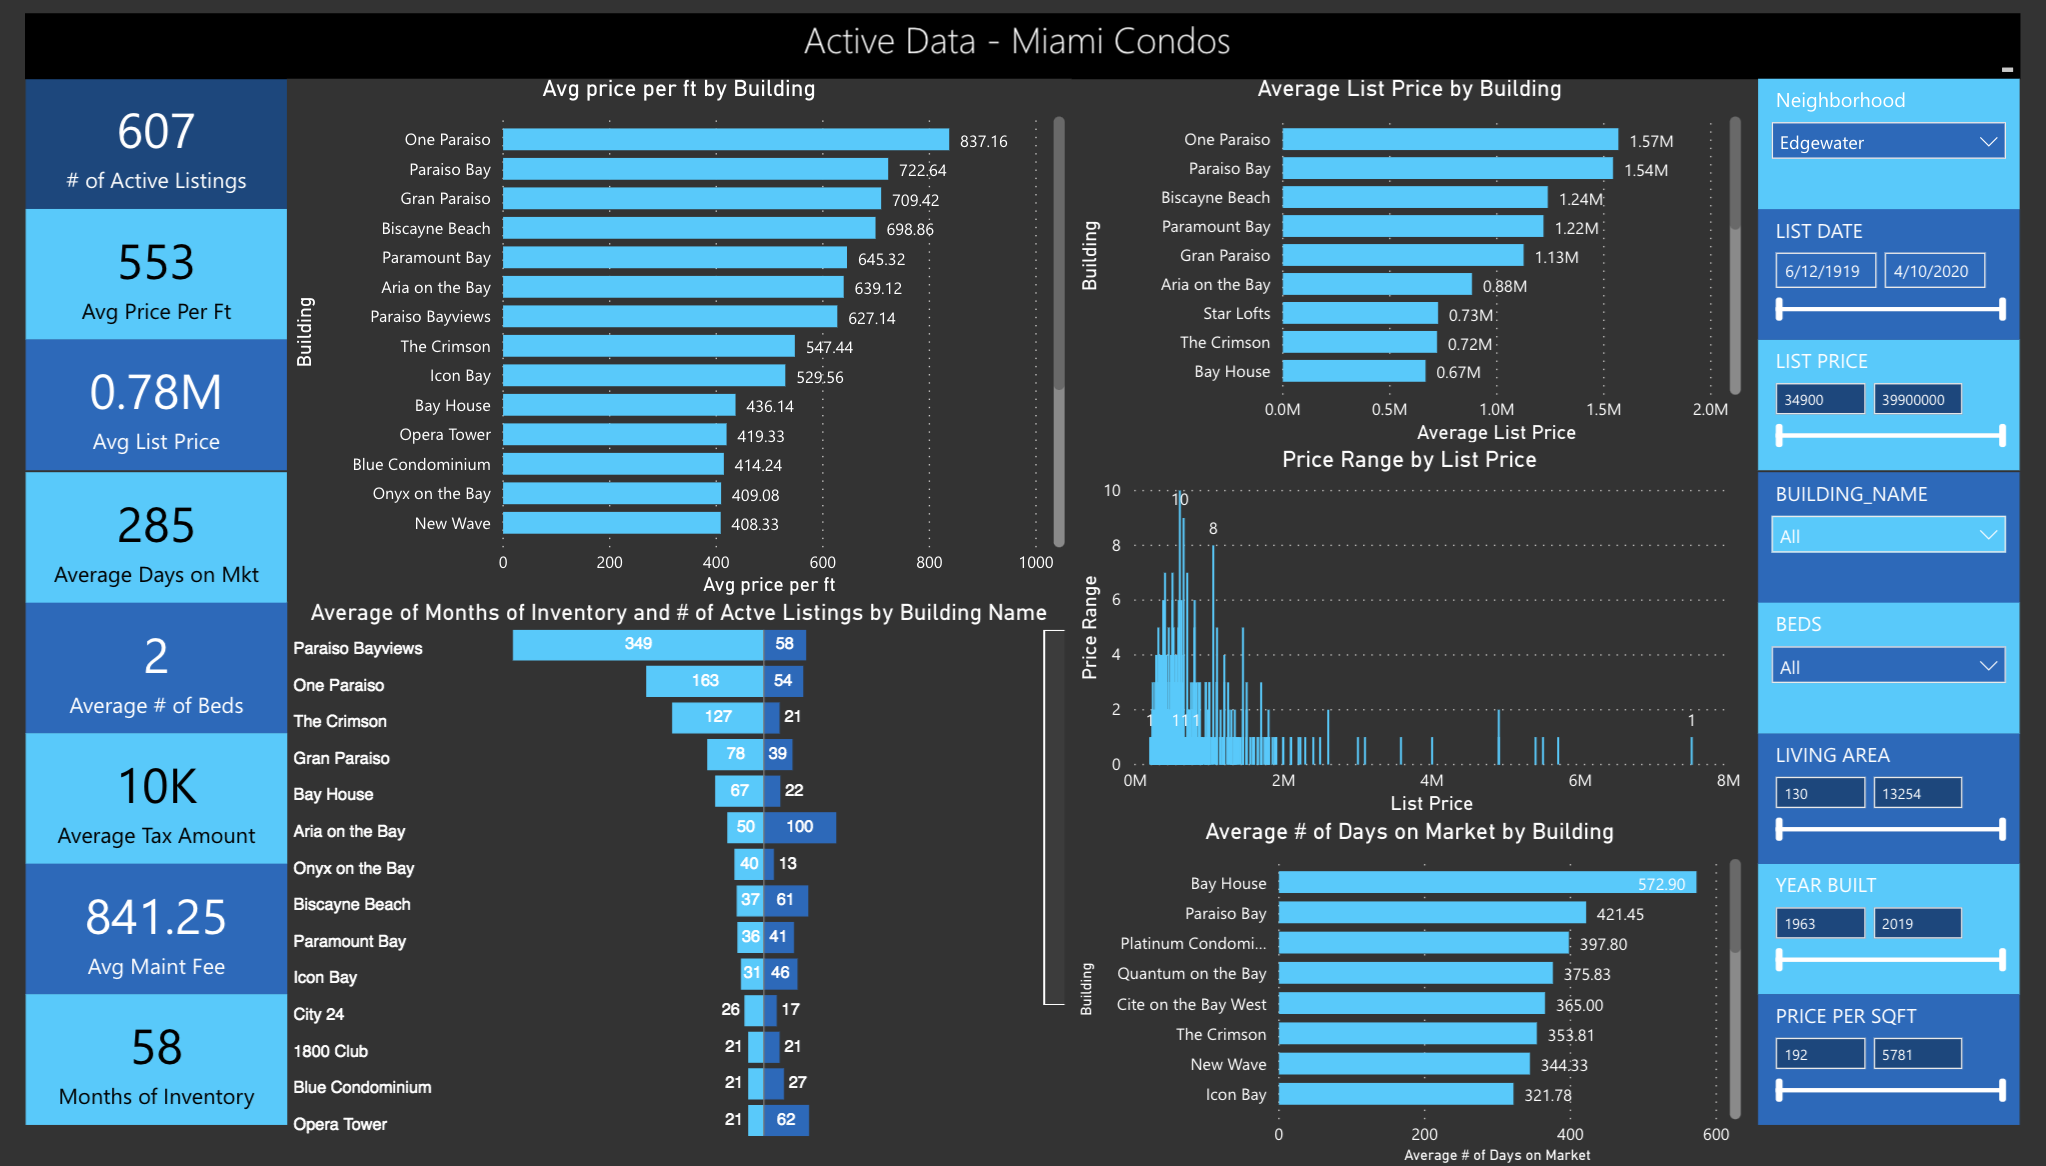
With an average sales price of $420 per sqft we are back to midway between 2012-2013 prices. Just 10 sales for the first quarter of 2020 and only 4 of those came in the newer Edgewater condos (From 2010 onwards). We expect sales to slow even further as one can imagine showings have become a far more difficult prospect and we are now seeing the effect of ‘Condos closed to showings’.
The Paraiso buildings (One Paraiso, Paraiso Bay) are by far holding the most inventory and discounts are coming thick and fast. Please check reviews online and as with all new buildings be aware of the high number of rentals in these condos. Biscayne Beach may be your best option.
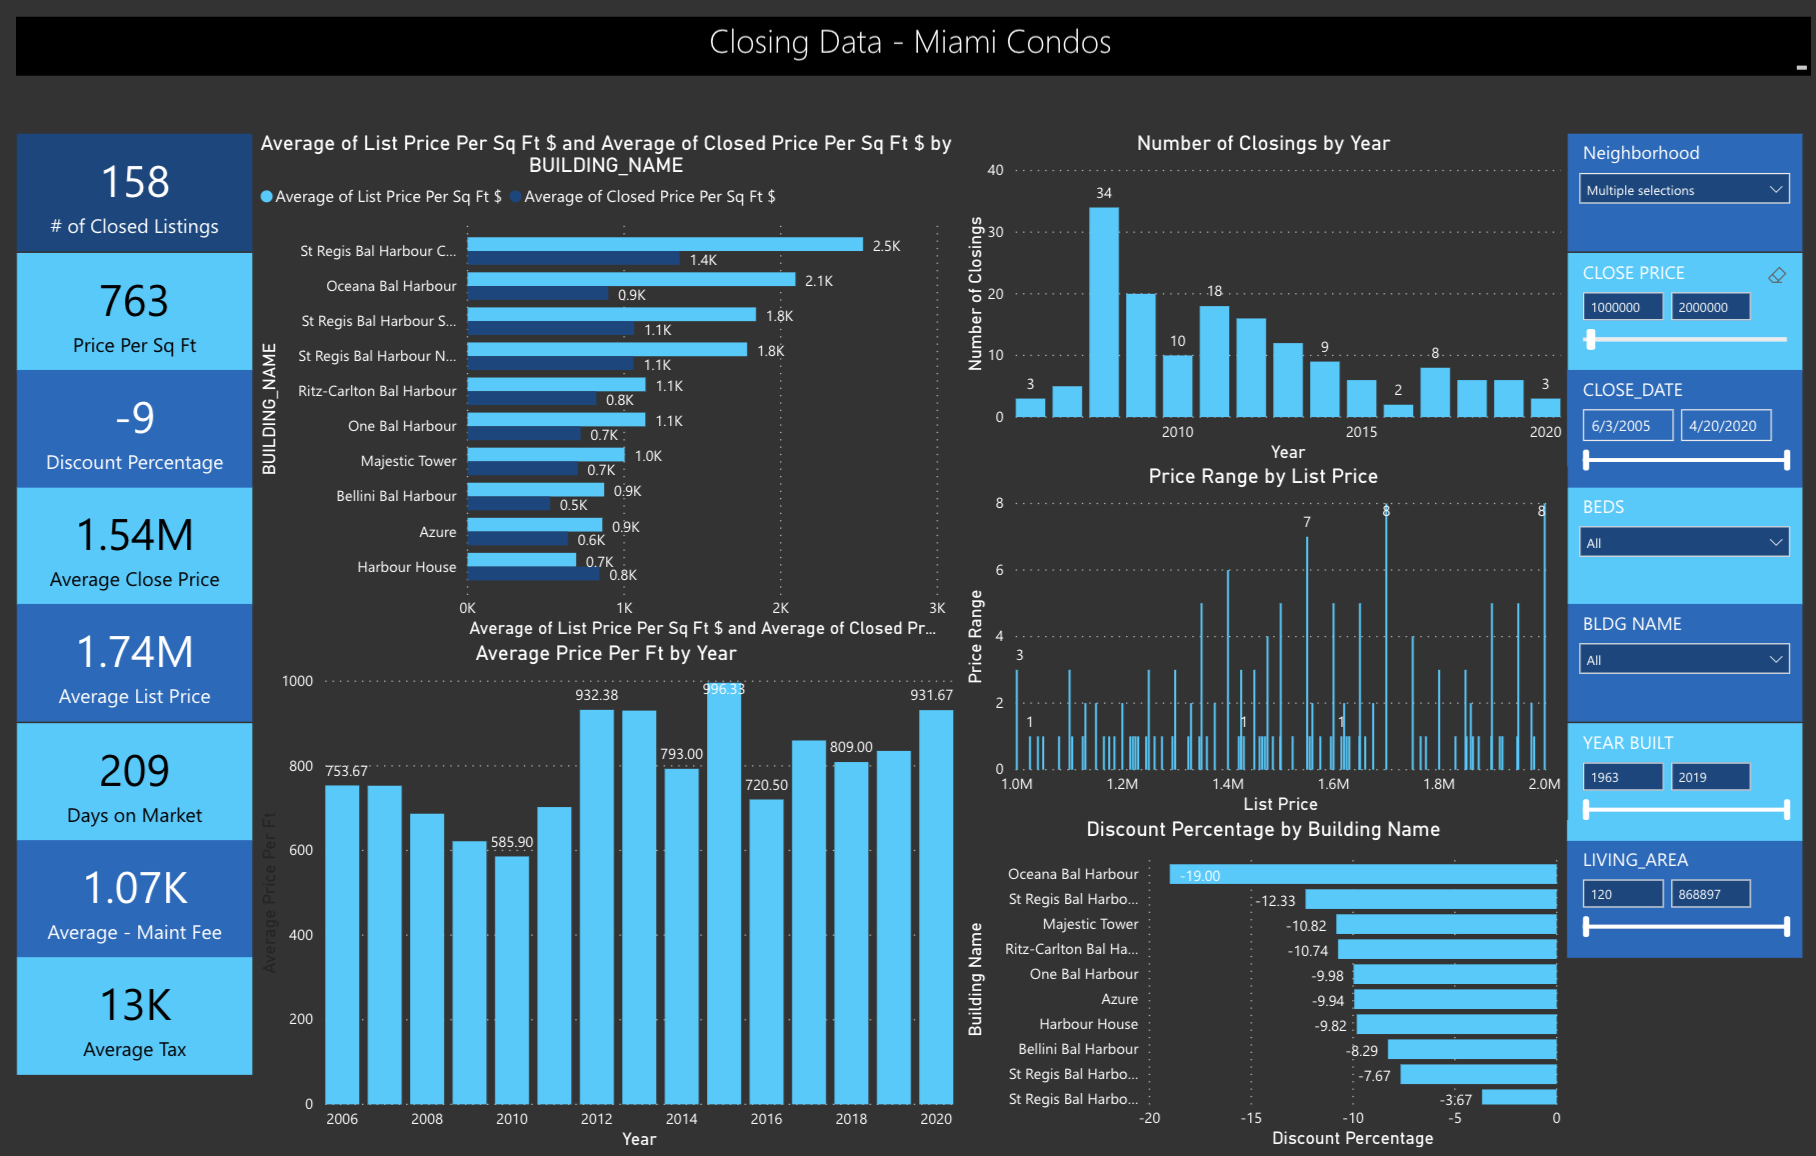
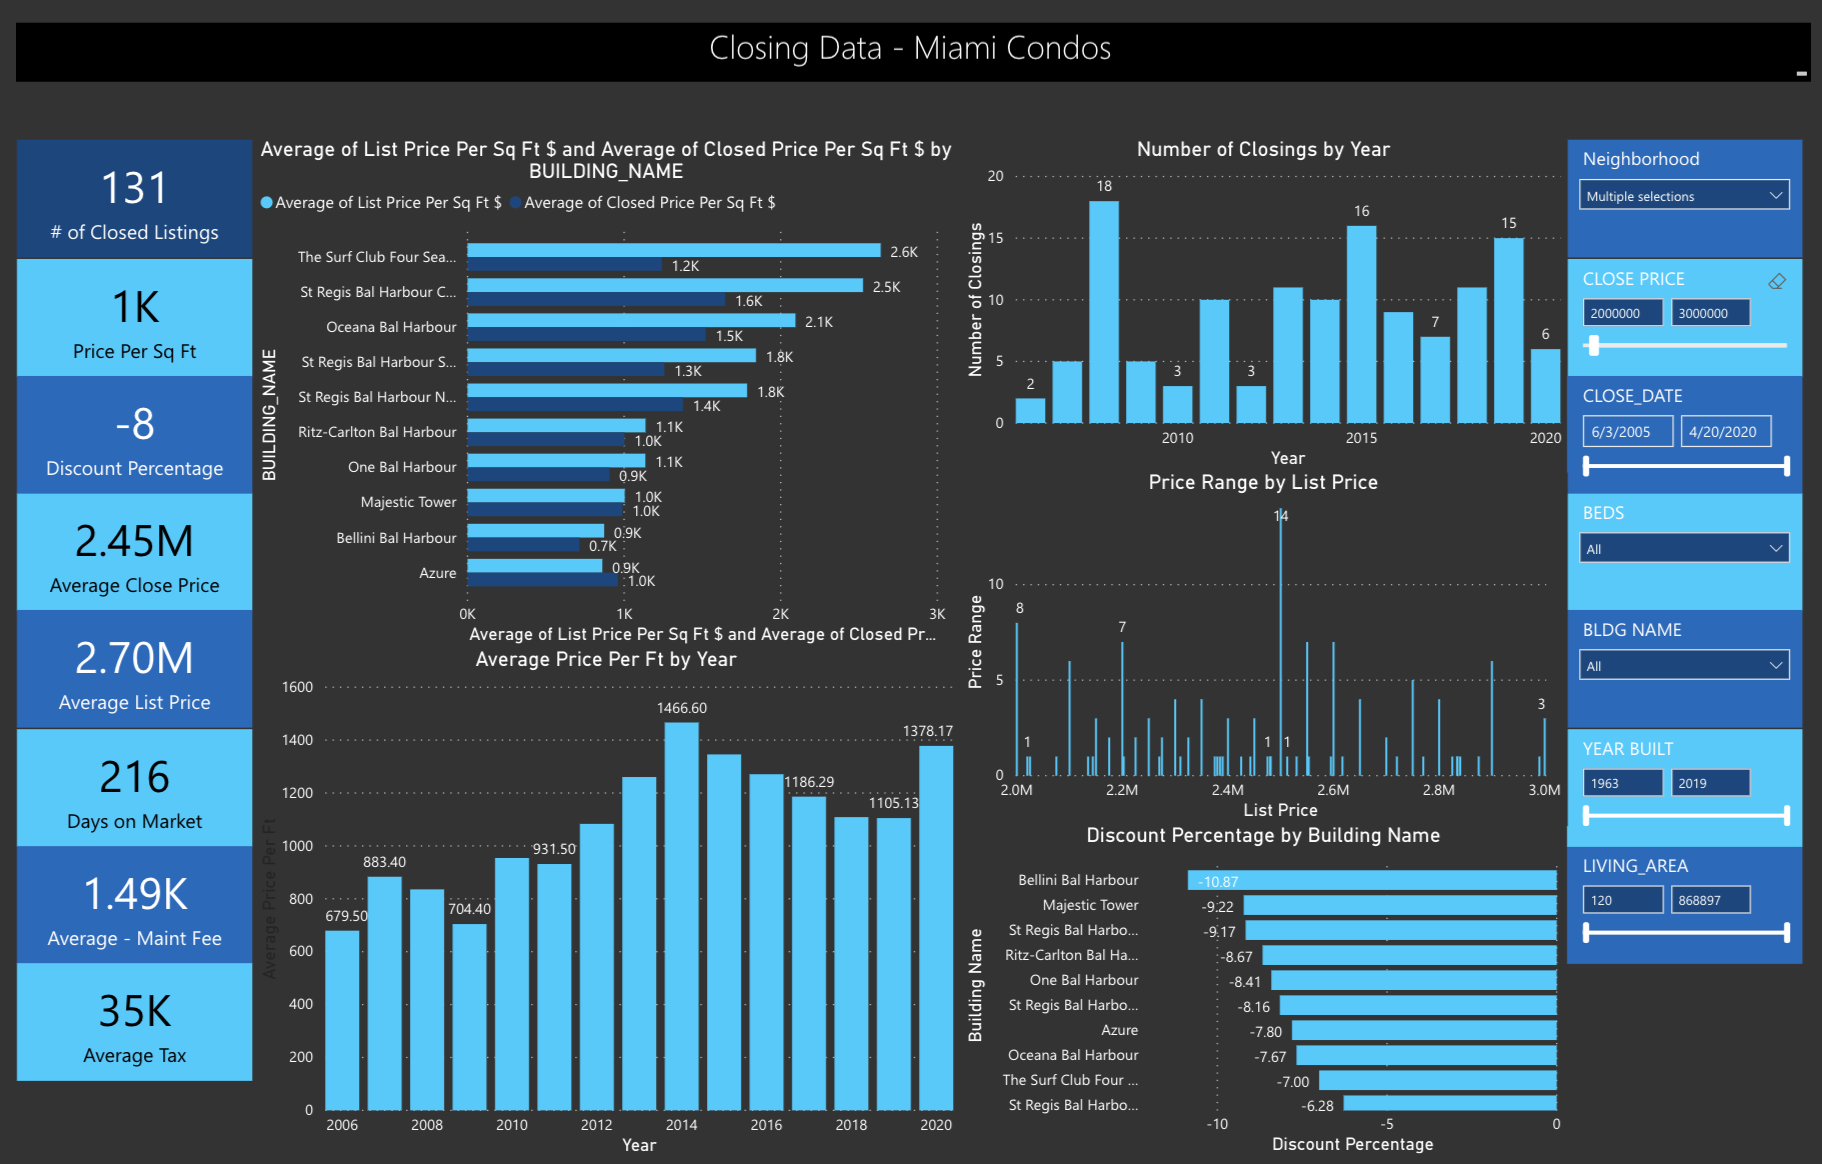
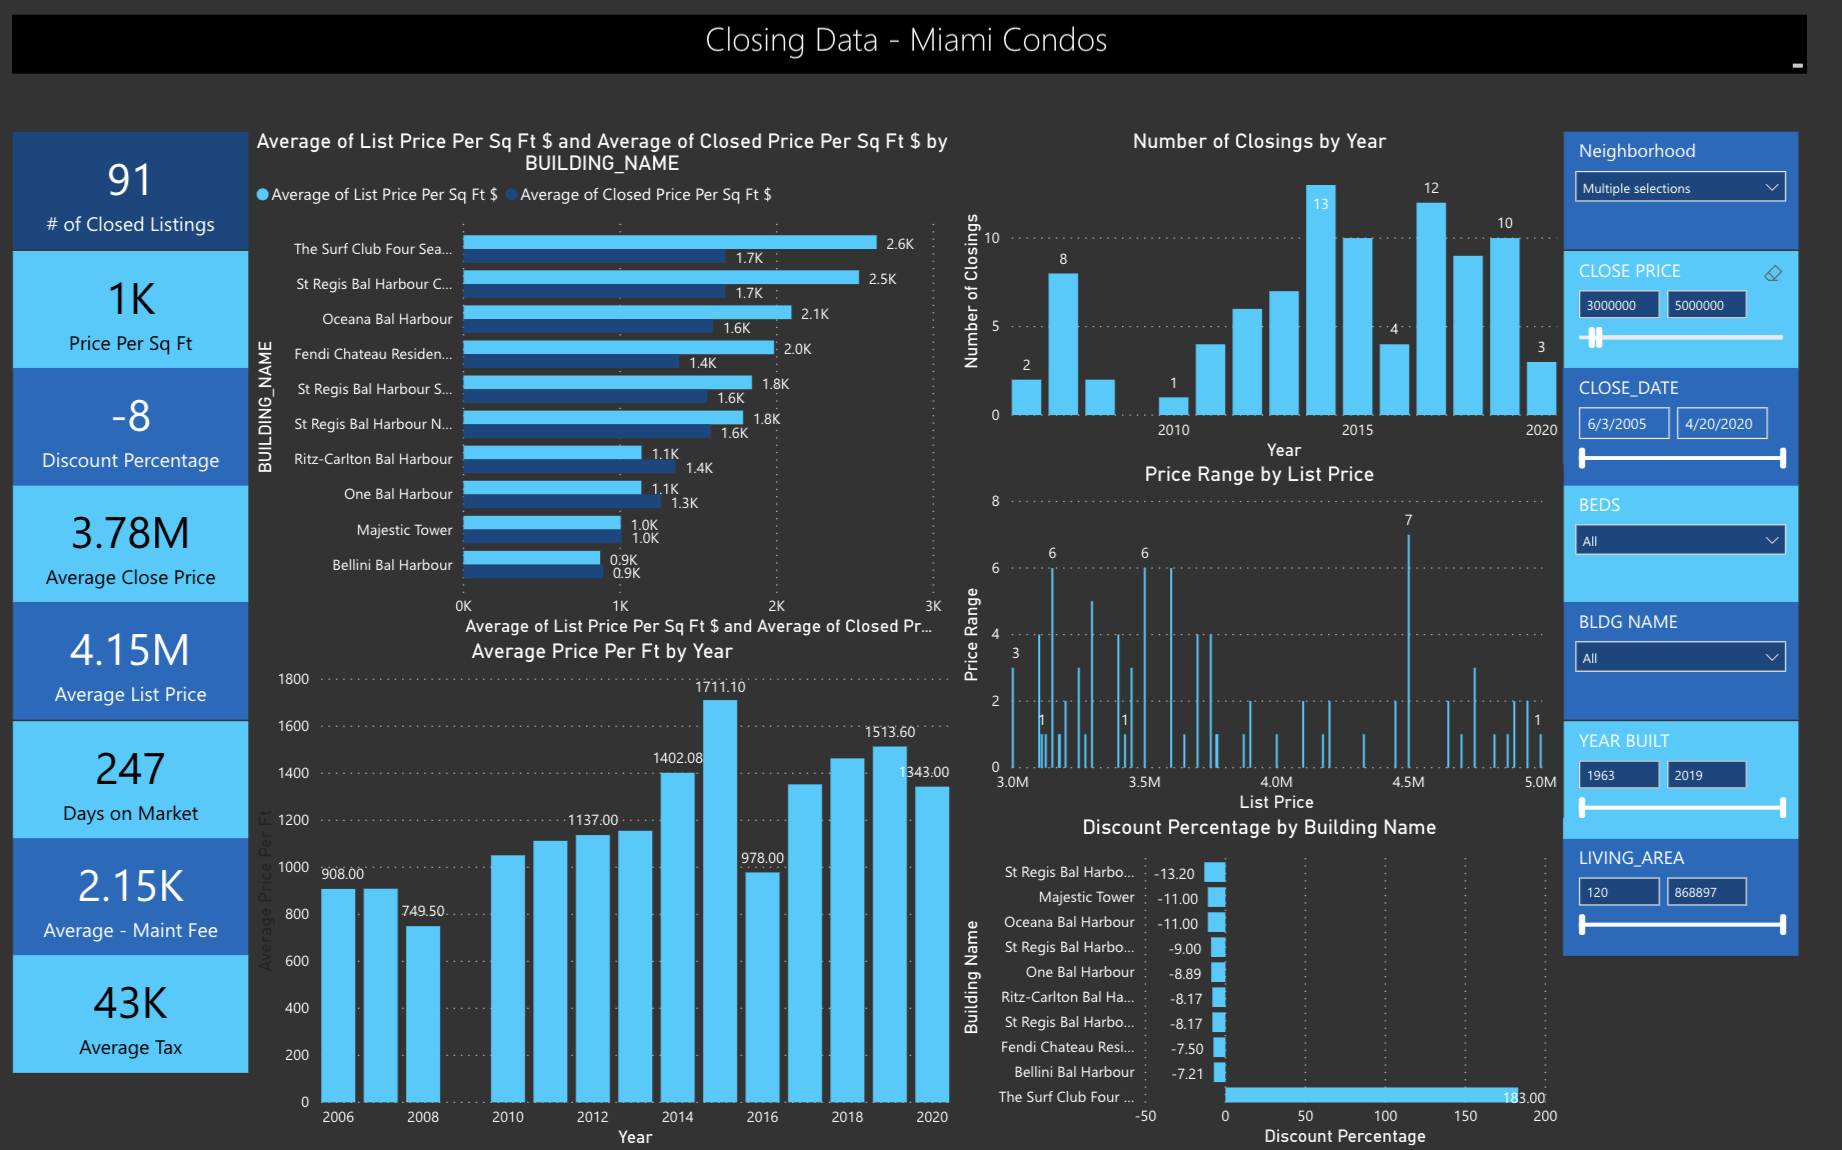
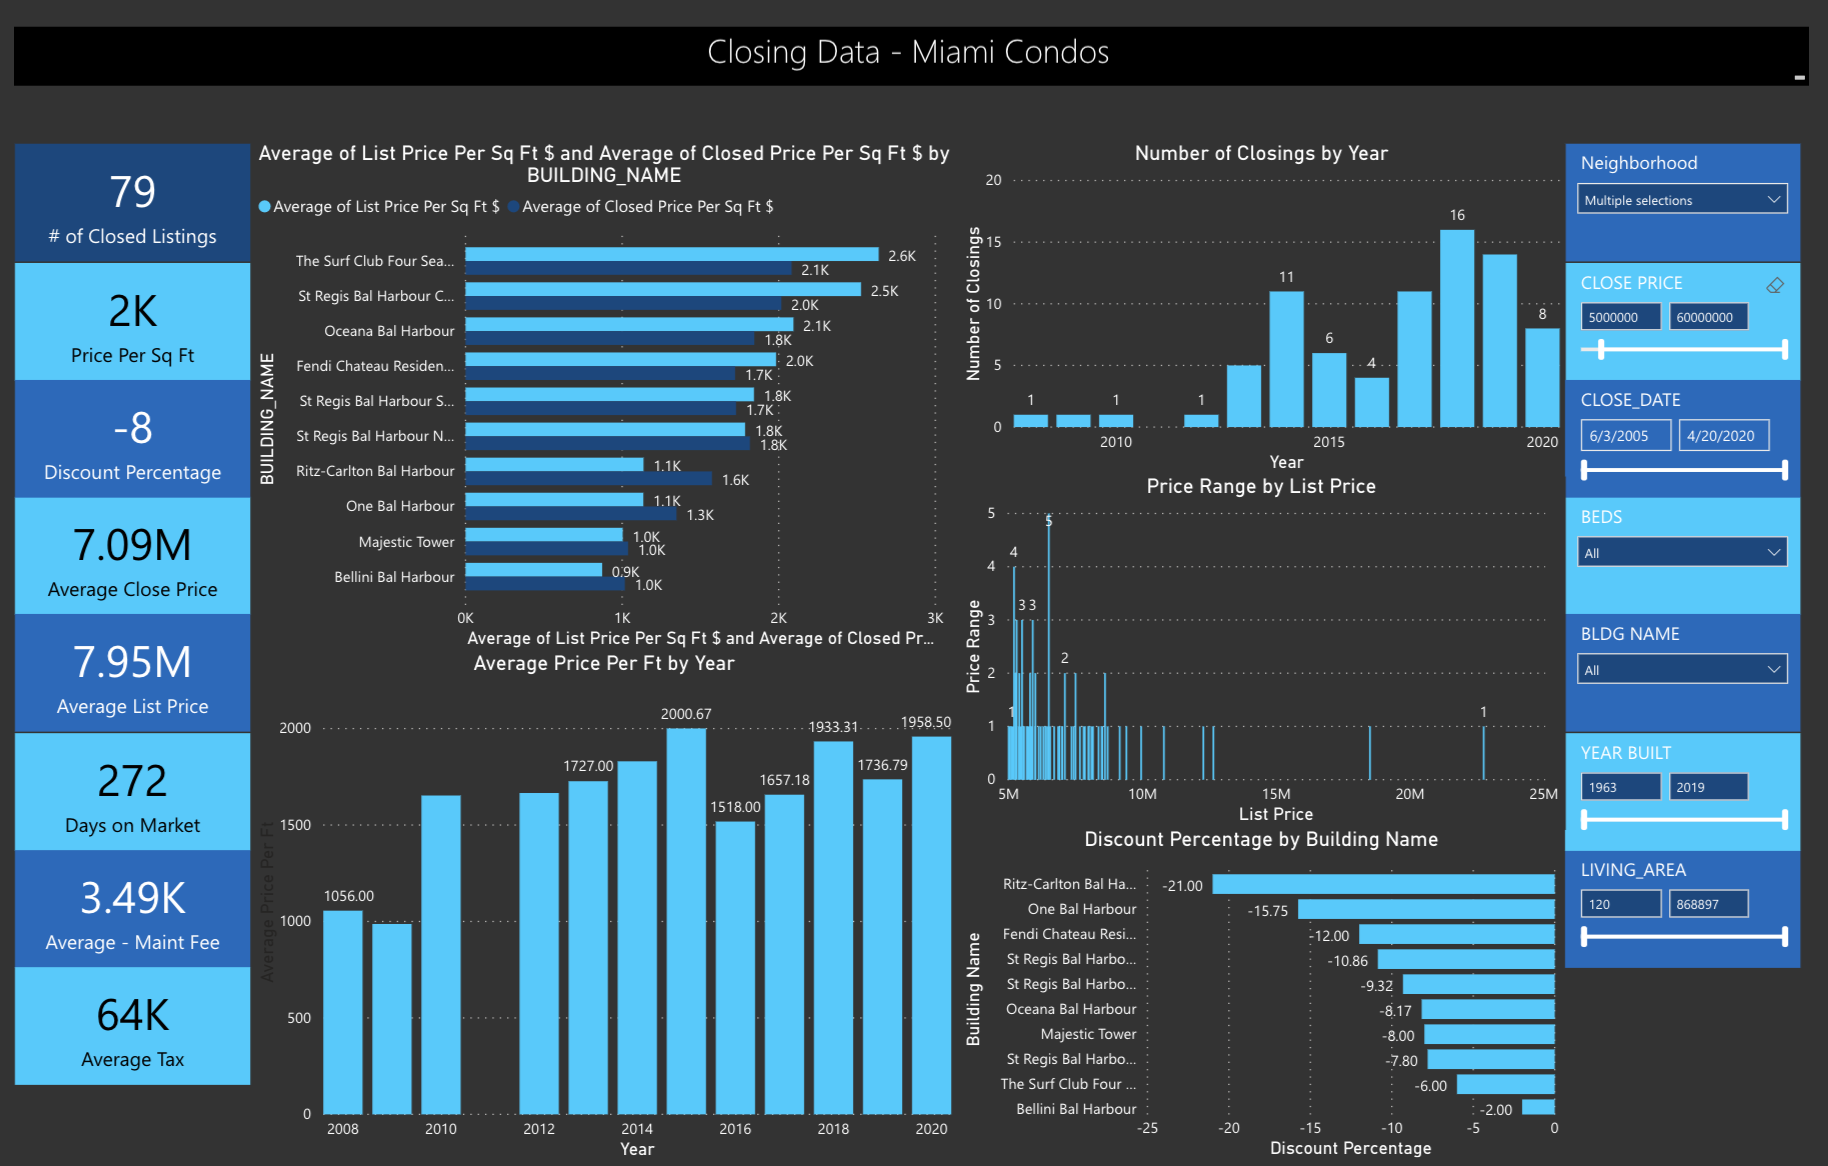
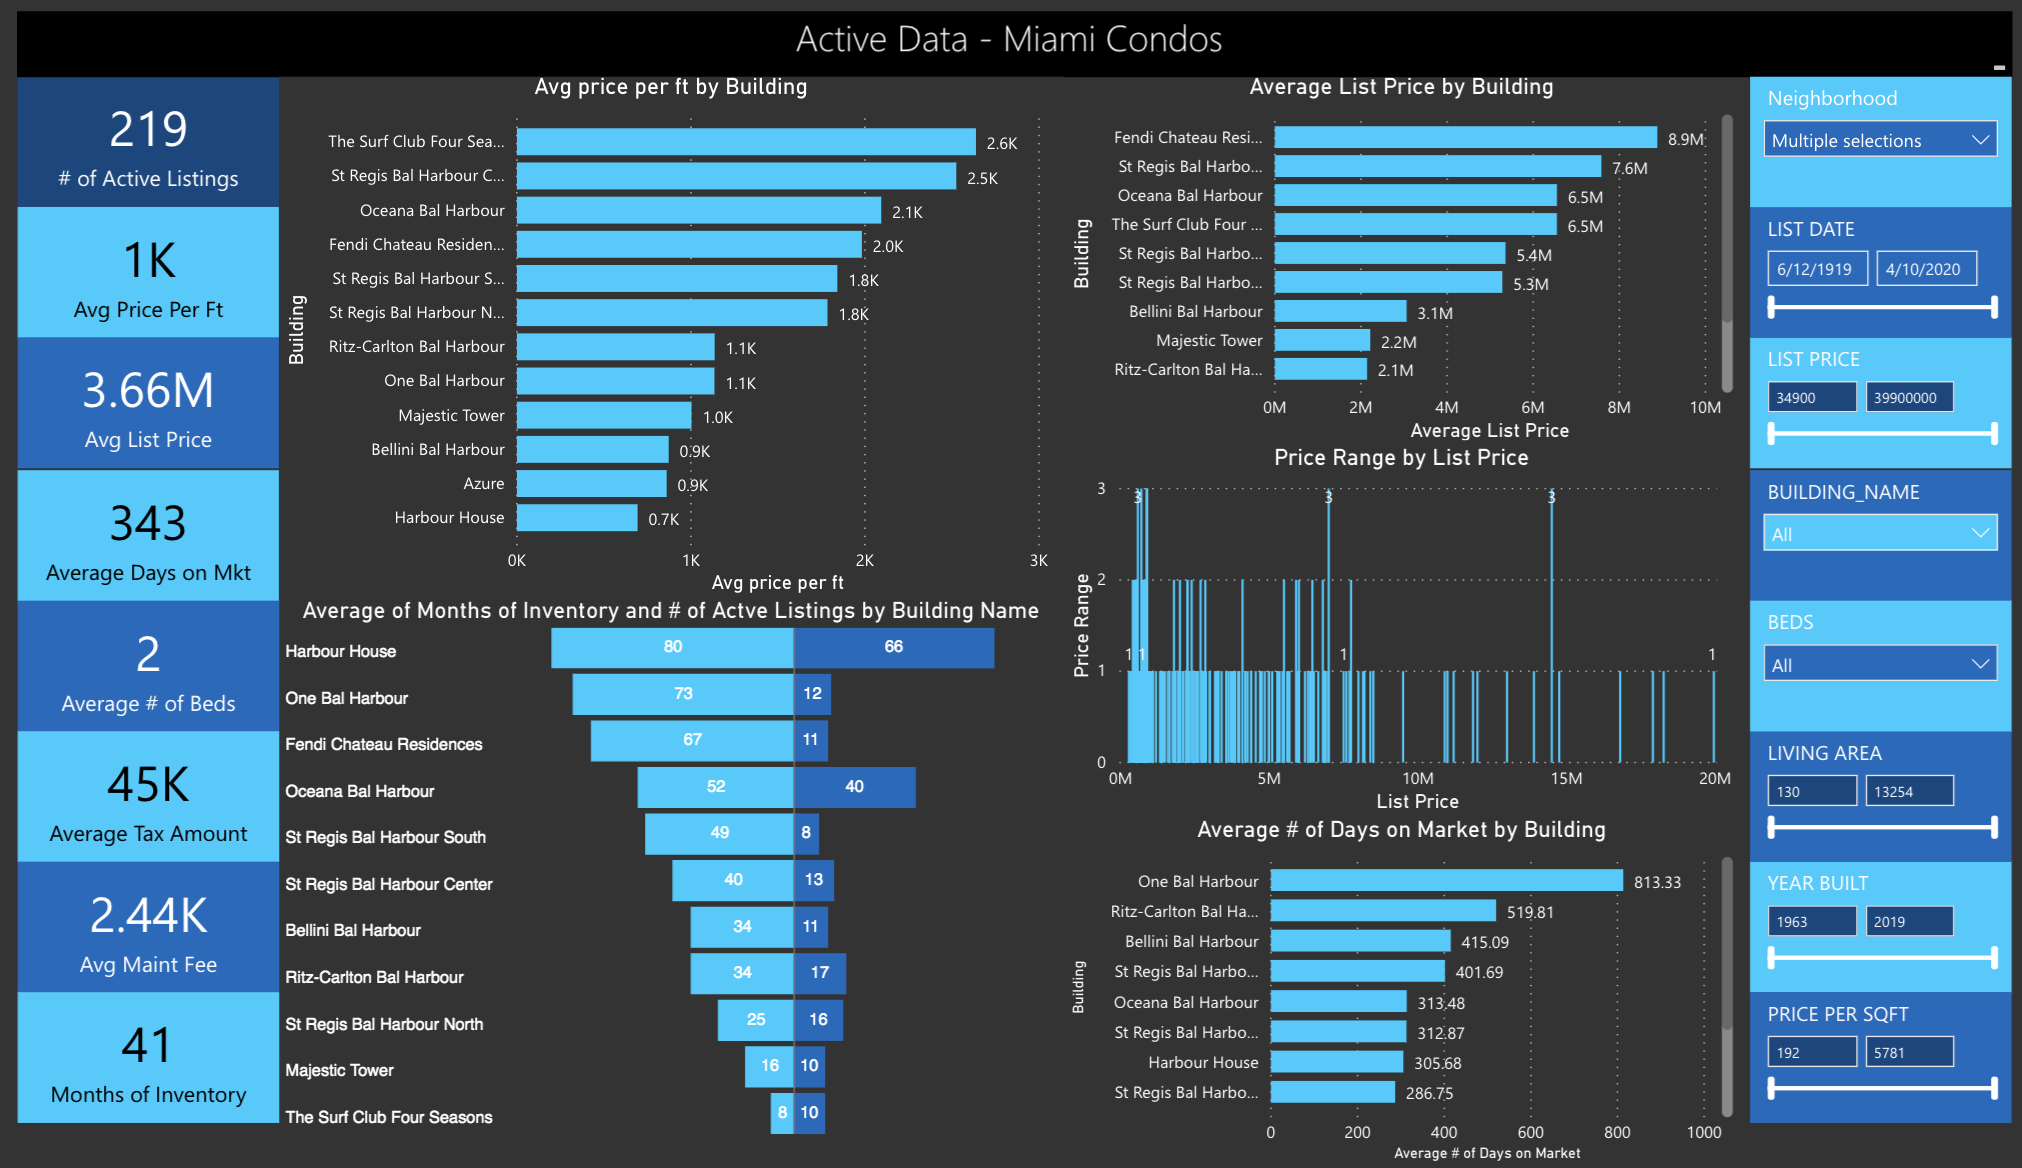
Bal Harbour and Surfside Condos Q1 2020
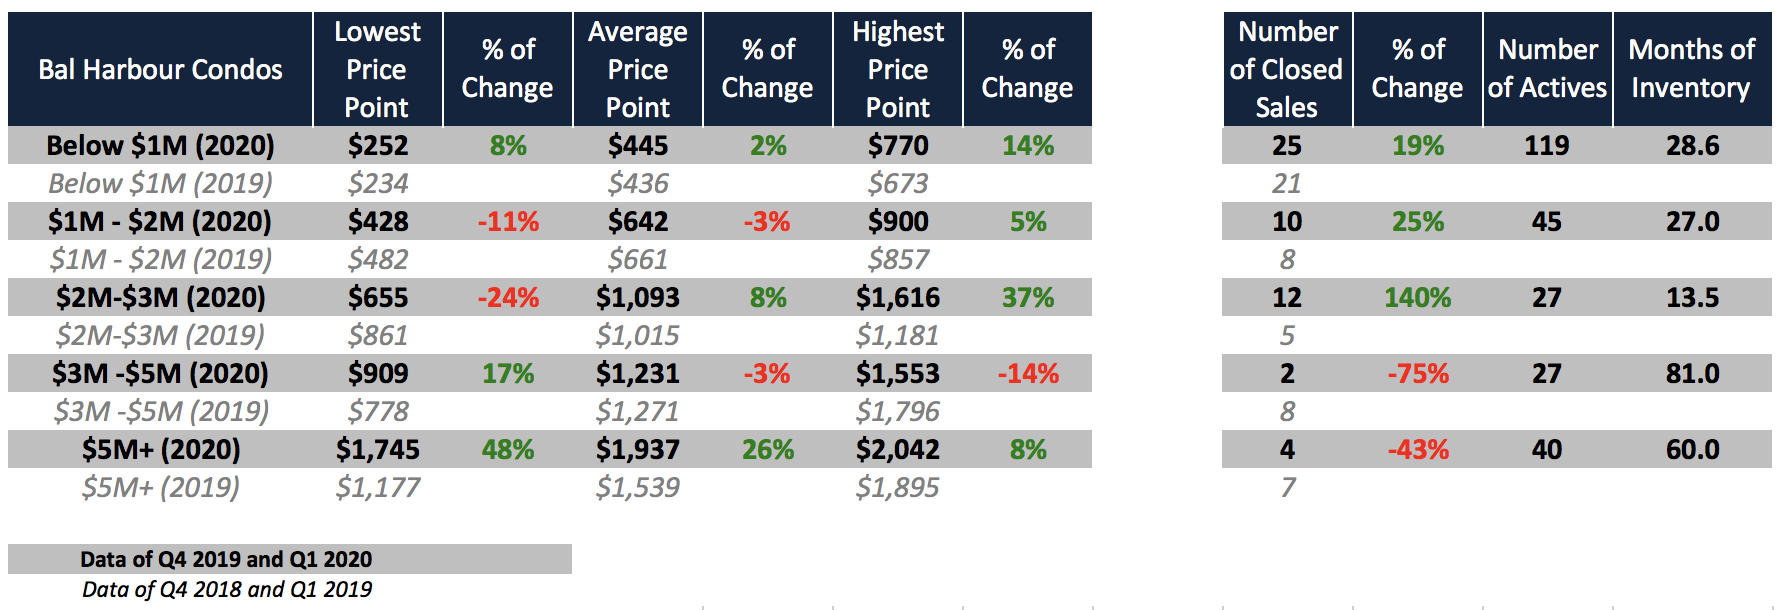
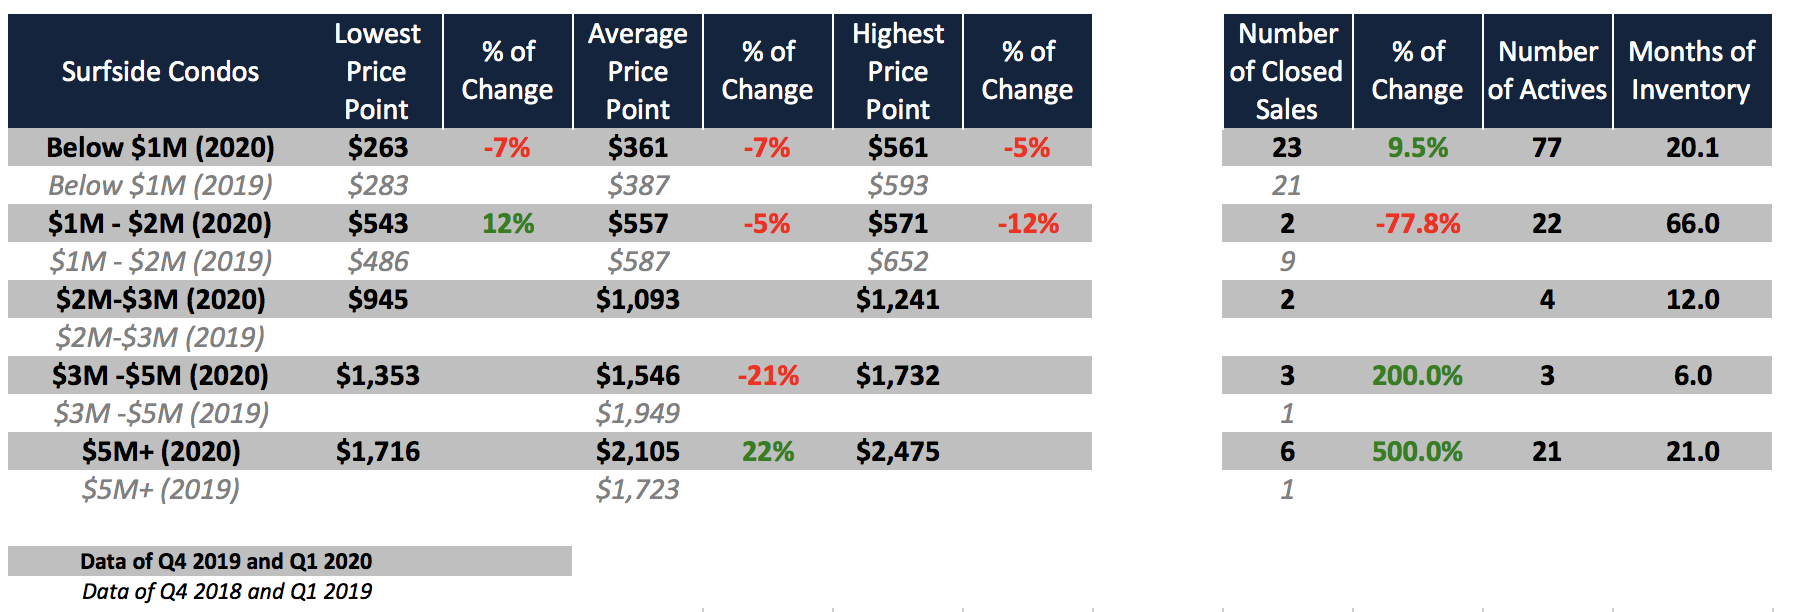
These two combined are the best performing neighborhoods in Miami in the luxury sector. Q1 saw the top sales at: Oceana, Fendi, Four Seasons Surfside and St Regis. The top price per sqft in this market for 2020 was by the David Siddons group: $2,025 per SF with unit 1701 at Oceana. The performance of this neighborhood is now higher than it has ever been! This is extremely unusual considering all other neighborhoods are down. Please read Part 1 of the 2020 report, which discusses the best performing neighborhoods.
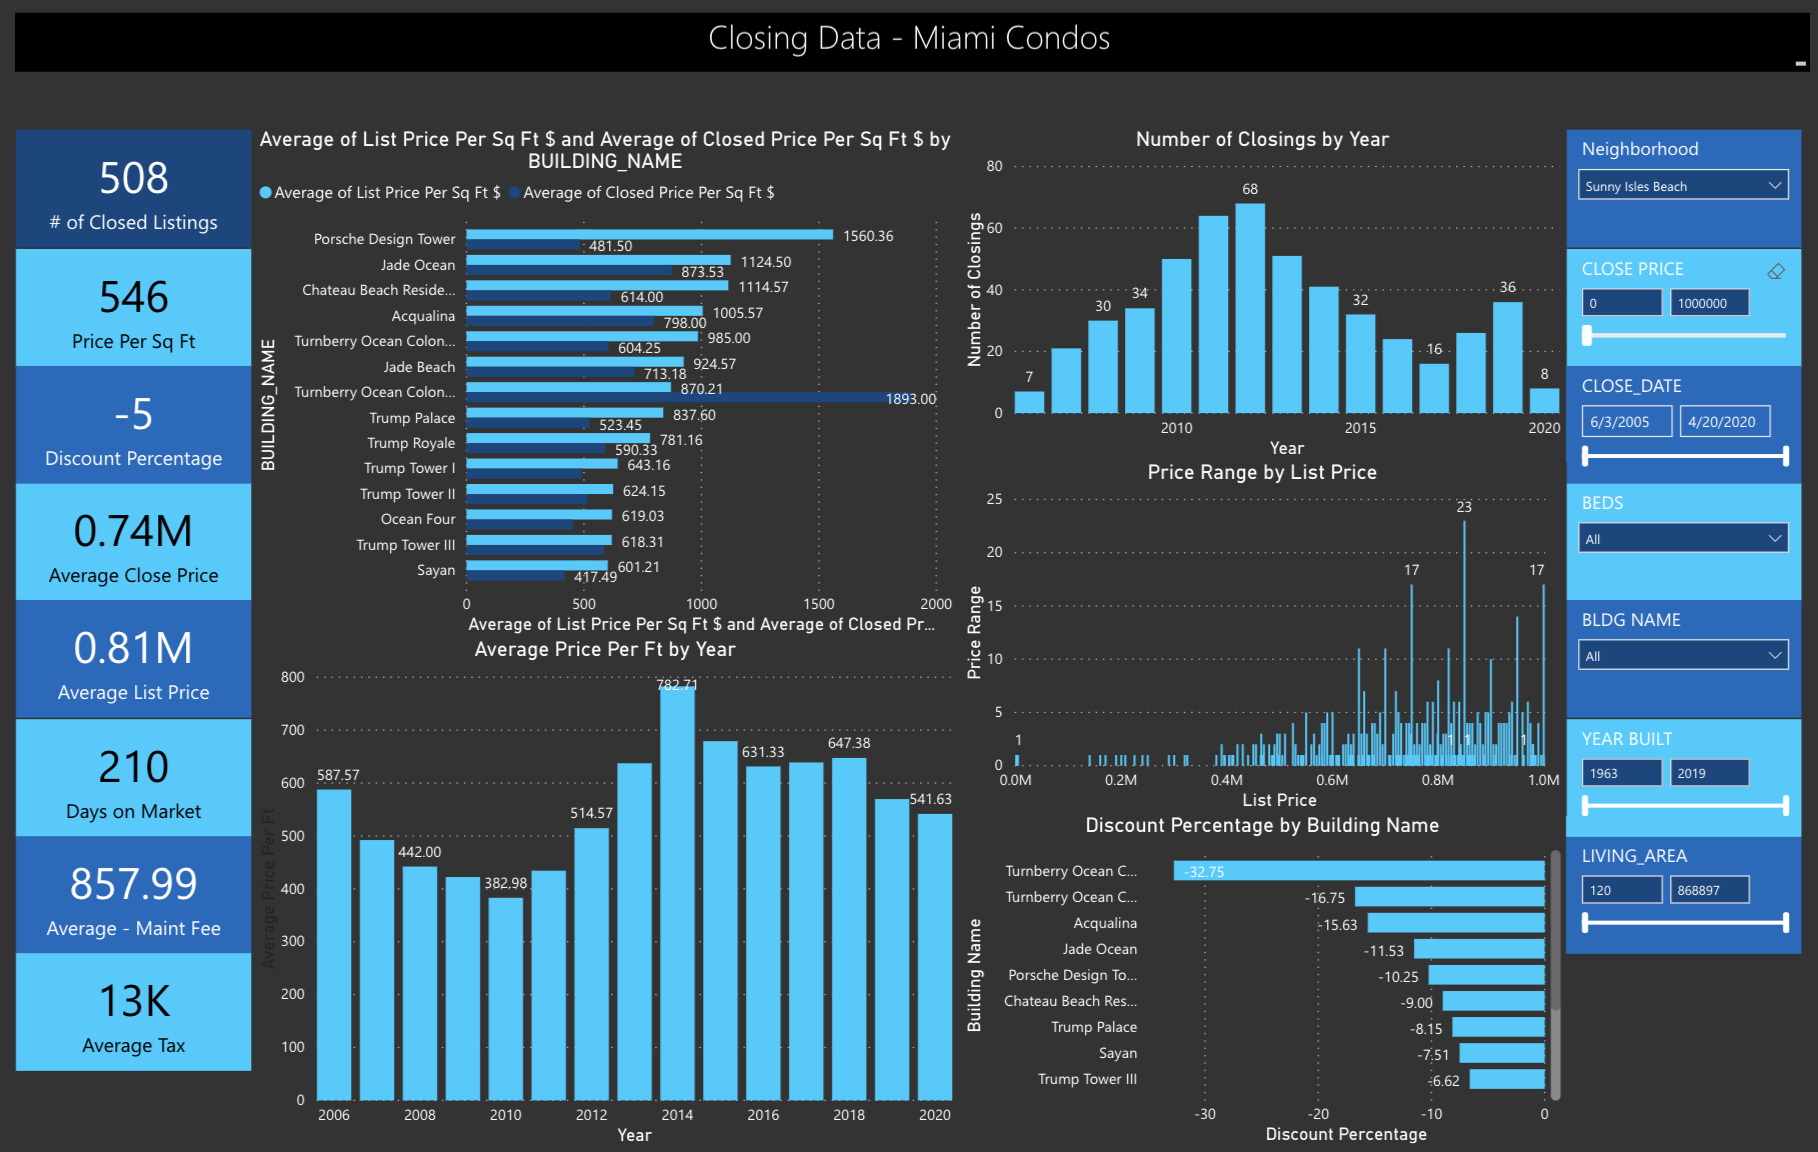
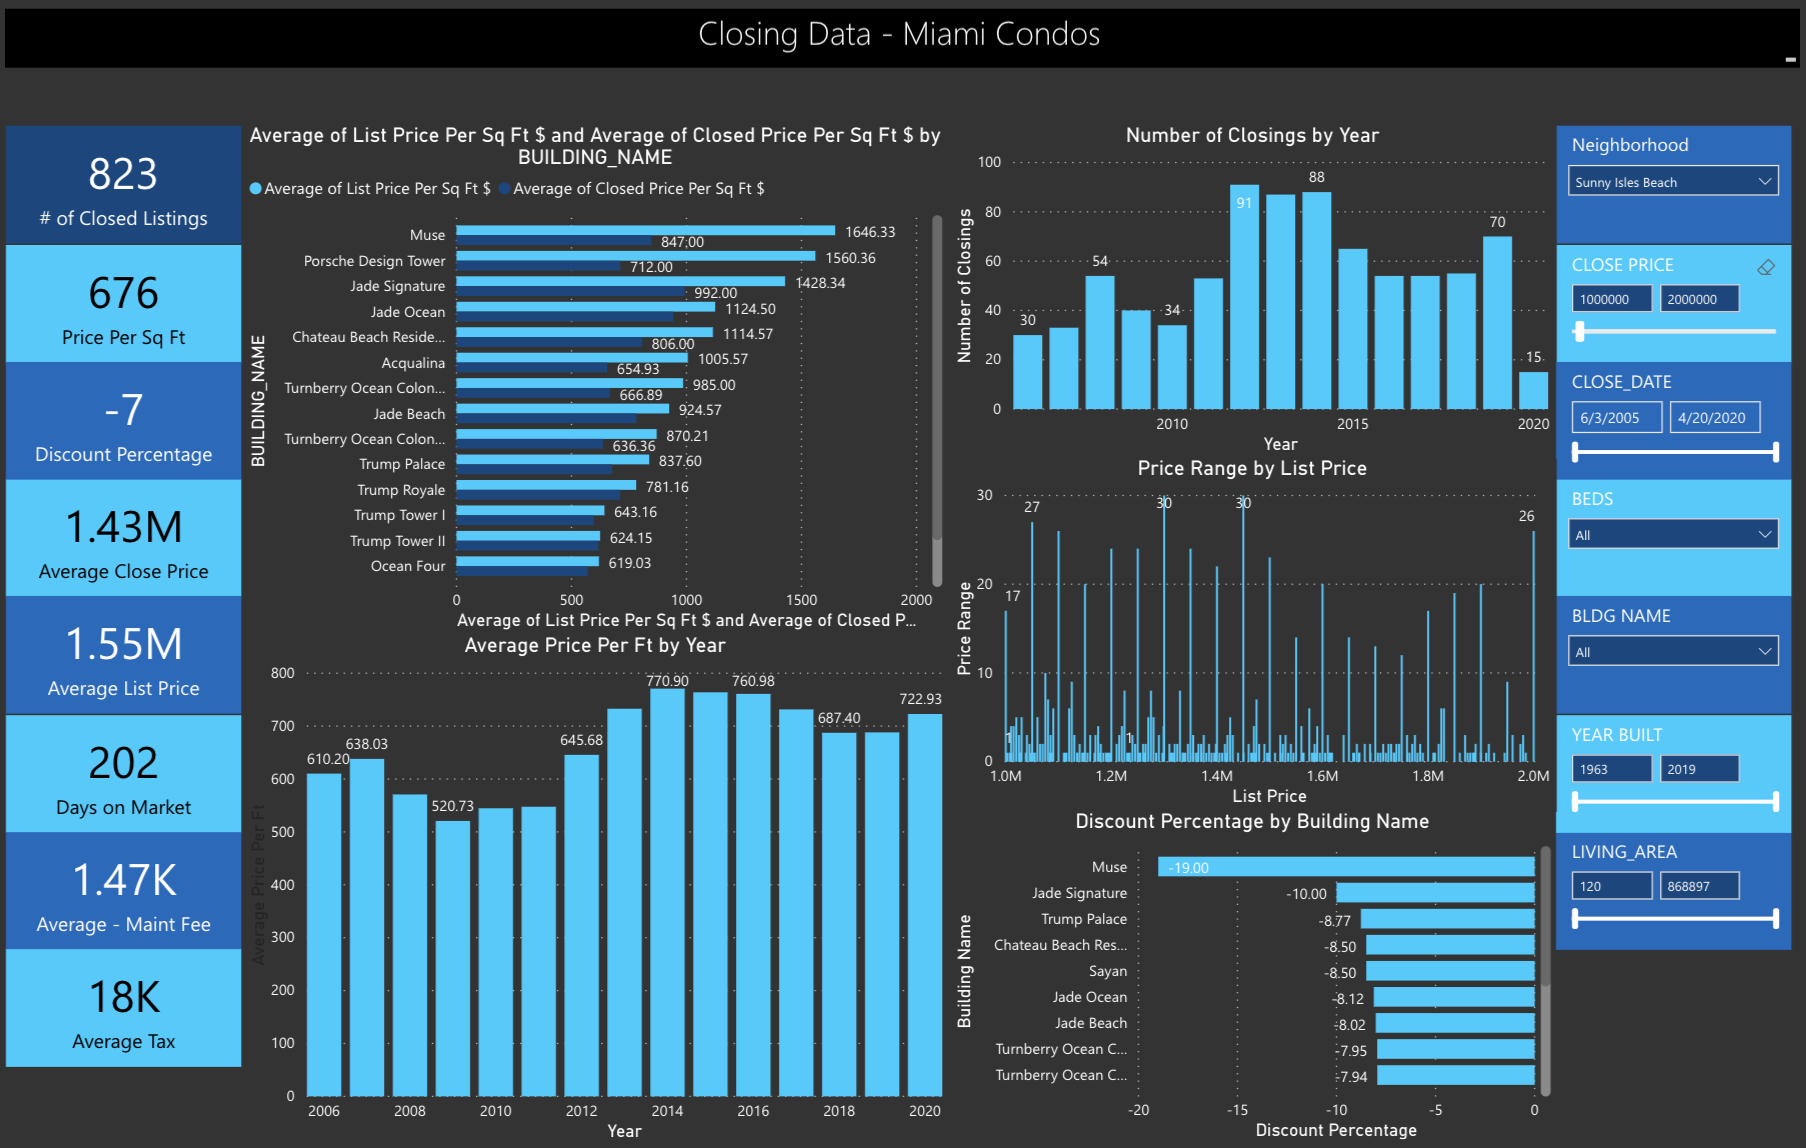
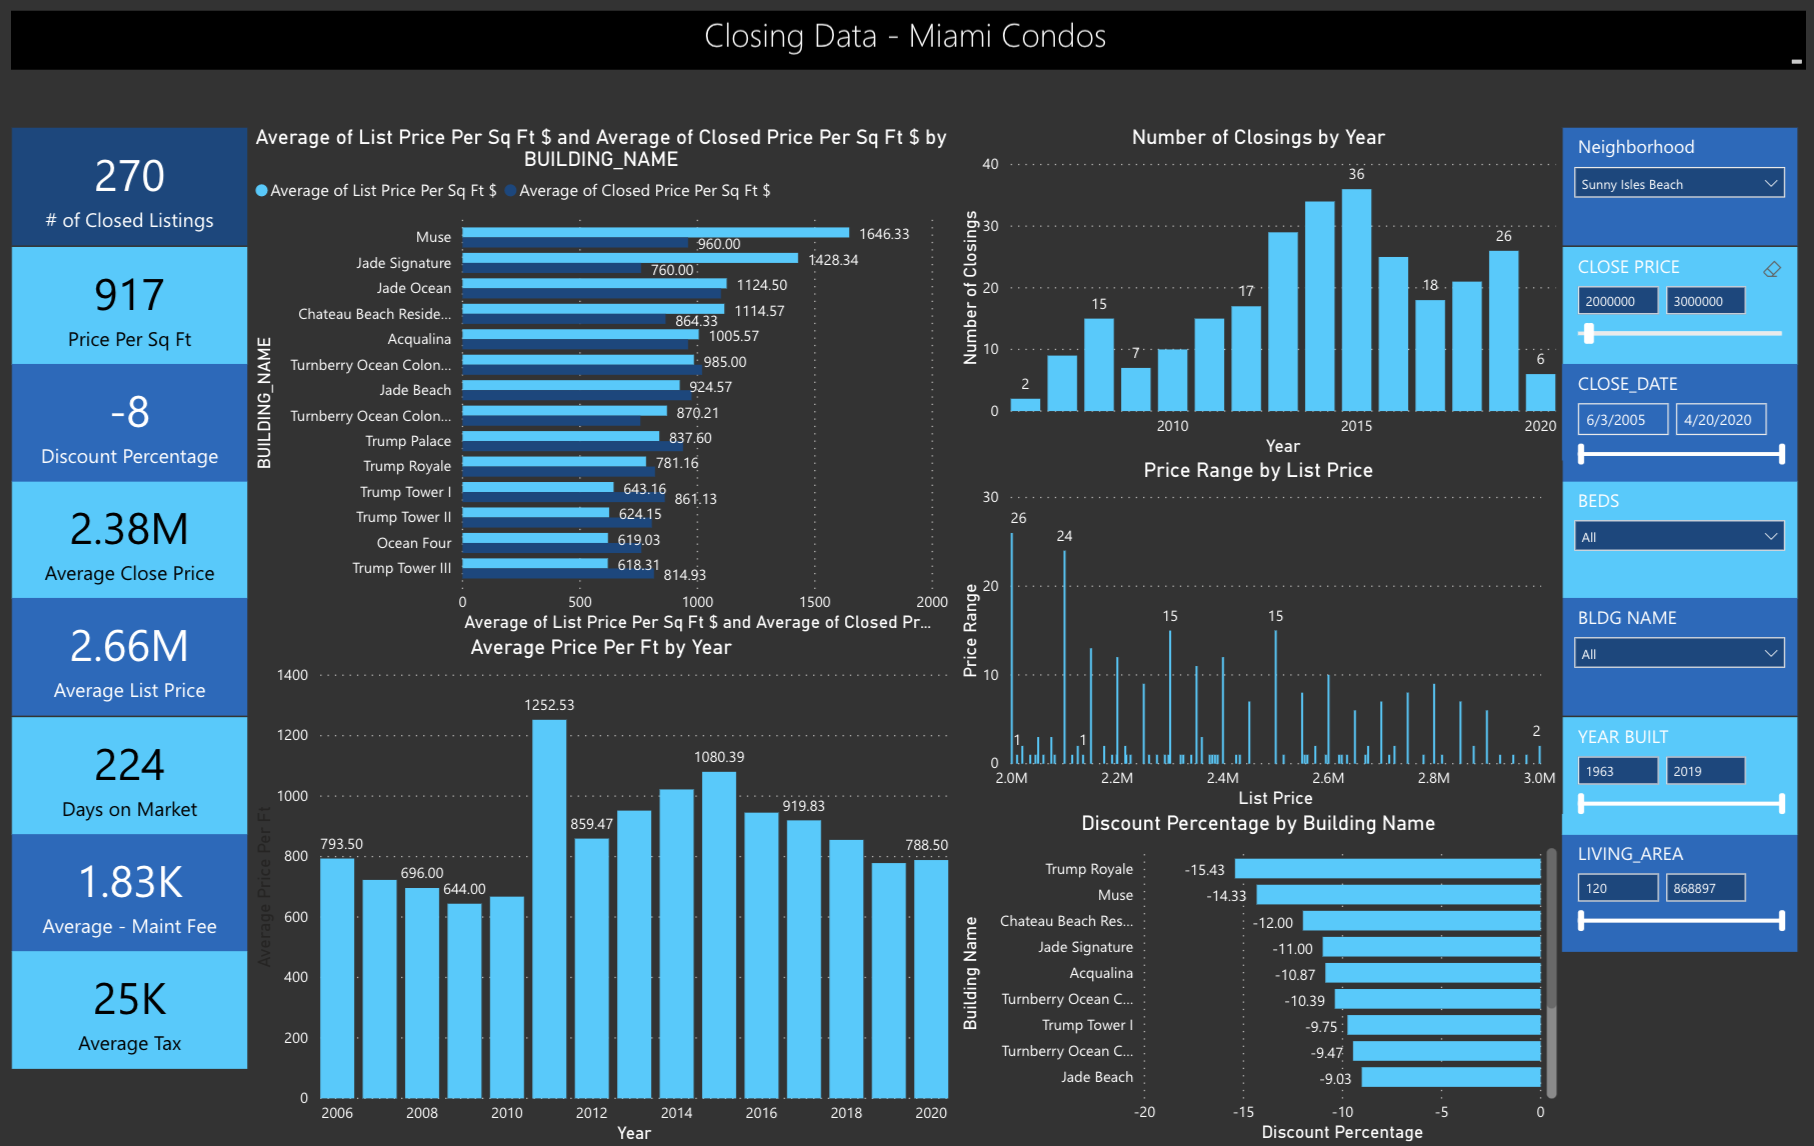
Sunny Isles Condos Q1 2020
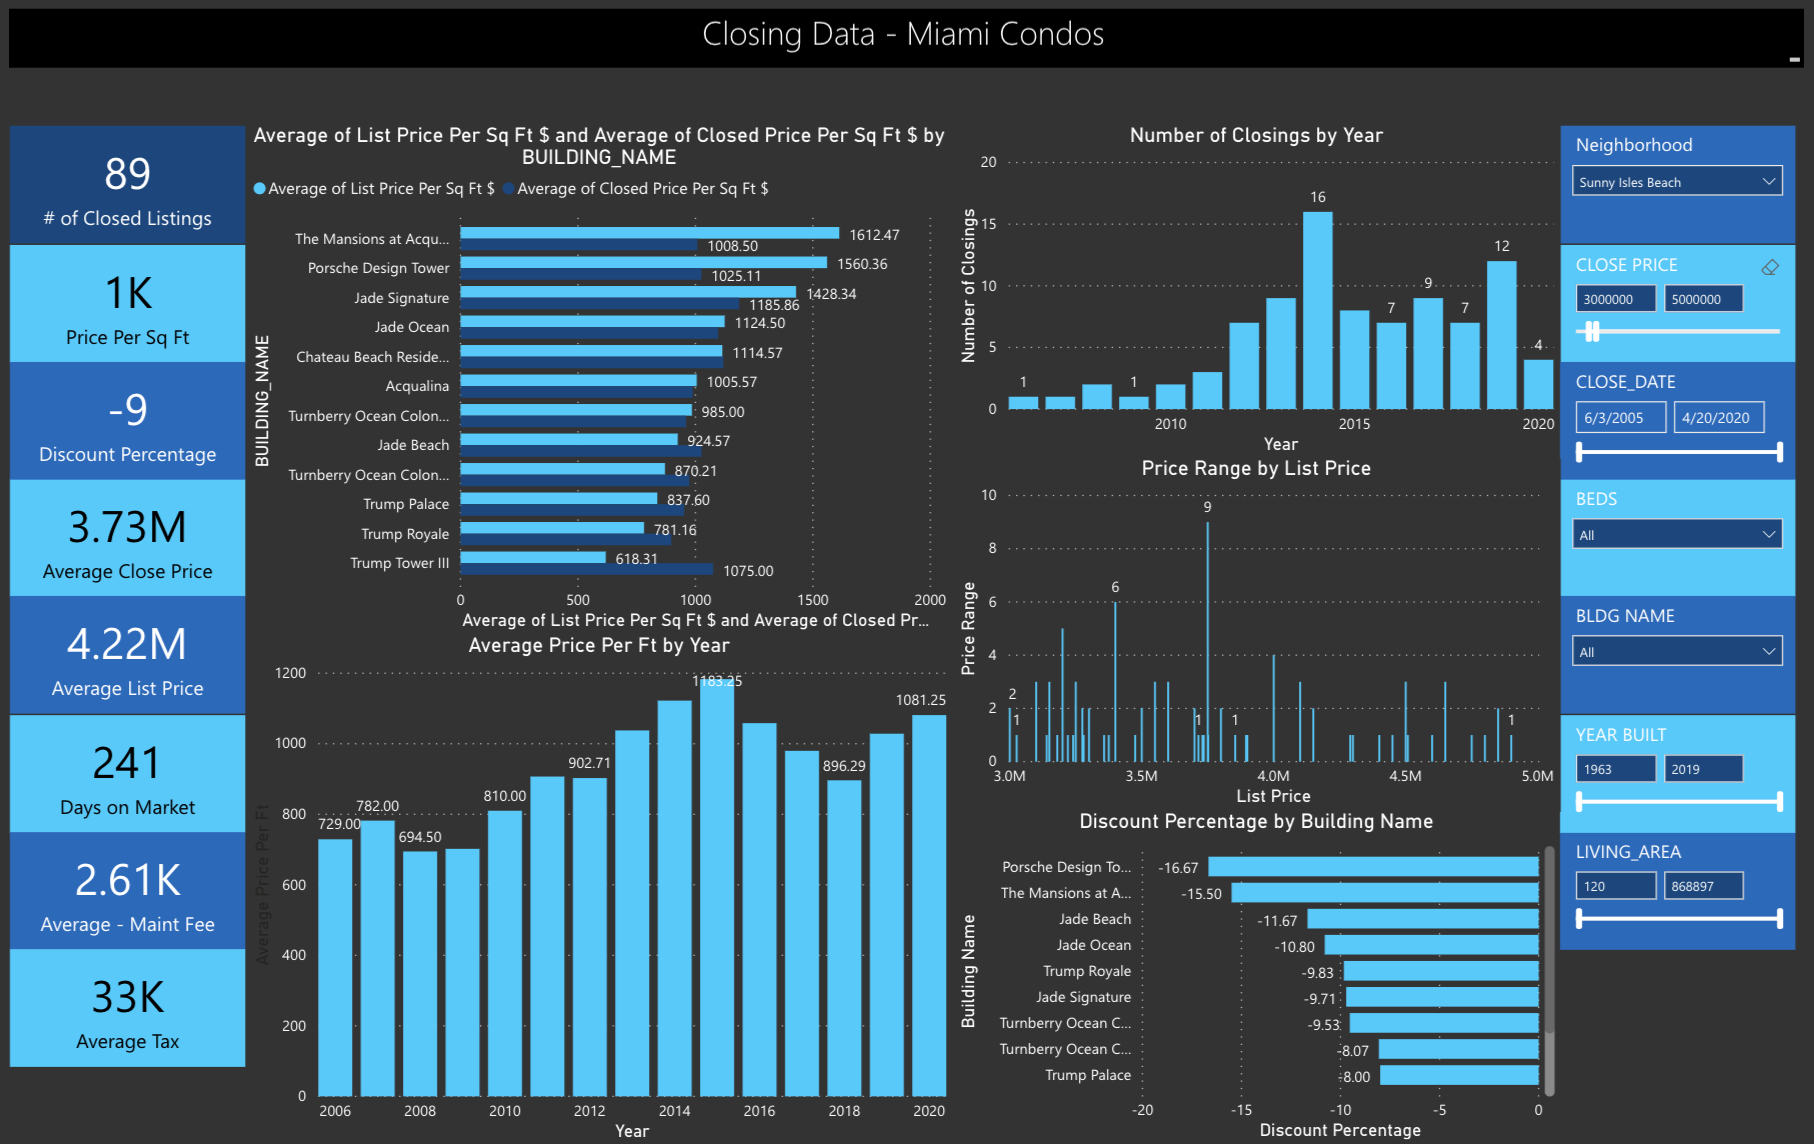
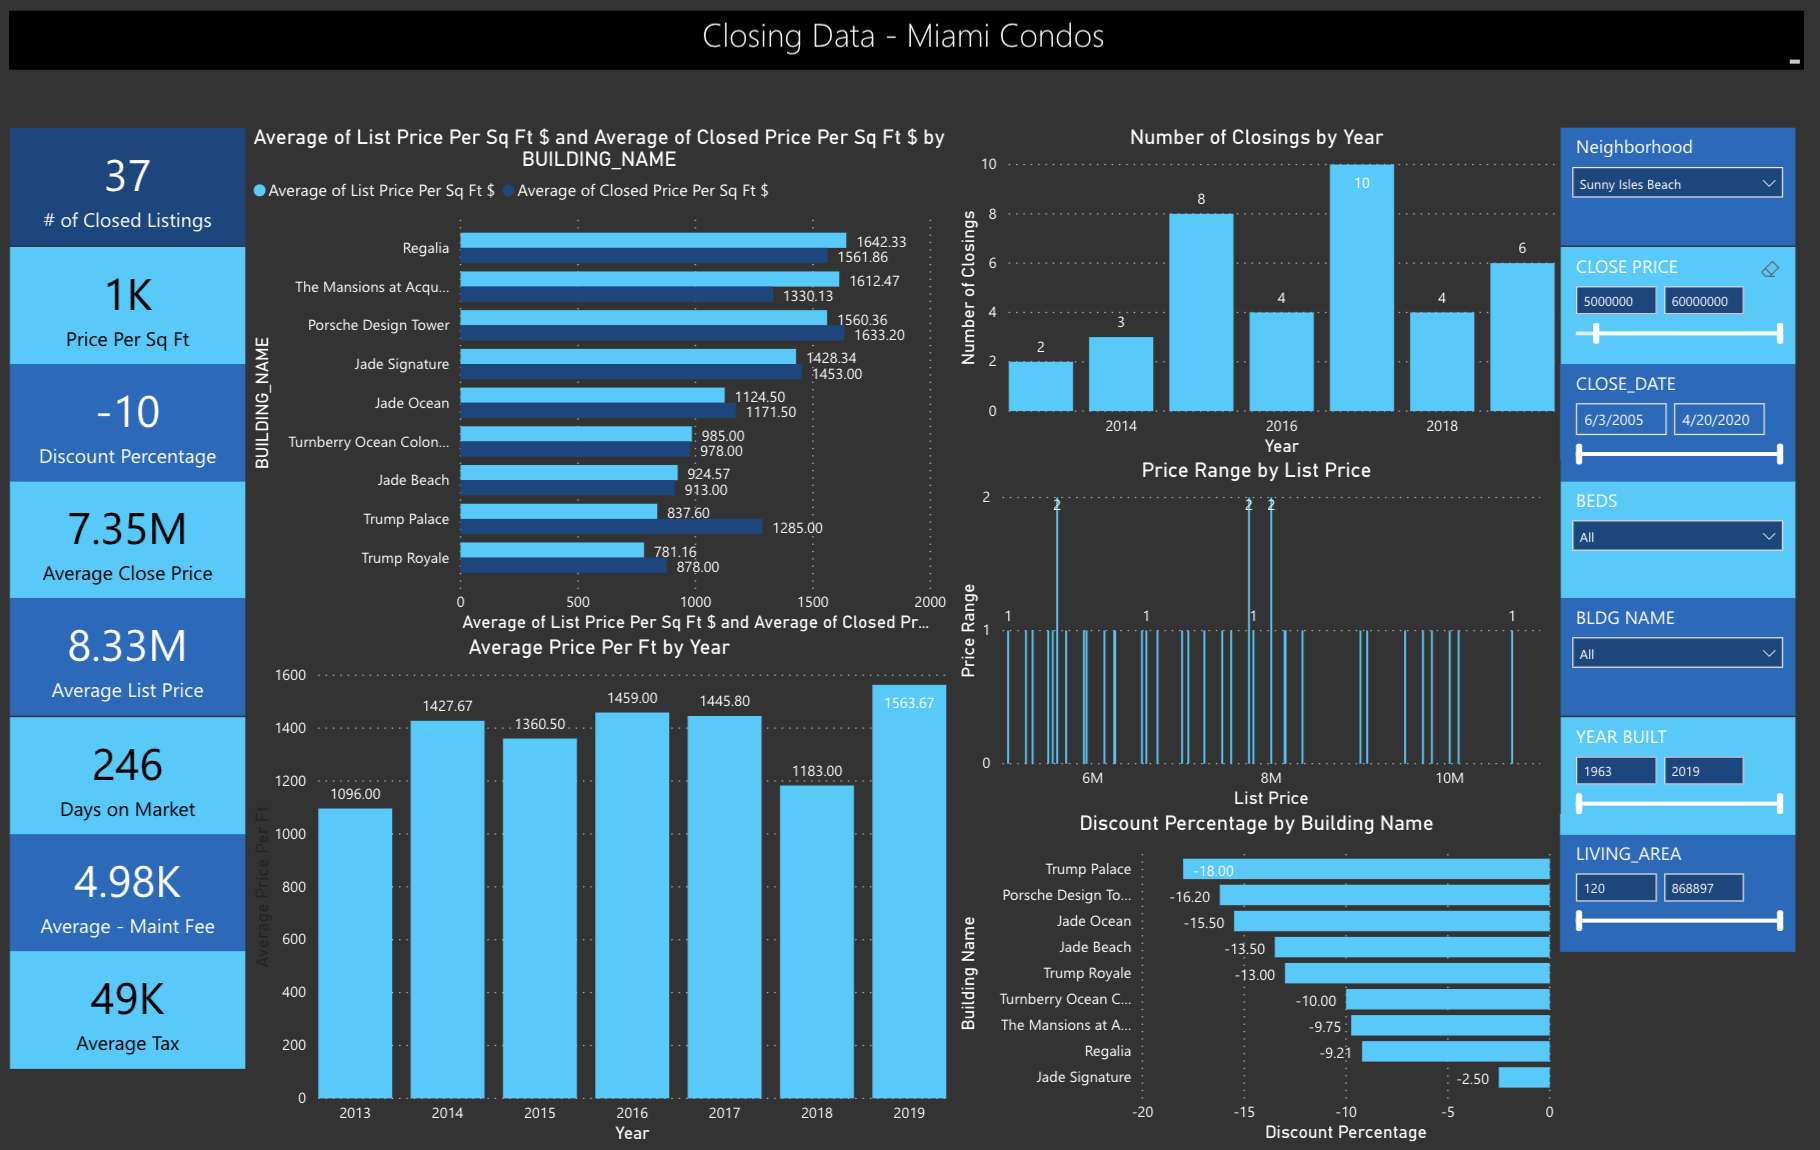
Sunny Isles has been correcting for the last couple of years, as each quarter has passed the prices have dropped further and condo resales have receded further back mid way between 2012 and 2013 prices. The more expensive the unit, the more severe the correction.
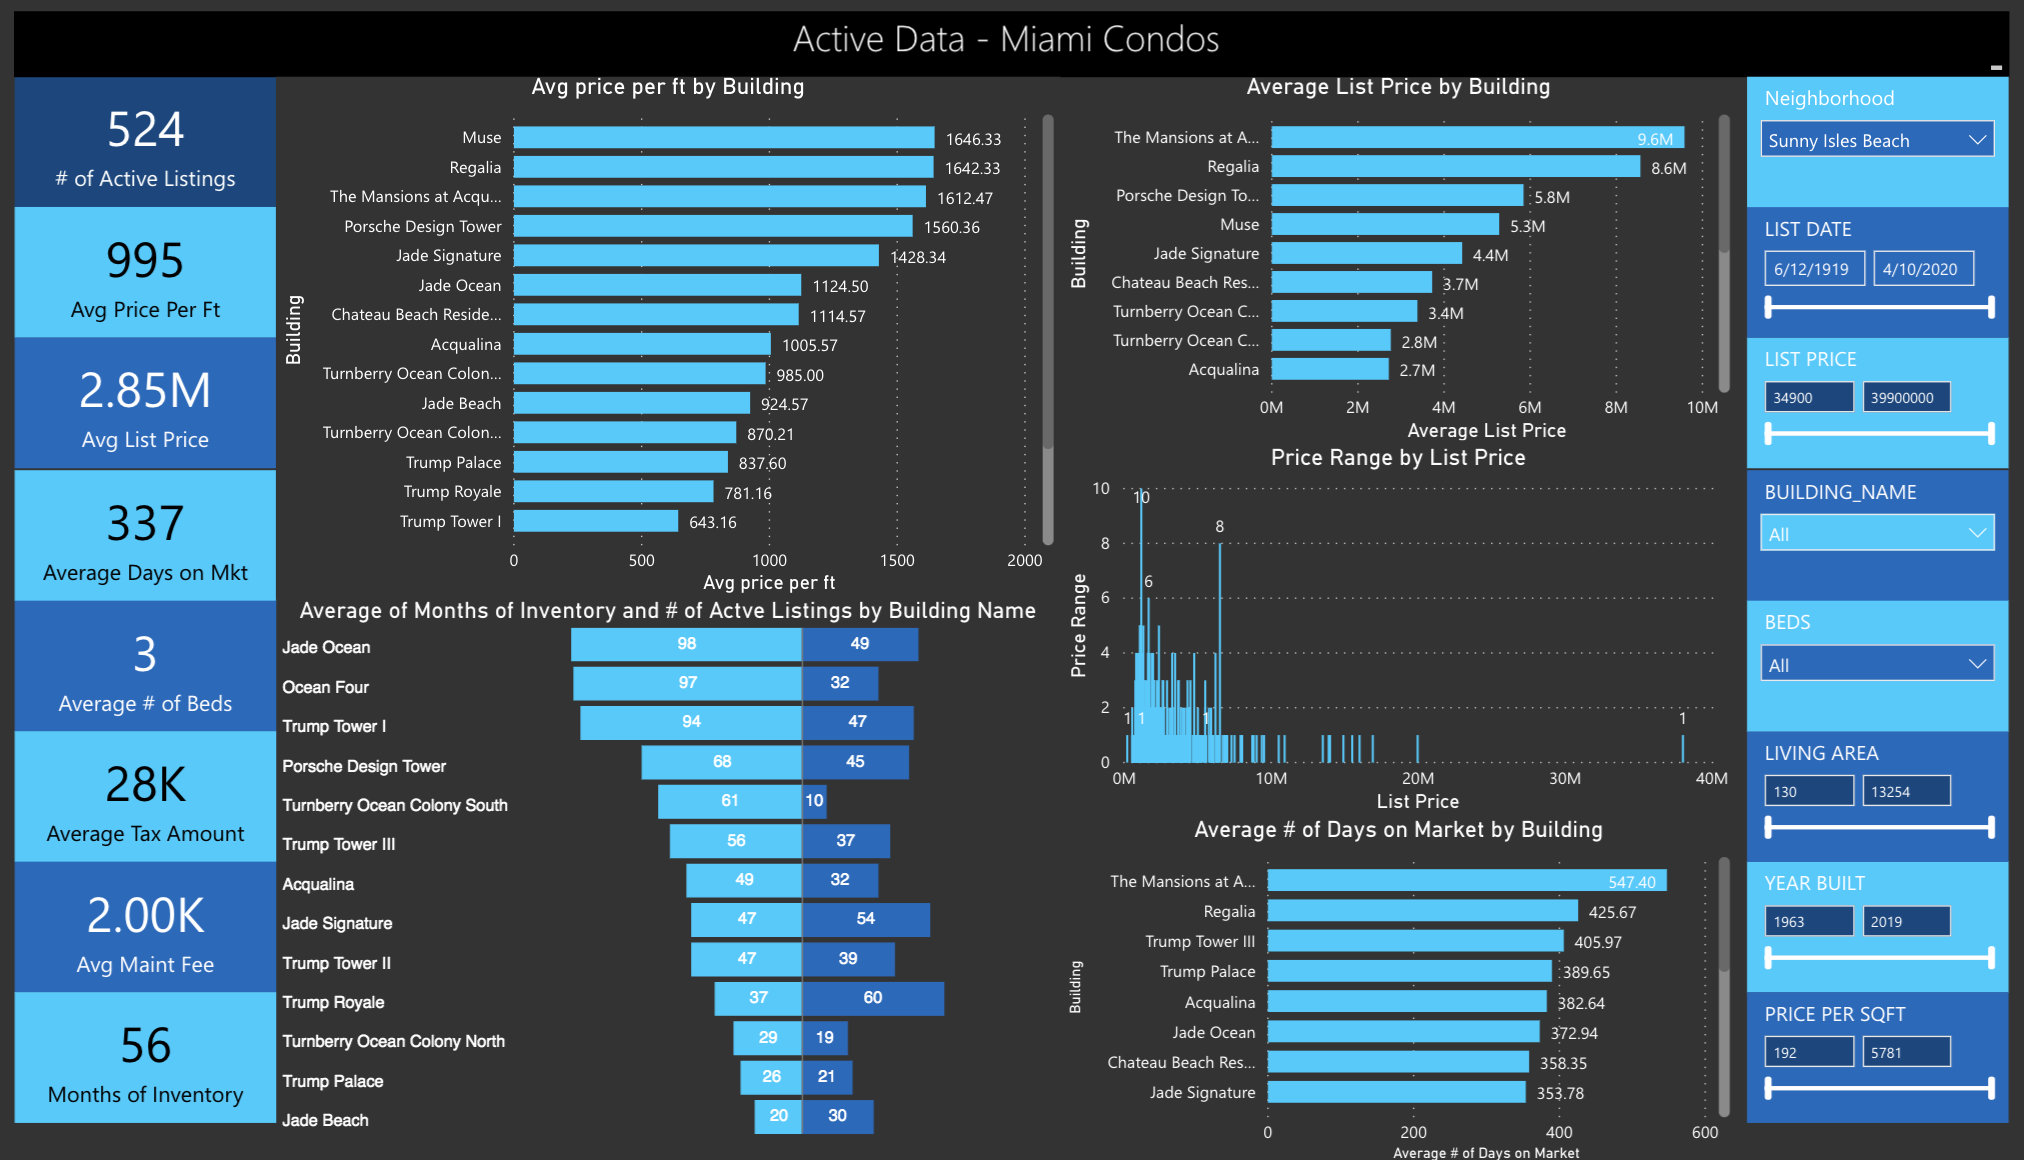
Jade Signature, Jade Ocean and Porsche lead the way as the top 3 most expensive condos, which have had sales in 2020. Inventory continues to mount across the neighborhood and sales are slow with an average time on the market for current listings of 337 days. Sunny isles is definitely one of the most vulnerable condo markets, but it now also offers some of the lowest prices for new and newer beach front condos in the whole of Miami. In Q1 2020 the average price per sqft sold for a condo that is dated from 2010 or newer broke in at $1,000 per sqft! Regalia, Porsche and Chateau Beach are running at massive discounts of 30% – 40% off their peaks!
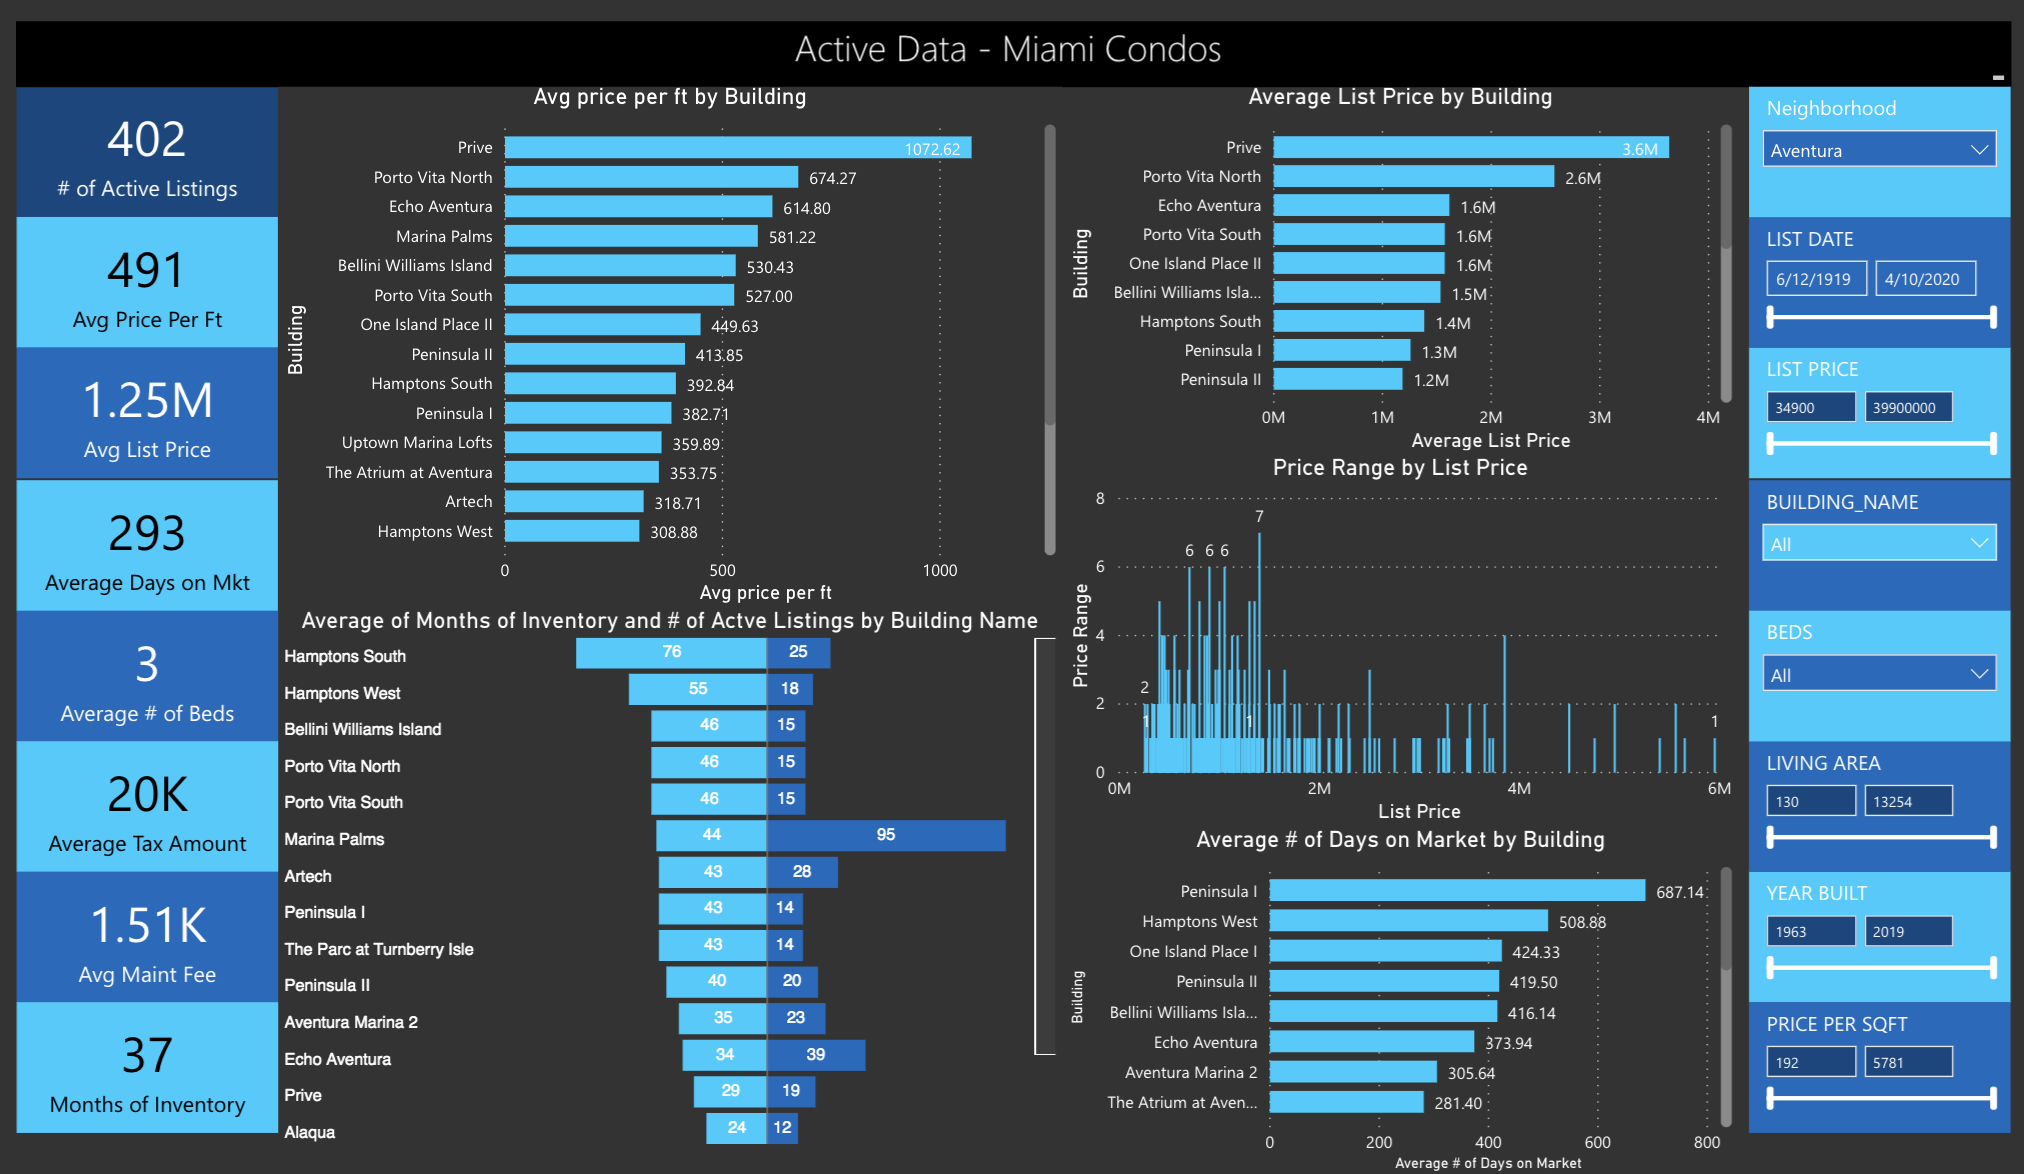
Aventura Condos Q1 2020
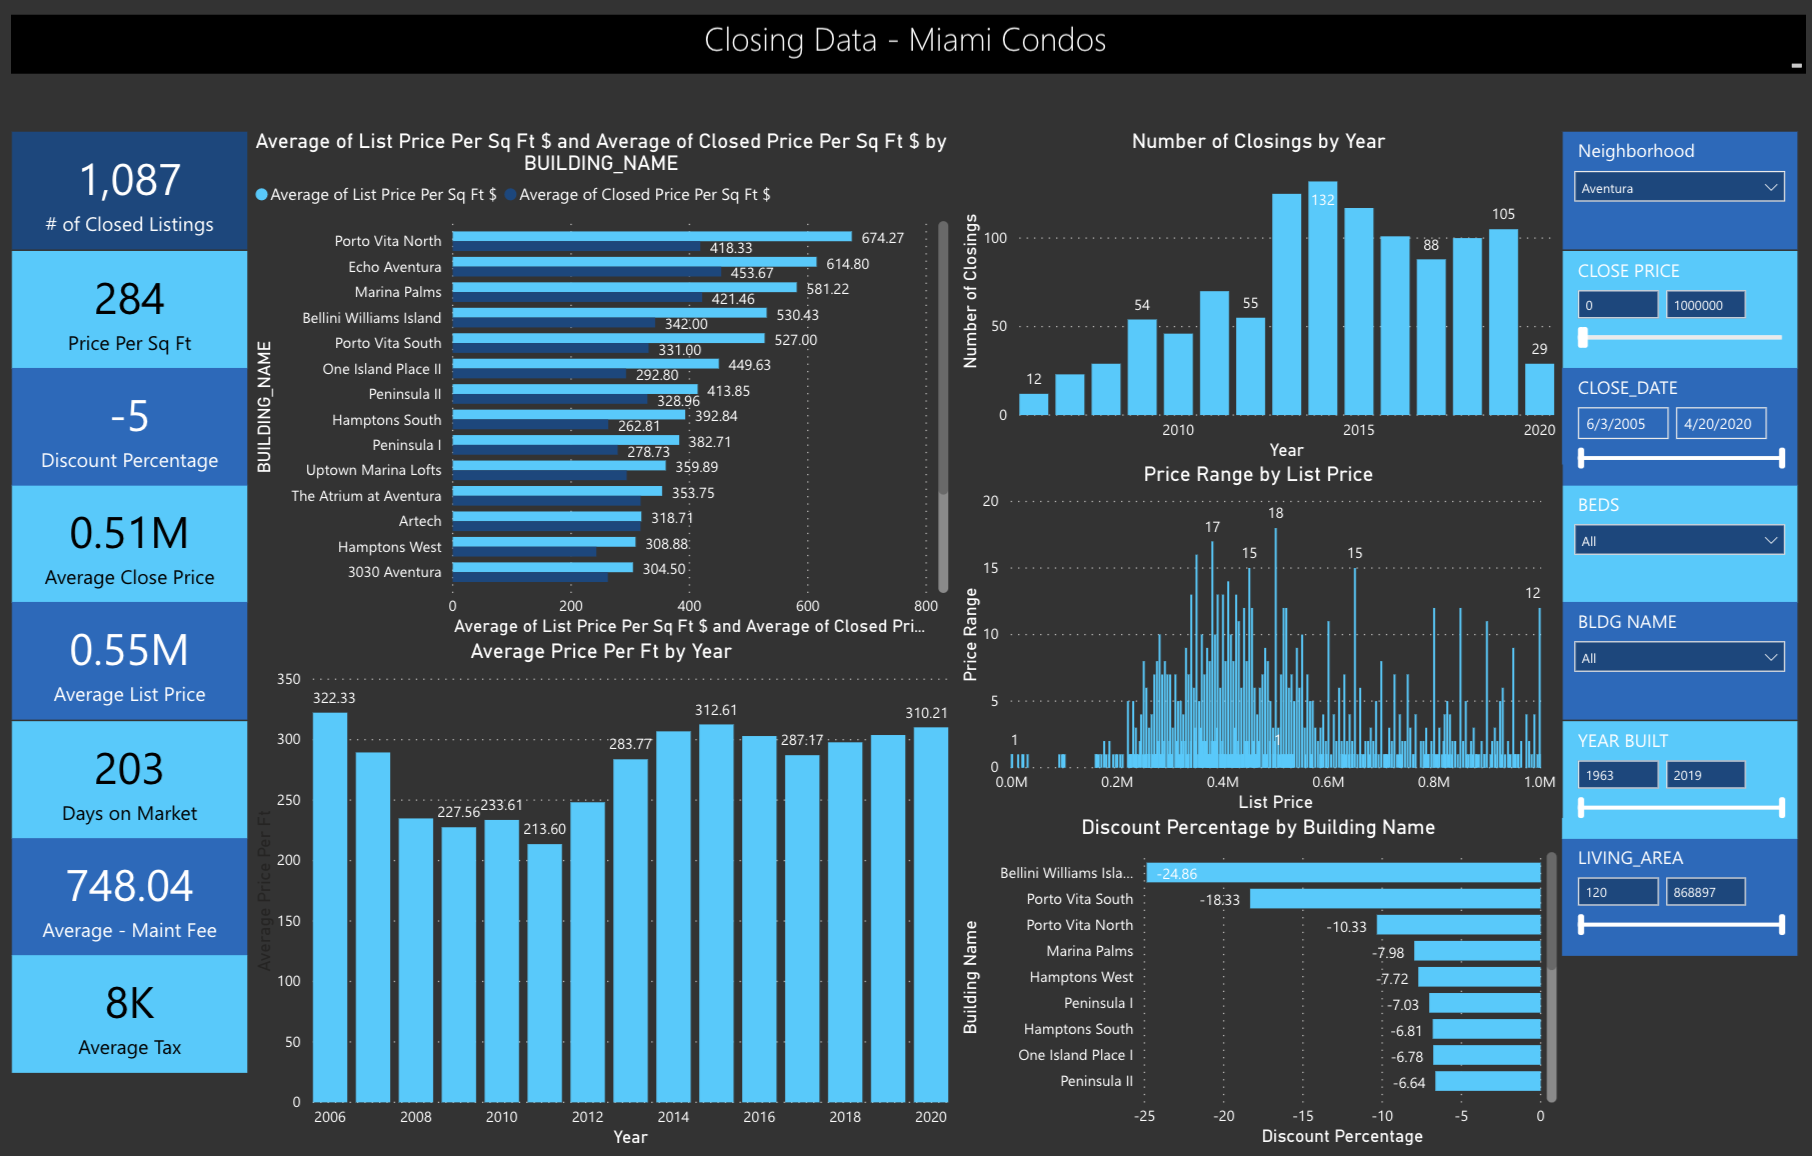
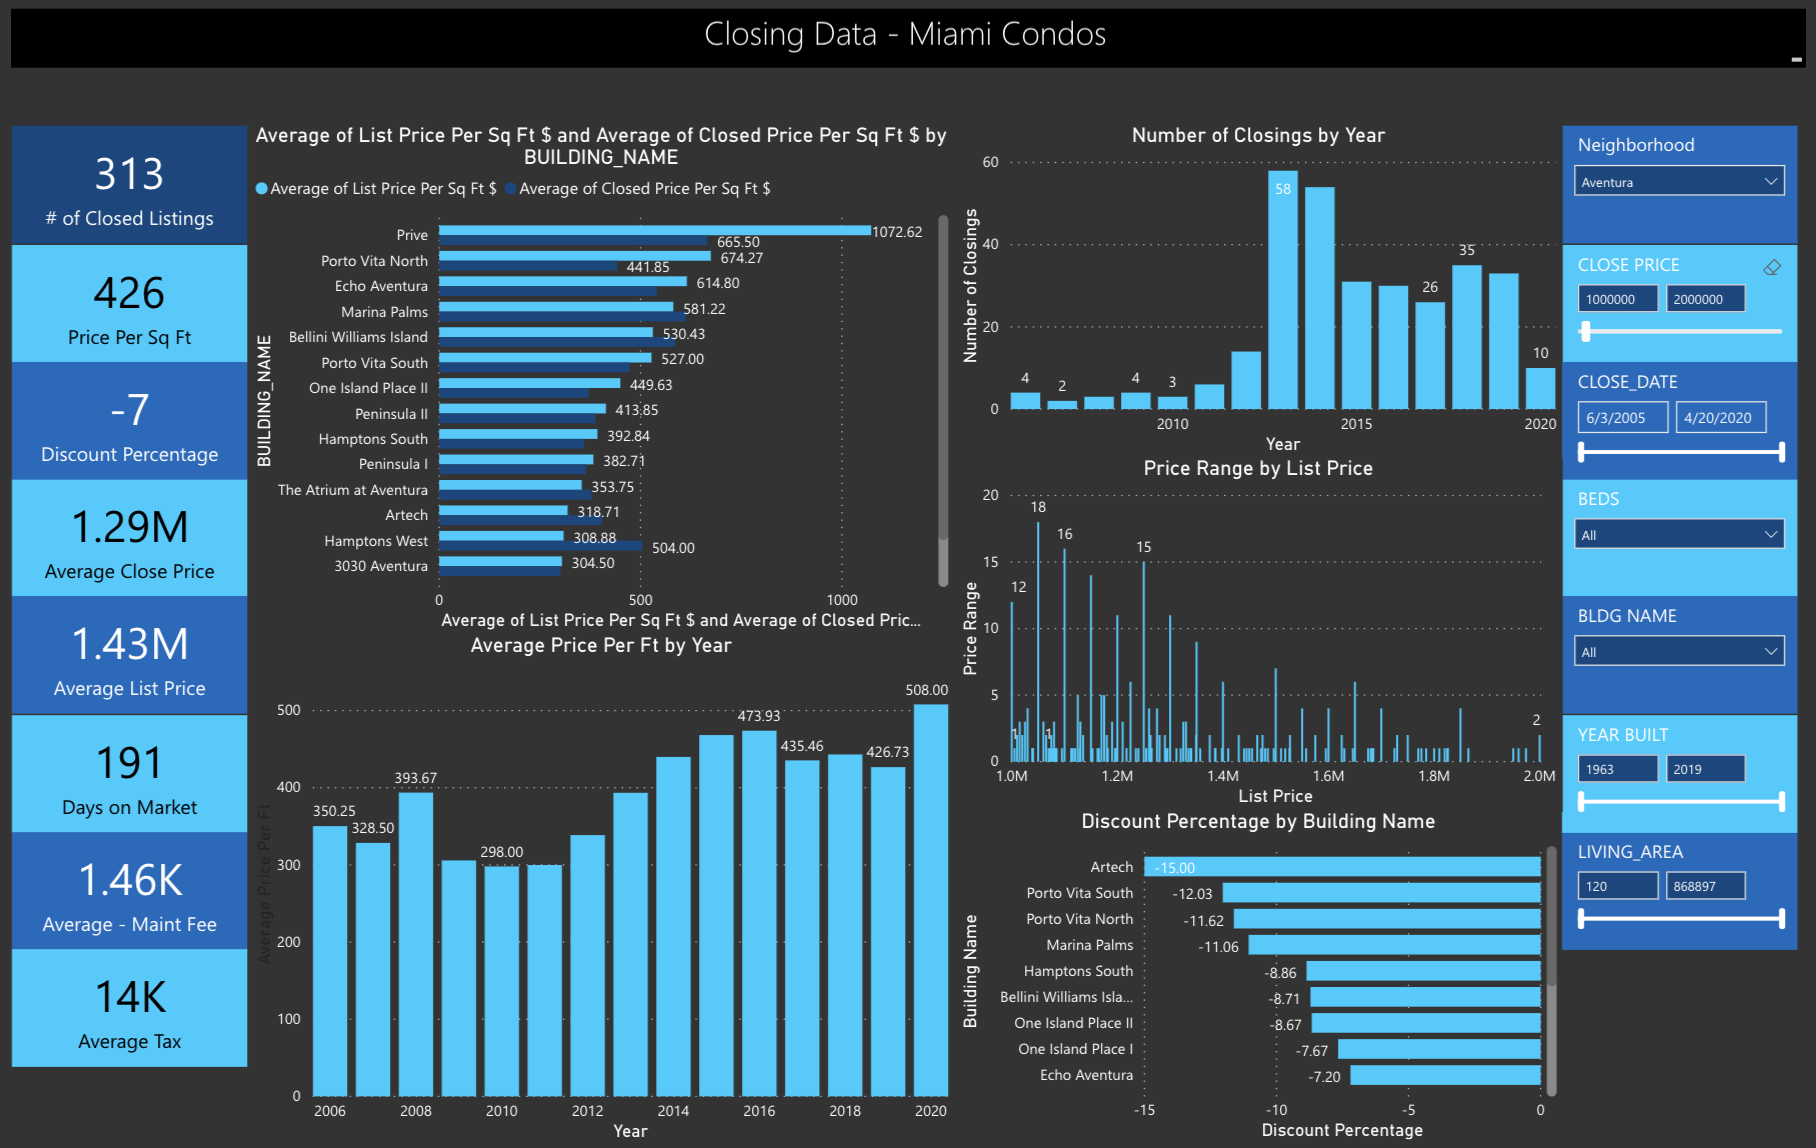
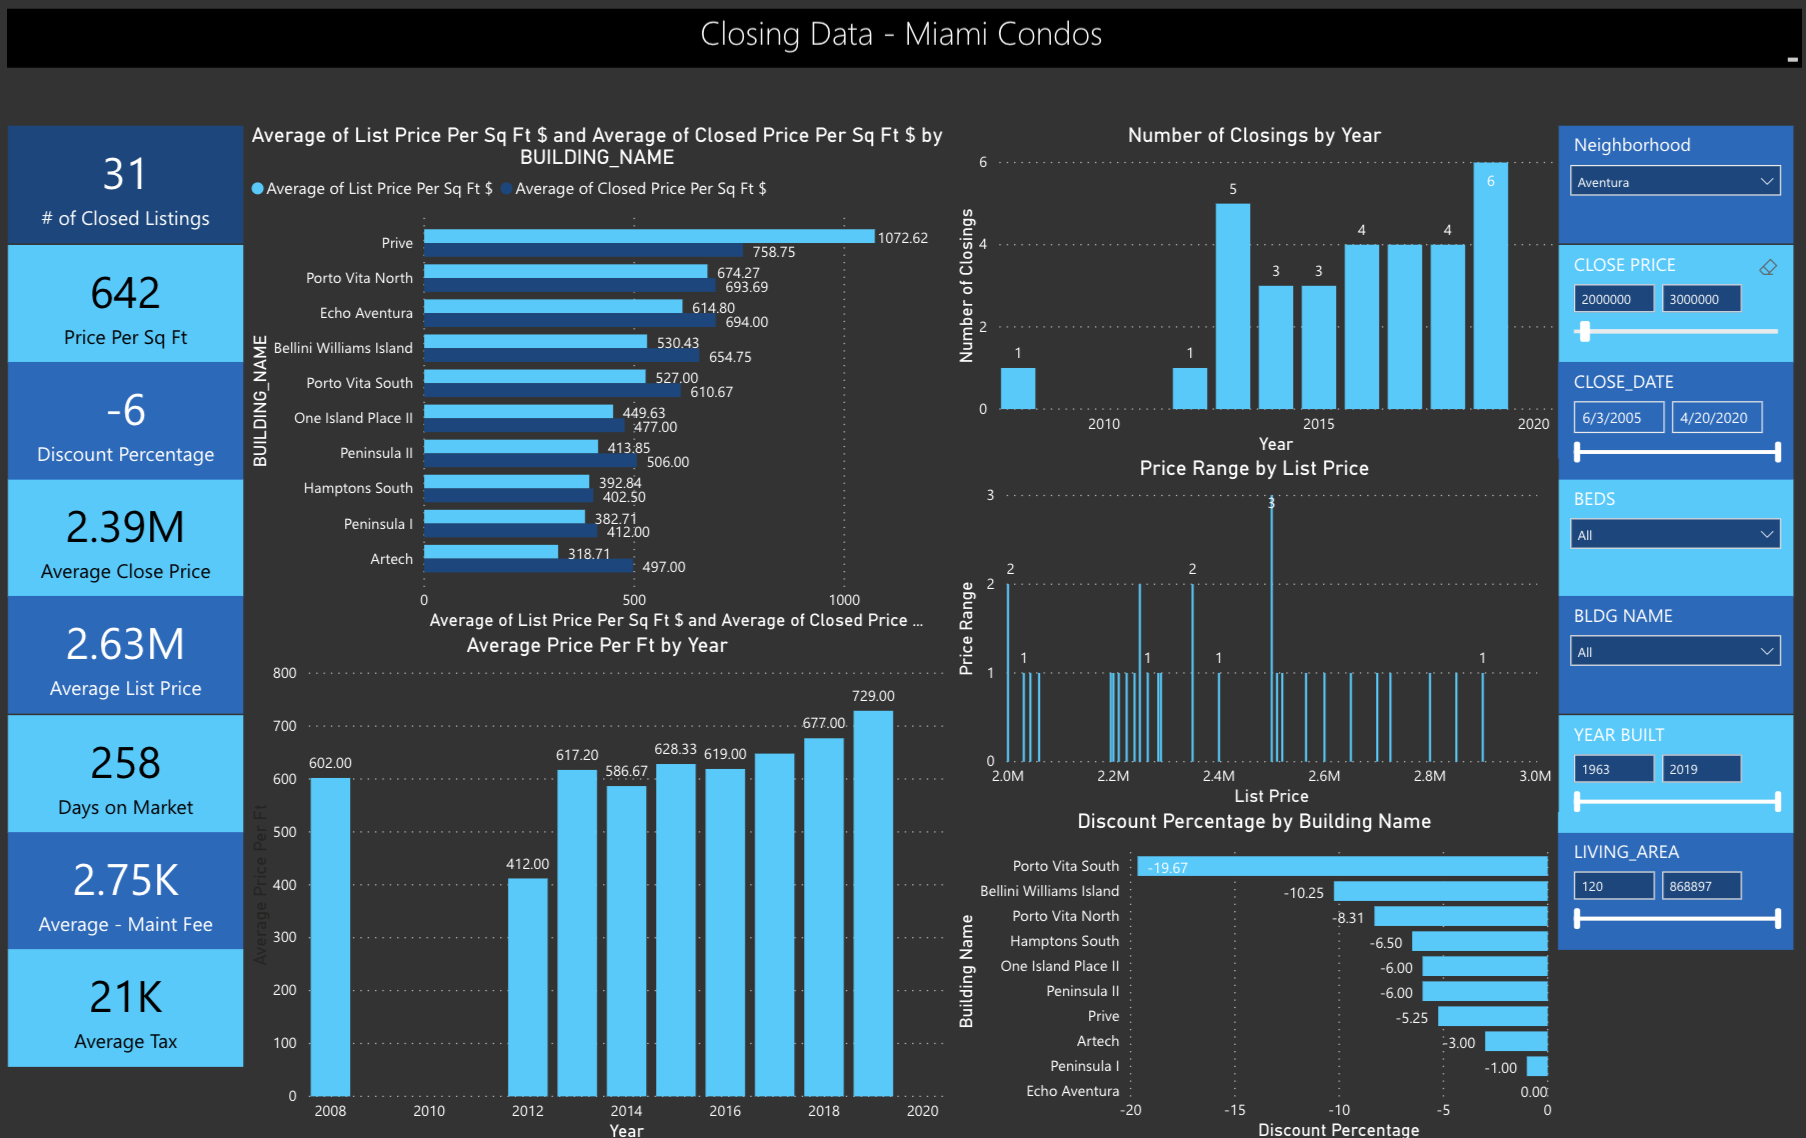
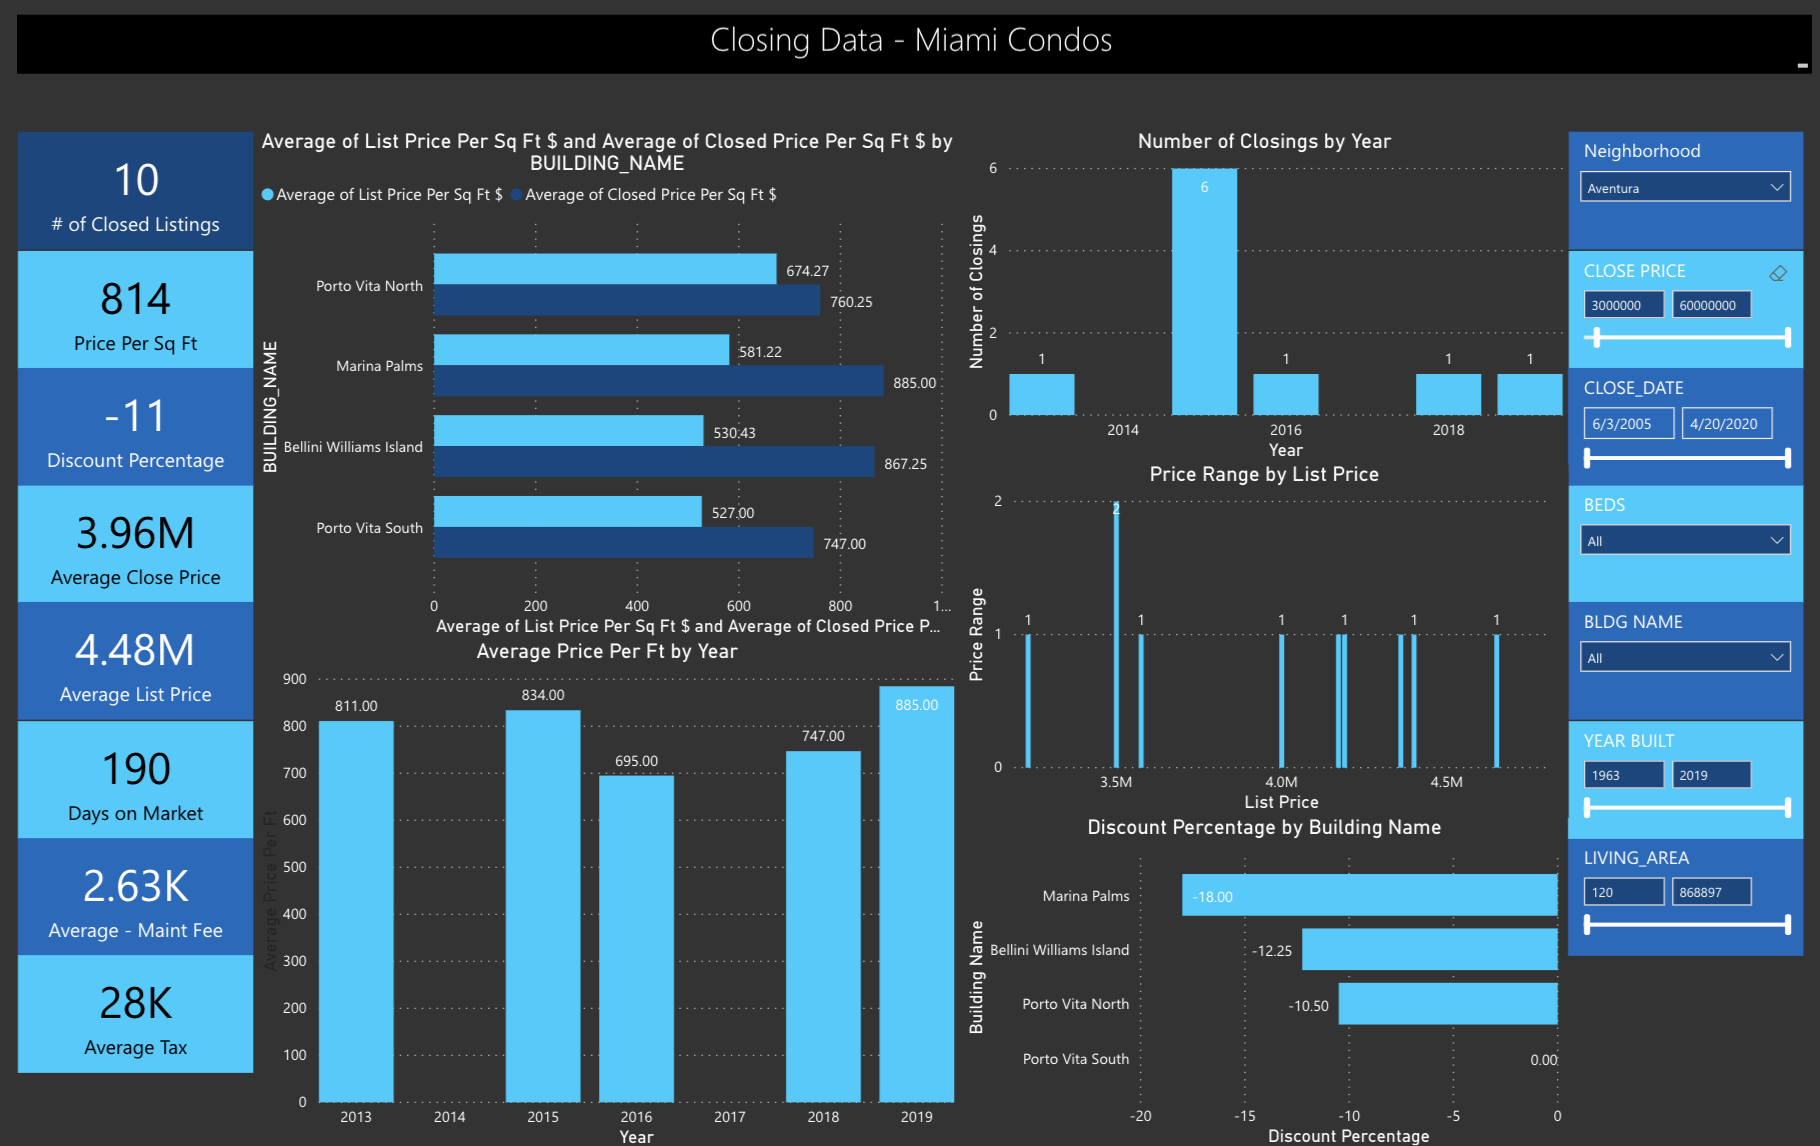
If Sunny Isles is the poster child for bargain basement condo beachfront deals then Aventura is certainly winning the prize for deals on the intracoastal waterways! Interestingly however Aventura sales have been picking up in 2020 with actually an improvement of around 5% in sales prices per sqft compared to 2019 across the 3 main condos that drive the luxury condo market here: Prive, Echo Aventura and Marina Palms.
FAQ
These are the most commonly asked Google Real Estate Related questions
1. What are the Current Best New Condos in Miami?
If you want to hear in more details our opinions on the best new Miami new construction condos. Please read this article:Best New Construction Condos 2022-2023.
2. What is the best New Construction Condo in Fort Lauderdale?
In our opinion, the Residences at Pier Sixty-six are certainly the most interesting and unique. Already well underway this 32 Acre project will be home to the first of its kind Marina where owners will be able to anchor up vessels up to a staggering 400 ft! For specifics of this project see our independent review of this project.
3. How can I compare the new luxury construction Condos to the best existing Luxury Condos in Miami?
Our Best Luxury Condos in Miami article will prove to be very useful to those looking to compare the existing to the new. You may also want to watch this video which shows the performance of the best Condos in Miami over the last 15 years!
Please fill in your details and David Siddons will contact you
- Get our Newsletter
- Subscribe
- No Thanks
Get the latest news from Miami Real Estate News
Edit Search
Recomend this to a friend, just enter their email below.
 COMPARE WITH CONDOGEEKS


