


- Best of All
- Best Miami Luxury Condos
- Most popular
- Relocating to Miami
- Private Schools
- Investments
- Gated communities
- Waterfront information
- Luxury homes
- Luxury Condos
- New Construction Condos in South Florida
- Independent Pre-Construction condo reviews for Miami
- Independent Pre-Construction condo reviews for Fort Lauderdale
The Q1 2020 Fort Lauderdale Real Estate Market Report | The Performance of each Fort Lauderdale Neighborhood in Q1 2020
Part 3: How did the top Fort Lauderdale Neighborhoods Perform in Q1 2020?
Welcome to Part 3 of the Fort Lauderdale Real Estate Luxury Report. In Part 3 we dive deeper into the Q1 sales performances of the luxury neighborhoods in Fort Lauderdale. We ask ourselves: How did every Fort Lauderdale Neighborhood Perform in Q1 2020? We provide snapshot market points for each of the six selected neighborhoods and overview commentary. We also look ahead to selling trends in Q2 and how Covid-19 is impacting sales. If you are unfamiliar with these Fort Lauderdale neighborhoods please enjoy our video tours.

How did every Fort Lauderdale Neighborhood Perform in Q1 2020?

Victoria Park in Q1 2020
Victoria Park | Steady Sales in Q1
The David Siddons Group has analyzed the Q1 2020 sales results for Victoria Park and found them to be similar when compared to last year. The neighborhood retains buyer appeal due to the location near every major lifestyle attraction in Fort Lauderdale. The immediate benefits of living in Victoria Park include A-rated public schools, location near Downtown Las Olas District, minutes to beaches, cultural centers and the beauty of the surrounding tree-lined avenues.
Victoria Park single-family home sales remained steady throughout Q1 2020 when compared with Q1 2019 (17 closed vs 19 closed in 2019). The price per square foot increased by 3% to $452 per SF and discounts averaged 2% off the list price. Currently in Victoria Park there are 53 Active listings priced between $475,000 – $4,500,000. It is important to note that 55% of the listings are priced under $1m. The sales activity for single family homes has dramatically dropped off in the 2nd Qtr of 2020 with only 3 closed sales and 4 pending. There are buyers for Victoria Park, but sales are shifting to another segment of the market.
All the action can be found in the Victoria Park Townhome Market. In Q1 2020 there were 20 townhome sales in Victoria Park, which averaged $270 per SF. The rate of sales was the same in Q1 2019. The difference is looking ahead into 2nd quarter sales where 6 townhomes have already closed and 19 are pending sale. What is driving the townhome market? Lower costs per square foot which are 40% less for a townhome versus a single-family home in Victoria Park. Simply put, you get more space for the same money. Townhomes cater to first time home buyers, investors and families looking to benefit from the area’s schools. Whichever type of home you are seeking (single family or townhome) there are multiple options to choose from in Victoria Park.
SNAPSHOT VICTORIA PARK:
- Sales price per square foot increased by 3% for Single Family Homes sold between $1-$2m.
- Single Family Homes sales remained steady Q1 2020 (17) vs Q1 2019 (19).
- Single Family Homes listed between $1 and$2m stayed 25% longer on the market (Days on Market average increased by 25% to 242).
- Townhomes Sales are stronger than Single Family Homes going into 2nd Qtr
- Q1 2020 Biggest Neighborhood Sale: F10206970 (Featured below)
Rio Vista in Q1 2020
Rio Vista| Low Inventory & Buyer Demand
Rio Vista made our list for Fort Lauderdale Top 3 Waterfront Neighborhoods in Q1 2020, refer to Part 1 of the Fort Lauderdale Real Estate Luxury Report. The continued success of waterfront sales in Rio Vista is related to the low level of waterfront inventory and buyer’s demand for Rio Vista. There are currently only 11 waterfront homes for sale in Rio Vista. What makes this neighborhood special? It “IS” a true neighborhood. The residents that call Rio Vista home are mostly long term, or legacy Fort Lauderdale families. The tie that binds is the natural beauty of the mature growth trees, beautiful waterway vistas, charming interconnecting bridges and the Lauderdale Yacht Club. This is a boating, fishing community and the club is where locals gather to share adventures of the sea and a rum punch (or 2).
In Q1 2020 the largest sale in Fort Lauderdale was a point lot home located in Rio Vista. The sale was $20,500,000 at $1,575 per SF. This sale is a testament to the popularity of Rio Vista. Waterfront home sales in Rio Vista accounted for 58% of the sales while the remainder were non-waterfront. Overall, 92% of all Rio Vista sales were $1m+. Waterfront homes averaged $1,036 per SF. Non-waterfront sales averaged $429 per SF. Looking forward into Q2…. sales are averaging down 50%, but sales are still occurring even in these difficult times. Since April 1st, 7 new active listings have come to market, 4 sales have closed and 5 are pending sale. The average discount since April 1st was only 3% and one sale closed at an increased price: 607 SE 6th Street closed 5% higher than list price. There are still buyers willing to buy. The current total of all listings both waterfront and non-waterfront is 45 homes.
There are two waterfront homes currently available in Rio Vista that distinguish themselves. One is set on an entire 1.4 acre point lot with enough protected dockage for a 200′ mega yacht. The other significant waterfront estate sits on almost 2 acres and can accommodate yachts of more than 100′ ft. Rio Vista is a yachtsman’s paradise.
The city of Fort Lauderdale has focused a lot of municipal funds on improving utilities in Rio Vista and increasing the seawall along Cordova Road. These necessary improvements and the reconstruction of the Lauderdale Yacht Club will add to the long term appeal of the already highly desired neighborhood of Rio Vista.
SNAPSHOT RIO VISTA
- Average days on market was 68 for all sales except of the point lot home, which was on the market 510 days.
- Available waterfront inventory is low so absorption rates are good.
- The City infrastructure improvements are underway.
- Q1 2020 Biggest Neighborhood Sale: F10143887 (Featured below)
Las Olas Isles in Q1 2020
Las Olas Isles | Best Buying Opportunities
Our data from the prime Ft Lauderdale waterfront neighborhoods indicates that Las Olas Isles is currently the waterfront market with the best buying opportunities. Las Olas Isles has the highest inventory levels of single-family waterfront homes for sale and had the slowest turnover rate of comparable waterfront markets. At the end of Q1 there were 127 single-family homes actively listed for sale. The average days on market for these listings was 229 days. This number will likely increase since there are overall only 6 pending sales.
In Q1 2020, 81% of the 16 properties that closed in Las Olas Isles reduced the listing price prior to receiving offers. The average discounts from original list price to closing was 13.9%. The neighborhood is prime for investors or buyers to negotiate the best deals. The most recent example is the point lot home on Sea Island, which sold for $5.5 million. The home was one of three parcels offered on the point. The average for point lots sold in Las Olas Isles is $14m. The purchase on Sea Island was an amazing deal.
Another factor contributing to the higher inventory in Las Olas Isles are overpriced older homes. There is a boon of new construction inventory coming to market. Currently 28% of the active listings in Las Olas Isles are newer construction (2015+) averaging $1,014 SF. New construction appeals to buyers and furthers the lack of interest in older properties. 72% Of homes for sale in Las Olas Isles were built prior to 2015. These active listings average $944 per SF. Reality check: in the past year, 42 homes built before 2015 sold in Las Olas Isles at an average of $586 per SF. This is 38% less than the current average of $944 per SF.
Recent activity recap since April 1st: 7 closed sales | 6 pending sales. Las Olas Isles is selling at 70% the normal average rate, which is higher than other prime waterfront neighborhoods.
SNAPSHOT LAS OLAS ISLES:
- 27 months of Inventory.
- Overpriced properties built before 2015, priced 38% higher than closed sale average.
- Average 229 Days on Market.
- Selling discounts averaged 14% after an initial price reduction.
- Currently selling at 70% the normal average
- Q1 2020 Biggest Neighborhood Sale: F10193181 (Featured below)
Coral Ridge in Q1 2020
Coral Ridge | Best Waterfront Value
Coral Ridge was the overall best performing neighborhood in Q1 2020 for both waterfront and non-waterfront properties, refer to Part 1 of our Fort Lauderdale Real Estate Report. Coral Ridge sales are being propelled by the low prices per square foot. Buyers want more for their money and they are achieving this goal in Coral Ridge. The neighborhood currently has an ideal balance of inventory to sales (7 to 8 month supply), increased prices would disrupt this balance. Coral Ridge sellers are advised to not increase pricing. The neighborhood has shown steady growth in keeping with buyer demand.
The waterfront single-family valuations for Q1 closed sales inched up to $477 per SF which is the lowest price per SF among similar waterfront neighborhoods. The average sales price for waterfront homes was $1,850,000 in Q1 with a selling range from $750,000 to $3,900,000. Non-waterfront average sales were $750,000 at $330 per SF with a range from $455,000 to $1,250,000. The appeal of Coral Ridge is not only a value proposition. The neighborhood is well located close to the beach with tree-lined streets and graciously sized lots. South Coral Ridge is assigned to the best elementary school in Ft Lauderdale, Bayview Elementary. For this reason, many families choose to live in Coral Ridge. Buyers that are seeking ultra-prime properties with valuations above $4m should consider other prime neighborhoods such as Las Olas Isles or Harbor Beach, which will offer more inventory selection above this price point.
Coral Ridge also has an active condo market. In Q1 2020 condominium sales averaged $360,000 at $258 per SF. The valuation slightly increased year over year for the same time period mirroring the results of single-family home sales in Coral Ridge. There is currently a 9 month supply of condo inventory, which is very healthy.
Looking forward at the effects of Covid-19, Coral Ridge single-family home sales from April 1st are down 56% from the same period in 2019: 11 closed sales | 13 pending sales | 20 new listings. Sales are still happening and with the good valuations in Coral Ridge we expect this neighborhood to recover quickly from the slowdown. Enjoy the neighborhood video, which will visually highlight the best aspects of living in Coral Ridge.
SNAPSHOT CORAL RIDGE
- The best Waterfront value in Coral ridge averages at 477 per SF
- Q1 Waterfront: 14 properties sold with an ideal 8 months on hand inventory
- Q1 Non-waterfront: 29 properties sold with an ideal 7 months on hand inventory
- Utility improvements continue in Coral Ridge.
- Q1 2020 Biggest Neighborhood Sale: F10168299 (Featured below)
Harbor Beach in Q1 2020
Harbor Beach | Ultra Prime Sales
Harbor Beach is considered an Ultra Prime waterfront neighborhood. The gated entry welcomes you to a neighborhood filled with deep water estates and mega yachts. This exclusive island enclave offers the most expensive real estate in Fort Lauderdale. It is home for many sport superstars and industry leaders. Harbor Beach is highly prized for deep water dockage, wide canals and quick access to the ocean inlet. To find out more about Harbor Beach watch our neighborhood video, which highlights key attributes of the resident lifestyle. Refer to Part 4 of our Fort Lauderdale Real Estate Report to see how Harbor Beach compares with the uber luxury waterfront neighborhoods found in Miami.
The sales in Q1 2020 averaged $5.2m ranging from $1,470,000 for non-waterfront to $10,900,000 for a waterfront estate. The average price per SF sold was $840, this is 25% less that the current listing average of $1,110 per square foot. Upon reviewing the active listings in Harbor Beach, 50% have reduced their prices. This indicates that listing are initially priced too aggressively. The result of over pricing leads to longer number of days on the market. Additional discounts are also taken from the final list price averaging 11% (of discount) with 323 days on the market. There were 8 sales in Q1 and it is important to point out that 50% of those sales were for new construction homes.
Looking forward into the second quarter at the effects of Covid-19 on Harbor Beach sales: 1425 E. Lake Dr Closed for $7,500,000 ($914 per SF) which was a 32% discount from the original list price of $10,999,999.
SNAPSHOT HARBOR BEACH
- The average price per square foot increased in Q1 2020 compared to Q1 2019 for Harbor Beach waterfront properties sold that were priced $2-$6m (+60%), $4-$6m (+13%), $6-$8m (+43%).
- The number of properties sold averages 1 to 2 per quarter in each price range so there are many variables that can impact the valuation results such as location near the point, year of construction etc. Request a personal property evaluation to learn about our pricing recommendations for your specific property.
- The Pier 66 Superyacht Village and further development will add to the luxury appeal of the Harbor Beach neighborhood. The Superyacht Village will be able to dock vessels up to 400′ in length.
- Q1 2020 Biggest Neighborhood Sale: F10192740 (Featured below)
Bay Colony in Q1 2020
Bay Colony | Boutique Luxury Waterfront
Welcome to the highly secure waterfront neighborhood of Bay Colony. This boutique enclave is comprised of a mere 110 single-family estate homes. Corporate Execs and CEO’s alike call Bay Colony home. It is only one of two guard-gated prime waterfront neighborhoods in Fort Lauderdale. Bay Colony is nestled next to the Intracoastal Waterway with wide, deep-water canals that provide quick and easy boating access.
The David Siddons Group selected Bay Colony as a Top 3 performing neighborhood in Q1. Bay Colony experienced high sales activity in the first quarter with 7 closings vs 1 sale in 2019. Buyers looking for value and security were able to find both in Bay Colony. The average of $500 per SF put Bay Colony as the 2nd most affordable prime waterfront neighborhood in Fort Lauderdale. The sales activity in Q1 represented a 77% sale through of the available inventory. Other owners encouraged by the success in the neighborhood listed their properties for sale. There are currently 10 active listings in Bay Colony. Refer to Part 1 of our Fort Lauderdale Real Estate Report for more on Bay Colony.
Taking a look ahead at sales during the second quarter; no new sales or pending sales have occurred. In 2019 there were 3 sales. The key to selling Bay Colony is value. With closed sales averaging at $500 per SF it makes sense that a listing priced $676 per SF would be on the market an extraordinary 1,577 days.
SNAPSHOT BAY COLONY
- The total number of waterfront homes sold in Q1 2020 was 6. This was an 600% increase of sales vs Q1 2019 (1 sold).
- There are currently only 10 active listings in this exclusive gated luxury neighborhood listed from $2.2m to $8.5m.
- In Q1 2020 four waterfront properties sold for more than $10,000,000 in Ft Lauderdale . One of these sales was in Bay Colony. It sold for $11,500,000.
- Q1 2020 Biggest Neighborhood Sale: F10184386 (Featured below)
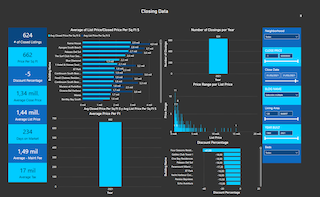
The Neighborhoods in Numbers
FAQ
These are the most commonly Miami Real Estate Related questions
What should relocation buyers know before buying real estate in Miami?
HOME BUYERS
Relocation buyers looking at homes in Miami should understand that choosing the right house is less about the property itself and more about location, schools, and long-term value. Many buyers make the mistake of focusing on price or finishes, while the real driver of value is the neighborhood and micro-location. Older homes often represent better value, but may also be part of a future redevelopment cycle. Newer homes command premiums, but don’t always sell faster if pricing is ahead of the market. Commute time, school access, and community dynamics are critical and often underestimated. The key is to evaluate homes not just as lifestyle purchases, but as long-term assets within a very localized market.
Sources:
https://luxlifemiamiblog.com/relocating-to-miami/
https://luxlifemiamiblog.com/relocating-to-miami-with-a-family/
CONDO BUYERS:
Relocation buyers should understand that Miami is a highly segmented, building-driven market, not a uniform one. Pricing can vary significantly between similar properties depending on building quality, layout, and financial health. Many buyers assume newer construction equals better investment, but that is often not the case. Factors like HOA fees, reserves, and rental policies can materially impact long-term value and liquidity. Negotiation opportunities often exist, especially in slower segments, but require precise market knowledge. The key is to evaluate micro-markets and individual buildings, not just neighborhoods or price per square foot.
Sources:
https://luxlifemiamiblog.com/miami-real-estate-market-report/
https://luxlifemiamiblog.com/new-construction-miami-guide/
What are the best areas for relocating families with children
For families relocating to Miami with young children, the most recommended neighborhoods are Coral Gables, Coconut Grove, and Pinecrest. Coral Gables offers the best balance of top schools, safety, and long-term value. Coconut Grove is ideal for younger families seeking walkability, greenery, and a lifestyle-driven environment. Pinecrest provides larger homes, excellent schools, and better value for space, making it ideal for growing families. The key driver across all three is access to strong schools and primary residential stability. Relocation decisions are less about new construction and more about long-term livability and resale strength.
Sources:
https://luxlifemiamiblog.com/best-neighborhoods-miami/
https://luxlifemiamiblog.com/what-are-the-best-family-neighborhoods-in-miami-in-2023/
Are new construction condos in Miami a good investment?
New construction condos in Miami can be a good investment—but only if you understand that not all buildings perform the same. According to the David Siddons Group, many buyers assume “new = better,” but in reality, performance depends on pricing, layout, building quality, and long-term demand. Some new developments set future price benchmarks and can drive long-term appreciation, especially in top-tier projects. However, many are priced aggressively at launch, and buyers relying on marketing instead of data often overpay.
The market is highly segmented, meaning two new buildings next to each other can perform very differently.
The best opportunities typically come from selecting the right building early or negotiating correctly in later phases.
In short: new construction is not automatically a good investment—it becomes one only with building-level analysis and disciplined entry pricing.
Sources:
https://luxlifemiamiblog.com/how-to-buy-a-luxury-condo-in-miami/
https://luxlifemiamiblog.com/category/independent-new-construction-condo-reviews/
https://luxlifemiamiblog.com/beyond-clickbait-real-insights-into-miamis-luxury-condo-market/
Why is buying a Miami condo riskier than buyers think?
Buying a Miami condo is often riskier than buyers expect because the true risks are at the building level—not visible in the listing price. Many buyers focus on finishes and views, while overlooking HOA reserves, insurance exposure, and potential special assessments. In reality, two identical units in different buildings can perform completely differently over time. Rising HOA fees and stricter regulations are also increasing the true cost of ownership, especially in older buildings. Liquidity can be affected by factors like financial health, rental policies, and ongoing repairs. The key risk is not the condo itself—but buying into the wrong building without proper due diligence.
Sources:
https://luxlifemiamiblog.com/how-to-buy-a-luxury-condo-in-miami/
https://luxlifemiamiblog.com/miami-condo-market-risks/
What are Miami's Safest Areas?
Which Miami Areas Still offer Great Value (Budget Friendly alternatives to Coral Gables and Pinecrest)
If you’re looking for better value than Coral Gables or Pinecrest, the answer (in true Siddons style) is not “go cheaper”—it’s go one layer outside the obvious markets.
The strongest value plays are:
- Schenley Park → closest substitute to Coral Gables at ~20% discount while maintaining similar character and location
- Biltmore Heights → almost identical feel to the Gables but ~25–30% cheaper on a $/SF basis
- Glenvar Heights → central location with larger lots and ~25% pricing advantage vs South Miami/Gables
- Baptist / Galloway (Kendall) → Pinecrest-style living (space, schools, land) at up to ~30% lower pricing
The pattern is consistent:
👉 Buyers are shifting west and slightly off-market to gain land, scale, and pricing efficiency. You don’t find value by going to a “cheaper neighborhood”—you find it by identifying adjacent micro-markets that offer the same lifestyle fundamentals without the brand premium.
Sources:
https://luxlifemiamiblog.com/best-value-neighborhoods-miami/
https://luxlifemiamiblog.com/category/miami-neighborhoods/
Is NOW a good time to buy in Miami?
Are Miami real estate prices going down in 2026?
No—but that’s the wrong way to look at it. Miami is not one market anymore, so prices are not moving in one direction. In 2026, the market is split into two: ultra-luxury, scarcity-driven areas (like waterfront and top-tier neighborhoods) are still holding or even rising, while mid-tier condos and oversupplied segments are flat or correcting. What we’re seeing is price divergence, not a crash—some properties are gaining value while others are quietly adjusting downward. Rising inventory and more selective buyers are putting pressure on pricing in certain segments, especially older condos or buildings with weaker fundamentals.
At the same time, global wealth and cash buyers continue to support pricing at the top end of the market. So the real answer: prices aren’t broadly dropping—they’re being repriced based on quality, location, and supply.
Should I buy a house or a condo when relocating to Miami?
The decision comes down to lifestyle first, investment second—and most relocation buyers get that backwards. If you want space, privacy, schools, and long-term family living, a single-family home in areas like Coral Gables or Coconut Grove is typically the stronger choice. If you prioritize walkability, low maintenance, and proximity to business districts, a condo in Brickell or waterfront markets makes more sense.
From an investment perspective, homes tend to be more stable, while condos are more building-dependent and cyclical. Most relocation clients underestimate how much building quality, HOA structure, and future costs impact condo performance. The right answer isn’t “house vs condo”—it’s which asset fits your lifestyle AND holds value within its micro-market.
How do I choose the right Miami neighborhood for my lifestyle?
Why are Miami condo prices so different between buildings?
Miami condo pricing varies widely because value is determined at the building level, not just by location. Two buildings next to each other can have major differences in financial health, reserves, HOA fees, and management quality. Buyers also pay premiums for better layouts, views, amenities, and newer construction—but not all “new” buildings perform equally. Factors like rental policies, upcoming assessments, and building reputation can significantly impact resale value. This is why price per square foot alone is misleading in Miami’s condo market. The real driver of value is how that specific building competes within its micro-market over time.
Sources:
https://luxlifemiamiblog.com/how-to-buy-a-luxury-condo-in-miami/
https://luxlifemiamiblog.com/category/independent-new-construction-condo-reviews/
WHY WORK WITH DAVID? THINGS YOU SHOULD KNOW...
For all our analytics we are agents driving some very unique and advanced tech. We Provide a granular and custom experience that empower our clients with the insight and tools to understand the most complex behaviors of any local markets.
-
Analytical
Over 100 reports produced to date
-
Knowledgeable
Over 1800 published articles and counting


Related Articles
Ombelle Residences Fort Lauderdale — Flagler Village New Construction Condos 2026
The 5 Best Condos in Bal Harbour & Surfside 2026 (And 2 Condos to Avoid)

The Best Condos in Fort Lauderdale for 2026 — And 3 Condos to Avoid
The 5 Best Condos in Aventura 2026 (And 3 Condos to Avoid)
The Ritz-Carlton Residences Fort Lauderdale Beach: Why This Project Deserves a Serious Look in 2026

The 5 Best Condos in Sunny Isles Beach 2026 (And 3 to Avoid)
Pinecrest vs Palmetto Bay luxury real estate: Why Luxury Buyers Are Moving South
Boca Raton Ultra-Luxury Real Estate 2026: Why the Market Has Changed Forever
The 5 Best Condos in Miami Beach 2026 (And 3 Condos to Avoid)
Miami’s New Construction Condo Boom Comes With Risks Most Buyers Never Ask About
Golden Beach Real Estate 2026: The True Economics of Miami’s Last Private Beach Community

Coconut Grove, Coral Gables or Pinecrest? Ten Things Every Family Buyer Must Know Before Choosing
New Construction Homes in Kendall, Miami
1250 West Avenue Miami Beach Moves Closer to Reality: A New Luxury Landmark for Miami Beach
Please fill in your details and David Siddons will contact you
Search related videos

Must-See Fort Lauderdale Pre-Construction Condos! Don’t Miss Out! FortLauderdale
Fort Lauderdale Real Estate Forecast | Market Predictions for 2024 Education
Solemar Pompano Beach: Luxurious 3 Bedroom New Construction Condo Overlooking the Beach fort lauderdale
Exclusive First Look! NEW Fort Lauderdale Pre Construction Condos FortLauderdale
Luxury Waterfront Homes Showdown: Miami vs. Fort Lauderdale fort lauderdale
The Best Fort Lauderdale New Construction Condos FortLauderdale
Fort Lauderdale Real Estate Expert | Client Appreciation Sunset Cruise FortLauderdale
Fort Lauderdale: The Hottest South Florida Market – All in 5 Minutes! FortLauderdale
Inside Salato Pompano Beach with Elaine Tatum | 40 Brand New Condo Residences FortLauderdale
The Best Gated Communities in Fort Lauderdale FortLauderdale
Inside the Brand New Sixth and Rio Residences in Fort Lauderdale FortLauderdale
#BetterDecisions The Evolution and Livability of Downtown Fort Lauderdale fort lauderdale


- Get our Newsletter
- Subscribe
- No Thanks
Get the latest news from Miami Real Estate News
Close
Edit Search
Close
2 of 14
Share this property
Recomend this to a friend, just enter their email below.
Close
Your email was sent successfully
Close
 COMPARE WITH CONDOGEEKS