


- Best of All
- Best Miami Luxury Condos
- Most popular
- Relocating to Miami
- Private Schools
- Investments
- Gated communities
- Waterfront information
- Luxury homes
- Luxury Condos
- New Construction Condos in South Florida
- Independent Pre-Construction condo reviews for Miami
- Independent Pre-Construction condo reviews for Fort Lauderdale
The Brickell Condo Market in 2020 | Q2 and Q3
A Deep Dive into the Brickell Condo Market in 2020
You might have read our Miami Condo Market report as part of our Q2 and Q3 Miami Real Estate report in which we discuss the high amount of inventory that is sitting in the market and how Covid-19 has accelerated the trends that were already in place. In this blog, we focus solely on the Brickell condo market in 2020, which we analyze with the help of our Condo Geeks Analytics tool.
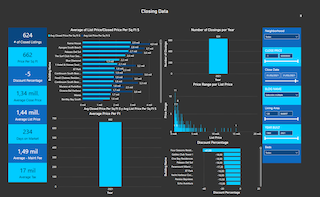
Condo Geeks is a brand new and sophisticated tool, which is essentially a Bloomberg terminal for real estate. The tool empowers you to analyze entire neighborhoods, individual condos or a selection of condos. It provides users with the ability to look at the performance of a neighborhood / condo over time (amount of sales, prices per SF, discounts given and days on market) or to compare neighborhoods / condos to one another. It is essentially the best tool for consumers to see whether a market is going up, down or remains static and to select the best performing condo.
After 410 days on the market, unit 3701 at Echo Brickell sold for $1,550,000 after being originally listed for $3M. The seller paid $2,782,100 in 2017
Brickell – Macro Analysis – Numbers driving the market & Q2 vs Q3 Comparison

Brickell – Macro Analysis – No. of Closed Sales Trend (2019 & 2020)

Transactions across the Brickell Condo market have been in decline since 2017, but the last 18 months show a clearer drop. Q2 of 2020 was the beginning of Covid and universally this has been the greatest period of both ‘shutdown’ and uncertainty. Q3 Figures recovered, although this is definitely not a sign of a recovering Brickell economy, but more an accumulation of missed transactions in Q2.
It’s important to recognize where the majority of transactions have occurred. The table below shows where those transactions took place.
Conclusions: Truly the most important piece of information to partake from this page is that the number of sales per Quarter is a small amount relative to the enormous amount of inventory (1800 listings exist across the Brickell Market currently).
- FOR BUYERS: This will allow for significant negotiations and definitive opportunity to buy at a discount.
- FOR SELLERS: Be realistic, with such huge inventory any seller not willing to come in line with the true market figures can expect to have to hold their unit for several years considering the inventory levels.
Brickell – Building Level Analysis – Number of Closed Sales & Average Close Price Per SF in Quarter 3

In Q3-2020, Echo Brickell outperformed the rest of the buildings in the area. Relatively newer buildings like Brickell Flatiron, Brickell House, Reach, Rise and the Bond are selling at over $450 per foot, but they are still selling at a discount compared to their pre-construction prices. We cannot conclude that any one building is doing particularly well and those that are moving are coming in at trades well below what the developer previously sold them for. Echo for example was previously trading from the developer over $1,100 per SF and Flatiron at $800 per SF. When looking at the price per SF, it is important to appreciate that analysis of this nature is a ‘line by line’ conversation.
IF YOU WANT TO DRILL DEEPER INTO THE CONDO MARKET THEN CALL ME.
WE CAN CONDUCT A ZOOM CHAT TO SHOW YOU OUR CONDO GEEK SCREENS AND YOU CAN SEE
THE PERFORMANCE OF ANY ONE CONDO OVER ITS ENTIRE ECONOMIC LIFE.
Brickell – Macro Analysis – Closed Price by Sq Ft (2019 & 2020)

Unsurprising to see the sudden drop in price per soft in Q2 to them recover in Q3. Q2 was what we refer to as a ‘self induced economic coma’, when everything was totally shutdown. Regardless, the current average price per SF of $415 for Brickell in 2020 is still by far the cheapest compared to other neighborhoods like South Beach or neighboring Coconut Grove, which average double what Brickell currently runs at.
The question we now have is whether we will see further drops. In many buildings asking prices are still well above the average price per SF sold. This number is much more of a guide and the discussion of value remains not just ‘building by building’ but more of a ‘line by line’. Please look at the specific building numbers to get a sense, or better yet call me and we can share our live analytics screens through zoom!
Brickell Condo Market Report- Macro Analysis – Close Price Per Ft (2006-2020)

The Brickell condo market was at its peak during the years of 2006 and 2007; followed by a recession when prices went down by almost 50% in 2008-2011. Since 2012, the market recovered and was at its peak in 2015; followed by another cycle of reduction in prices. Today we blend out at $415 per SF although there are a number of buildings that trade much higher. It is helpful to match this data with the months of inventory as that determines if the market will continue to fall further or will either a) stabilize or b) start to rise again. Given that we currently track the bottom of the condo market to somewhere around 2012-2013 figures, it suggests we could see further drops in price per SF. This is supported by the high levels of inventory. As always remember that we say condo analysis is not a ‘neighborhood by neighborhood’ process or even a ‘building by building’ process. It is far more granular and becomes a ‘line by line’ conversation.
Brickell Condo Market Report- Macro Analysis – No. of Closed Sales Trend (2006-2020)

Peak year for number of units sold was 2013; there was a new construction cycle from 2013-2019, which led to increase in units sold. Without a doubt 2020 has been a much slower year for condos due to Covid-19. Covid is as we say an ‘economic accelerator’ of trends and not a creator of them. Brickell tends to be driven by investors and second home owners. This is of course far more of a discretionary purchase.
One thing definitely moving the needle is the strength or lack of the Condo rental market. If lower income tenants do not pay rents then this can have a severe effect on the rental income and thus the market as a whole. We have not seen such low sales since 2009, which does not bear well for future prices as the supply / demand balance shifts with slow sales. As always, it’s important to recognize the buildings and price points that do move, as not all price points and product behave the same.
FAQ
These are the most commonly asked Google Real Estate Related questions
1. What are the Current Best New Condos in Miami?
If you want to hear in more details our opinions on the best new Miami new construction condos. Please read this article:Best New Construction Condos 2022-2023.
2. What is the best New Construction Condo in Fort Lauderdale?
In our opinion, the Residences at Pier Sixty-six are certainly the most interesting and unique. Already well underway this 32 Acre project will be home to the first of its kind Marina where owners will be able to anchor up vessels up to a staggering 400 ft! For specifics of this project see our independent review of this project.
3. How can I compare the new luxury construction Condos to the best existing Luxury Condos in Miami?
Our Best Luxury Condos in Miami article will prove to be very useful to those looking to compare the existing to the new. You may also want to watch this video which shows the performance of the best Condos in Miami over the last 15 years!
WHY WORK WITH DAVID? THINGS YOU SHOULD KNOW...
For all our analytics we are agents driving some very unique and advanced tech. We Provide a granular and custom experience that empower our clients with the insight and tools to understand the most complex behaviors of any local markets.
-
Analytical
Over 100 reports produced to date
-
Knowledgeable
Over 1800 published articles and counting


Related Articles
The 2025 Boca Raton Real Estate Market Report

Sereno Fort Lauderdale: Boutique Coastal Living Surrounded by Nature, Ocean, and City Views
The Best Private Schools Near Palmetto Bay
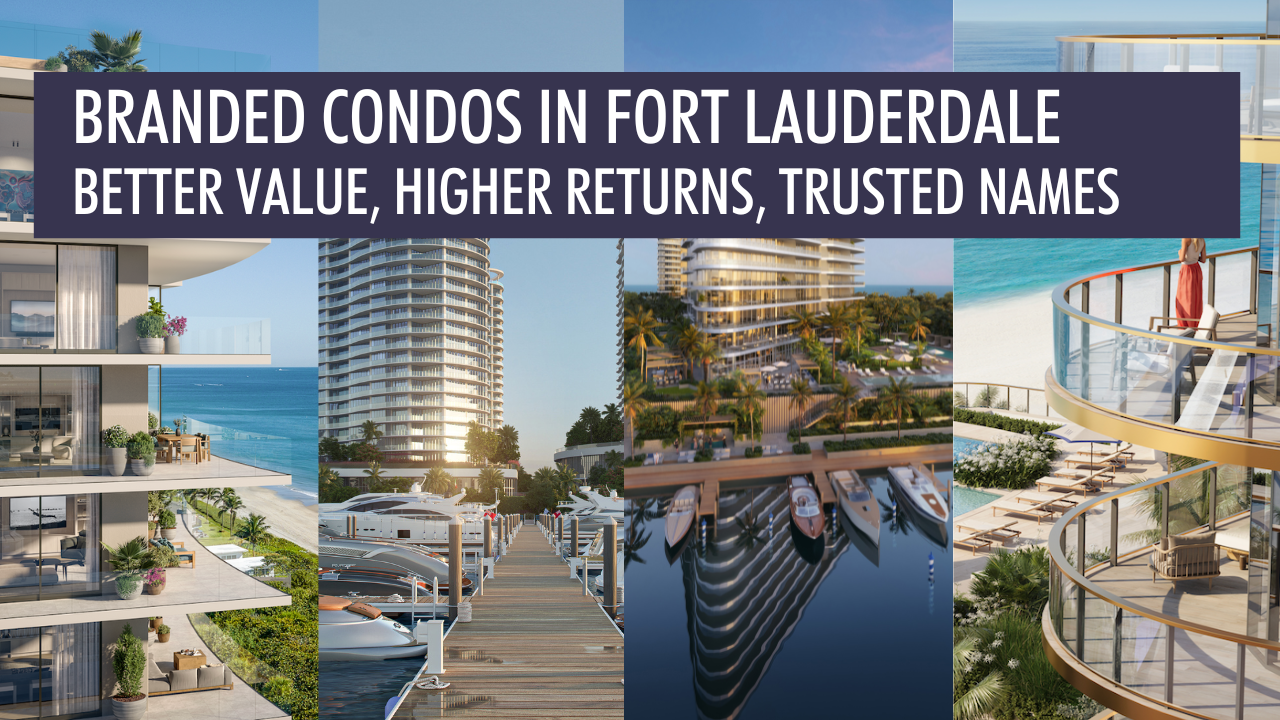
Luxury Branded Condos in Fort Lauderdale: Better Value, Higher Returns, Trusted Names
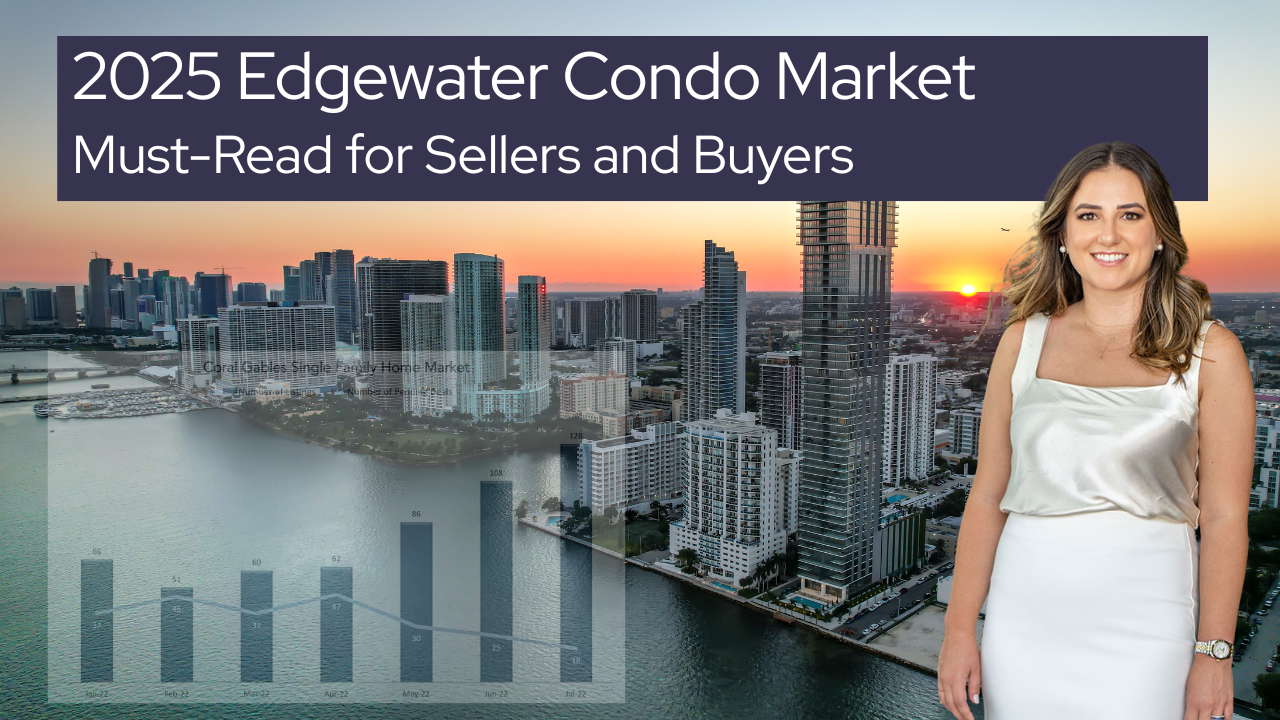
Edgewater Condo Market 2025: Performance, Trends, and Buyer Activity by Price Tier
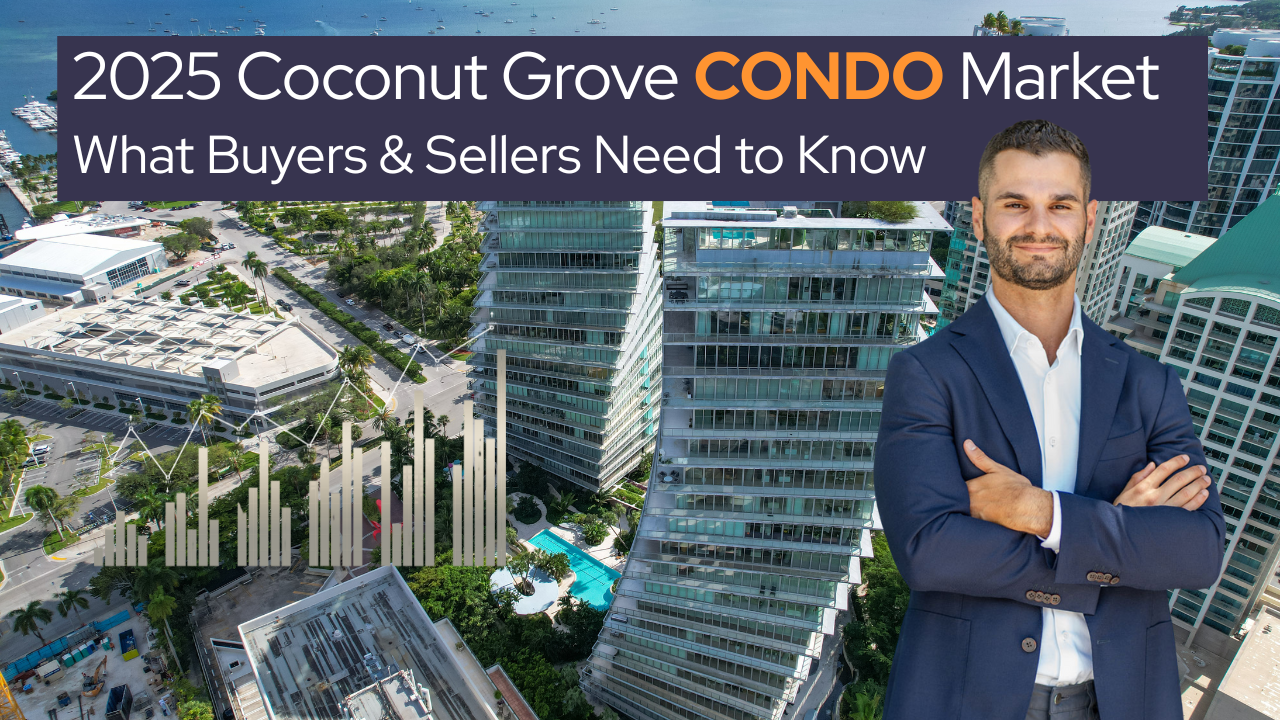
2025 Coconut Grove Condo Market Report | What Buyers & Sellers Need to Know Now
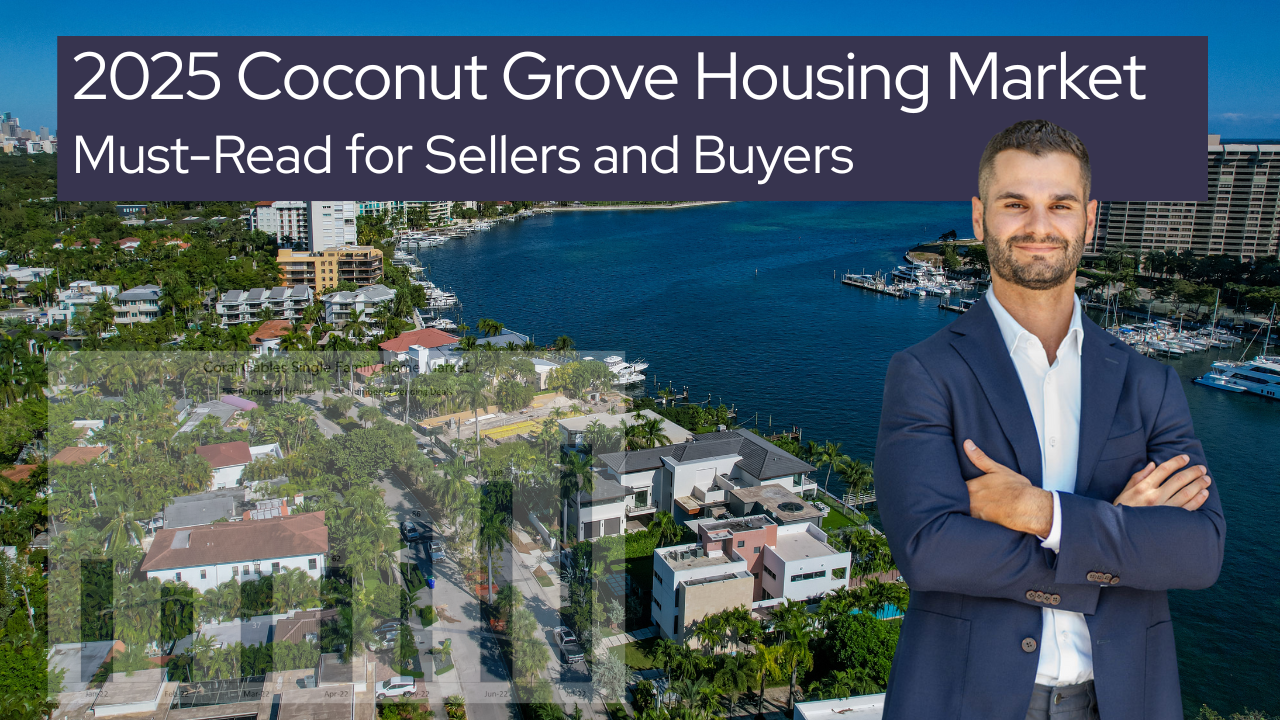
2025 Coconut Grove Housing Market Report: A Midyear Market Breakdown by Price Range
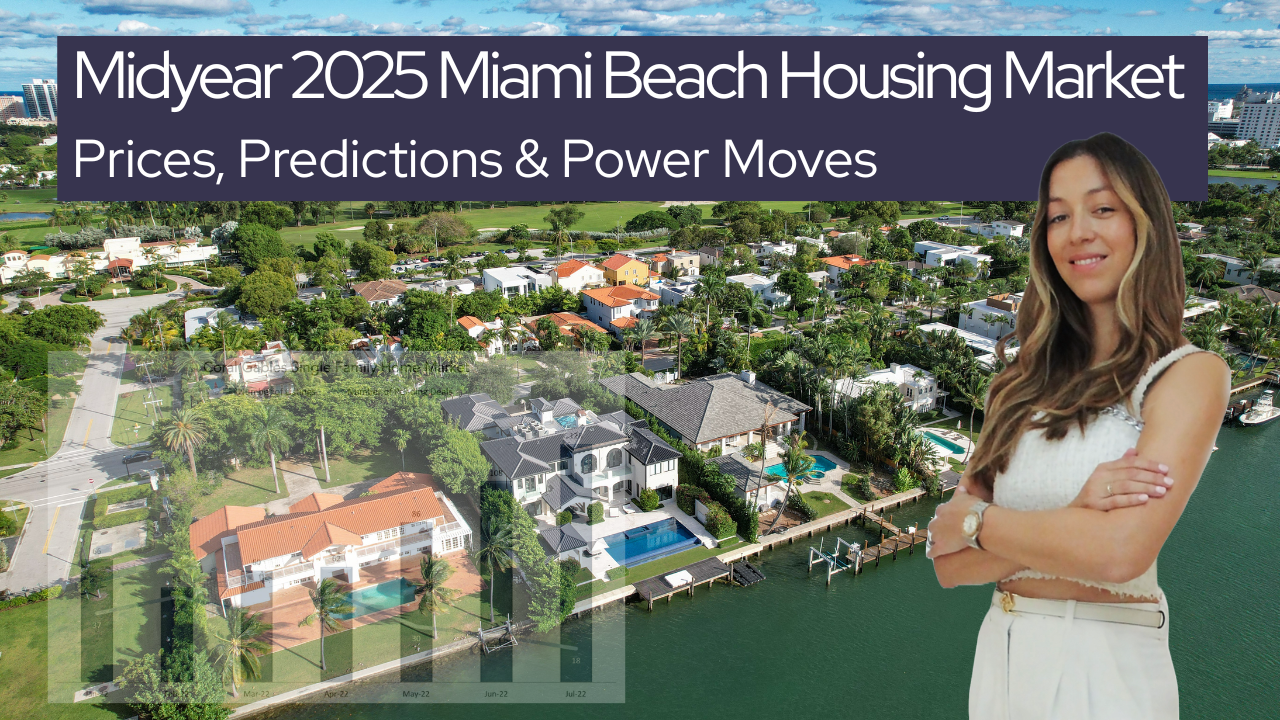
The 2025 Midyear Miami Beach Real Estate Market Report | What’s Hot, What’s Not, and What to Watch
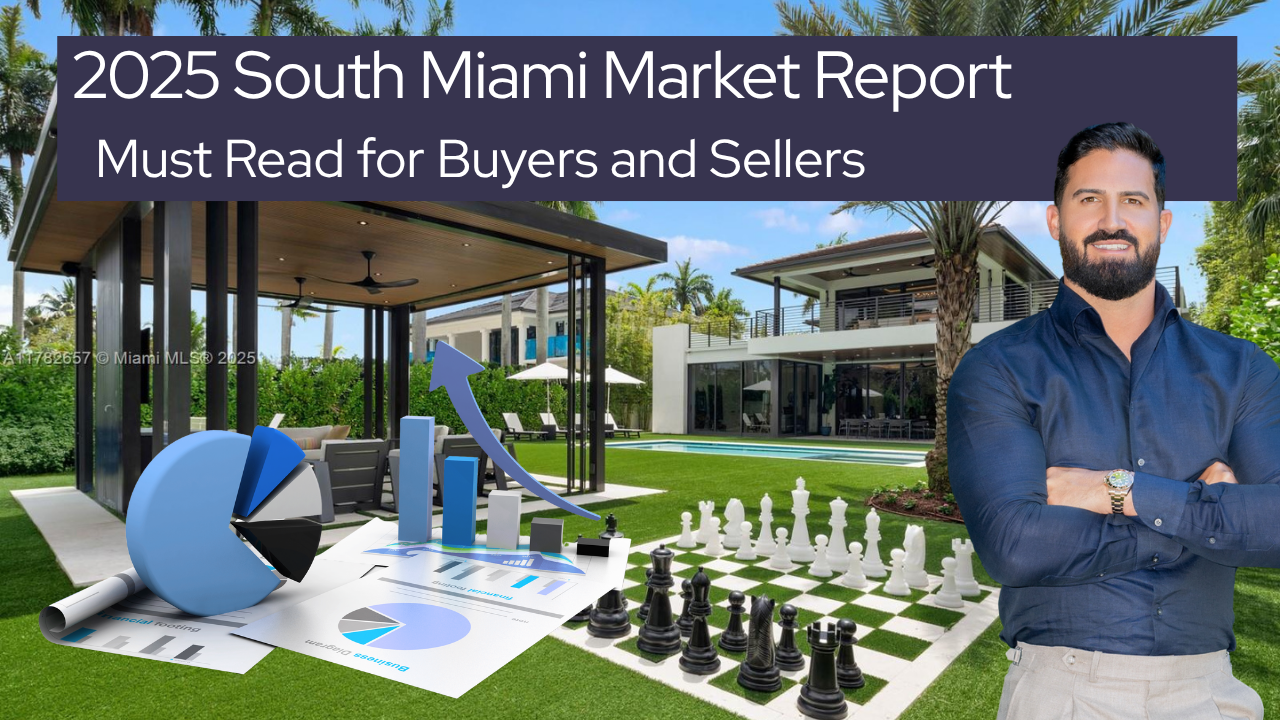
2025 South Miami Real Estate Report | Midyear Market Intelligence for Buyer and Sellers
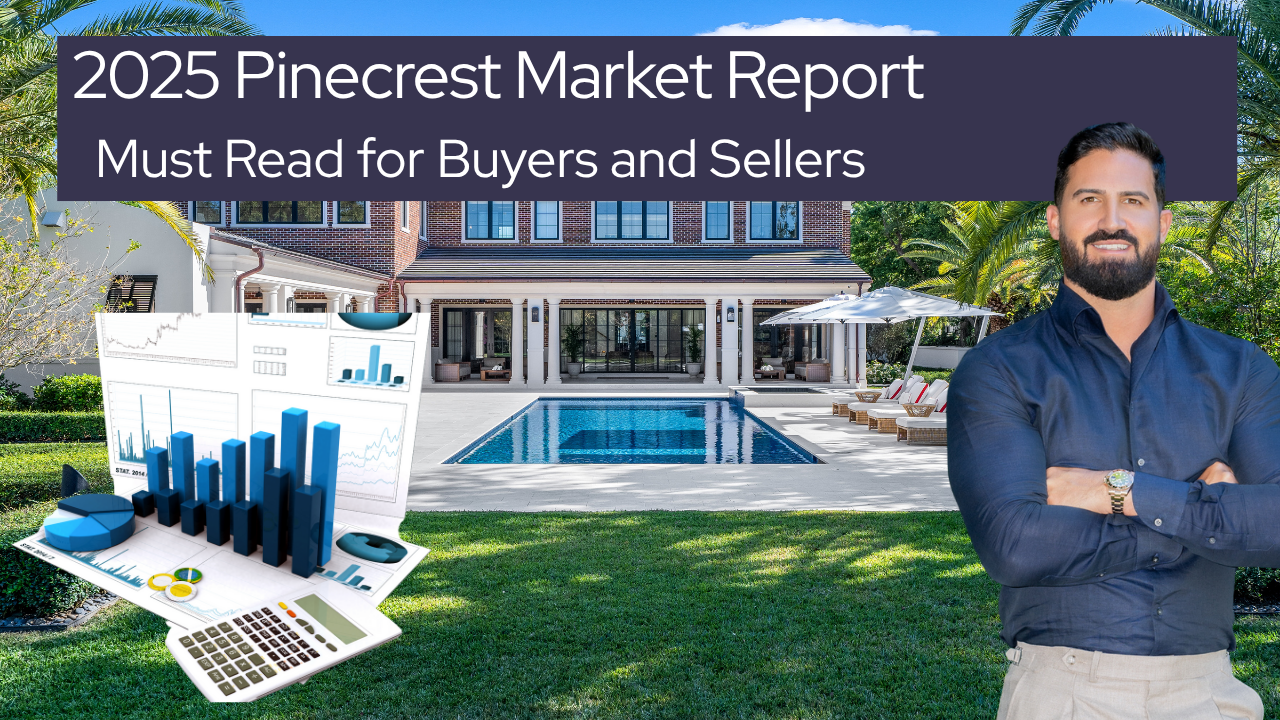
The 2025 Pinecrest Real Estate Report | A Midyear Review for Buyers and Sellers
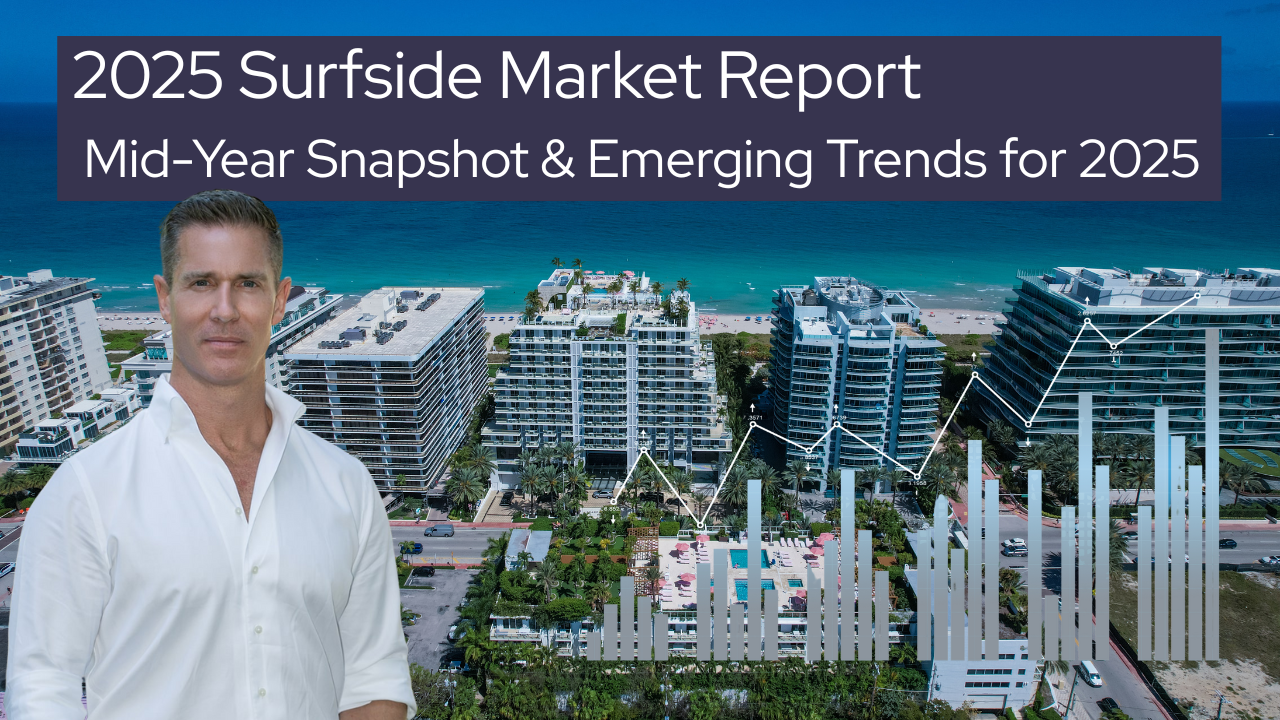
The 2025 Surfside Real Estate Report | Mid-Year Snapshot & Emerging Trends for 2025
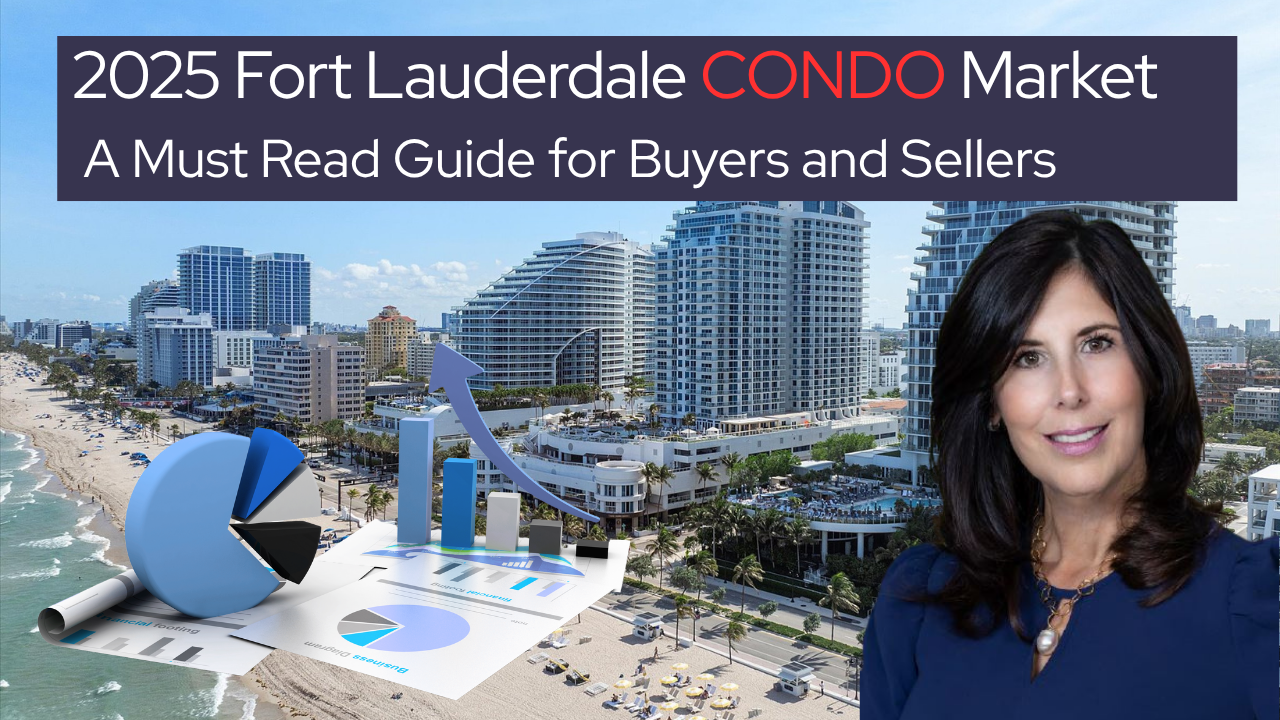
The 2025 Fort Lauderdale Condo Market Report | A Midyear Market Overview for Buyers & Sellers
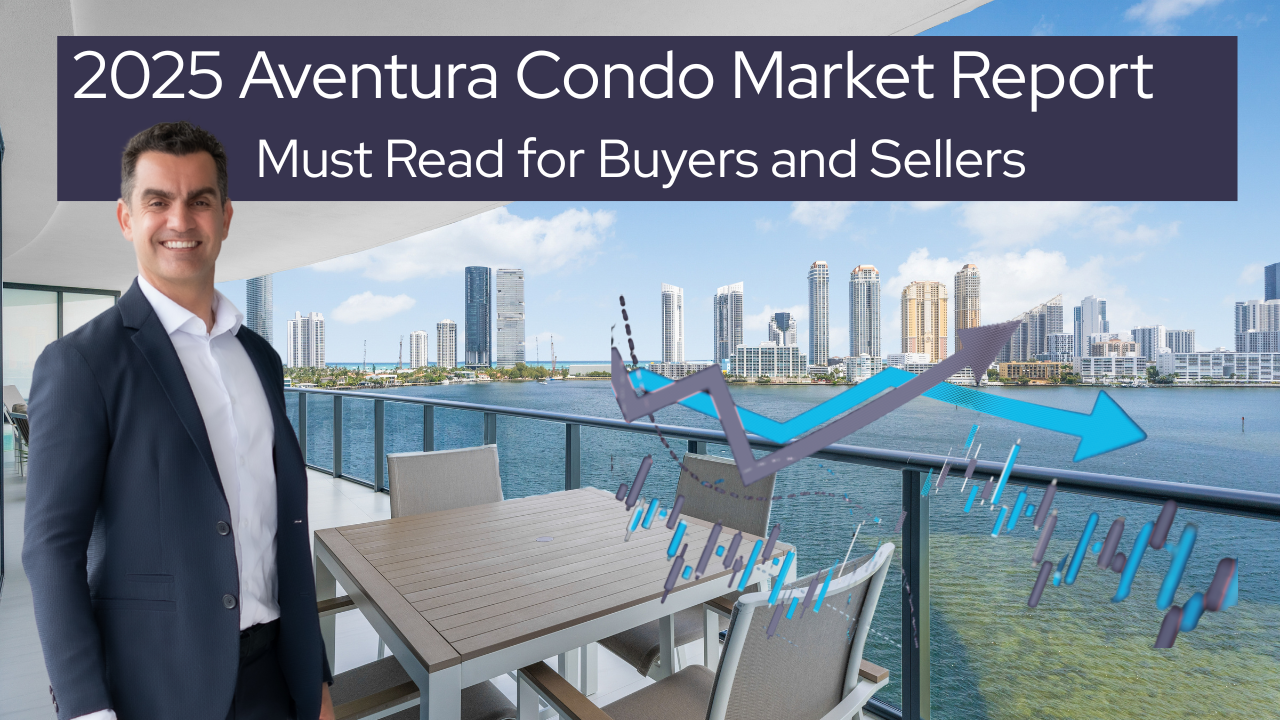
The 2025 Aventura Condo Market Report | A Midyear Review for Buyers and Sellers
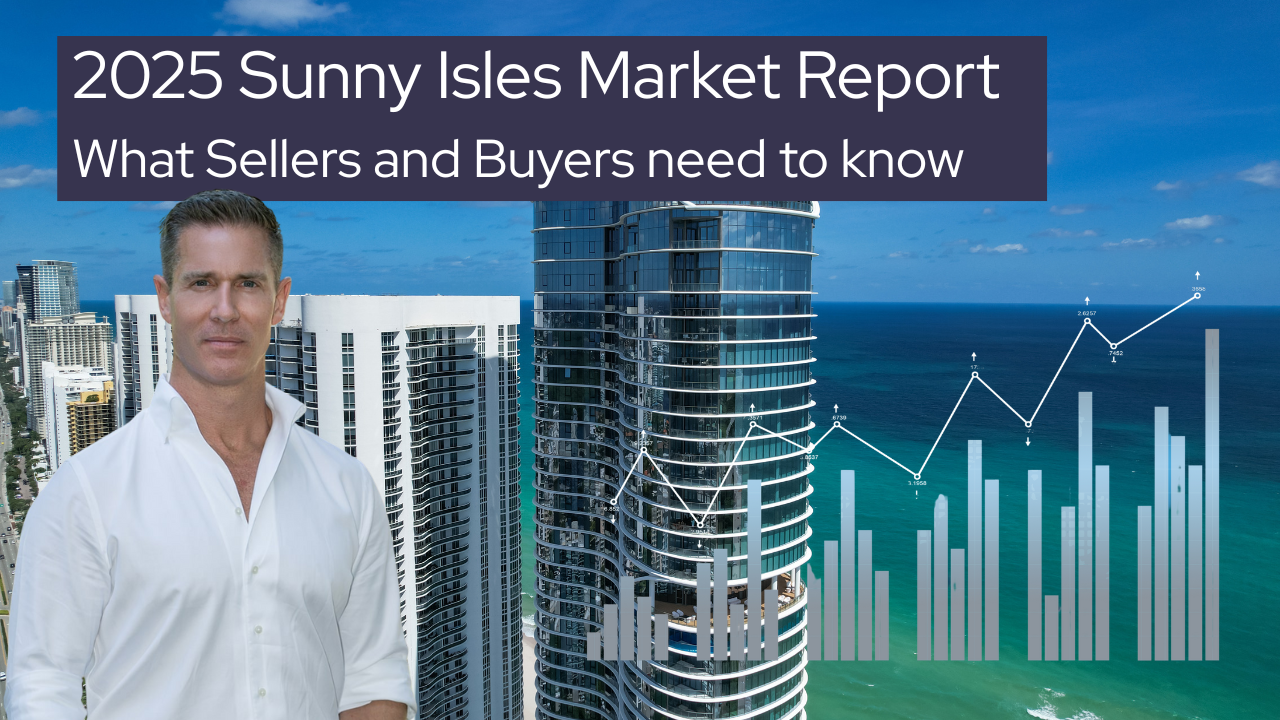
Sunny Isles Real Estate Market 2025: A Segment-by-Segment Breakdown for Buyers and Sellers
Please fill in your details and David Siddons will contact you


- Get our Newsletter
- Subscribe
- No Thanks
Get the latest news from Miami Real Estate News
Close
Edit Search
Close
2 of 14

Share this property
Recomend this to a friend, just enter their email below.
Close
Your email was sent successfully
Close
 COMPARE WITH CONDOGEEKS