- Best of All
- Best Miami Luxury Condos
- Most popular
- Relocating to Miami
- Private Schools
- Investments
- Gated communities
- Waterfront information
- Luxury homes
- Luxury Condos
- New Construction Condos in South Florida
- Independent Pre-Construction condo reviews for Miami
- Independent Pre-Construction condo reviews for Fort Lauderdale
Sunny Isles Beach Condo Update – Quarter 4 2015 | Quarter 1 of 2016
The Sunny Isles Beach Condo Market in a Nutshell
♦ Average prices ♦ Inventory levels ♦ Number of sales
Get a quick overview of the Sunny Isles Beach Condo Market in the first half year of 2016
Our quarterly real estate updates are excellent to gather a pulse on the Sunny Isles Beach condo market as we provide the market’s key indicators. Although our real estate updates are refreshed each quarter they focus on the last half year of Sunny Isles Beach condo data to provide you with a more complete overview of the market. All data are derived from the MLS South Florida
Data are given for Sunny Isles Beach condos in the price ranges of:
- $350,000 – $1M
- $1M – $2M
- $2M +
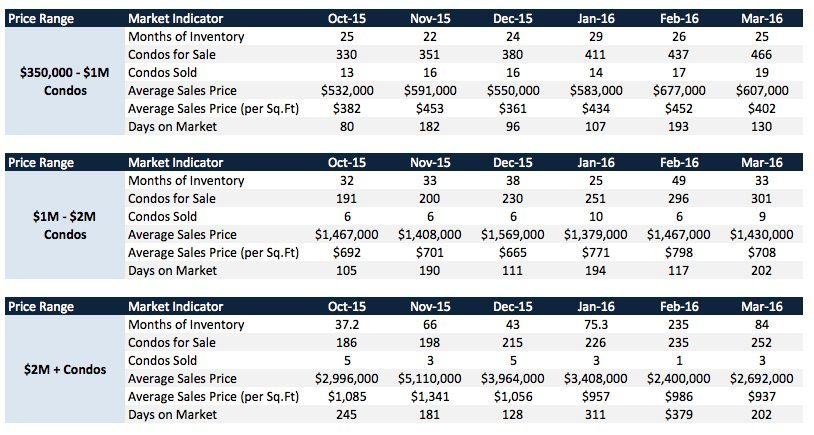
Summary of the Sunny Isles Beach Condo Market– Q4 2015 and Q1 2016
Please find all the data in the table below. For the more visual people, the graphs will follow hereafter.
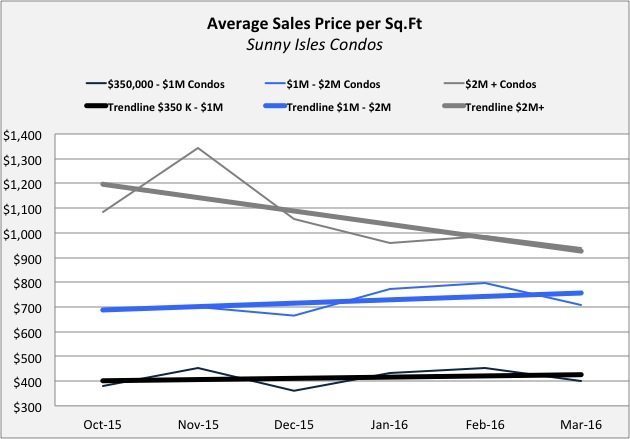
The Average Sales Prices per Sq.Ft for Sunny Isles Beach condos
Have a look at the average sales prices per Sq.Ft for Sunny Isles Beach condos in the last 6 months
Please note that this graph provides the data for three different price ranges. The thicker, straight lines are trend lines and provide you with a better idea of to where the market is heading.
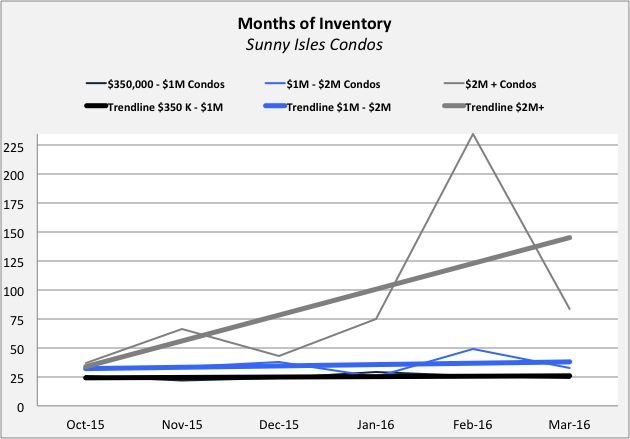
The Months of Inventory for Sunny Isles Beach Condos
The months of inventory is an important indicator in real estate. It indicates how many months it takes to sell all the current listings under the assumption that no new listings will enter the market.
Please note that this graph provides the data for three different price ranges. The thicker, straight lines are trend lines and provide you with a better idea of to where the market is heading.
Buyer’s market: more than 9 months of inventory based on closed sales
Seller’s market: less than 6 months of inventory based on closed sales
Neutral market: 6 – 9 months of inventory based on closed sales
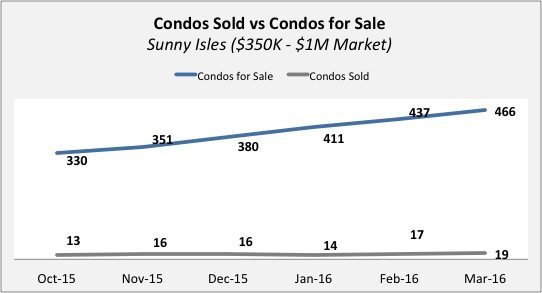
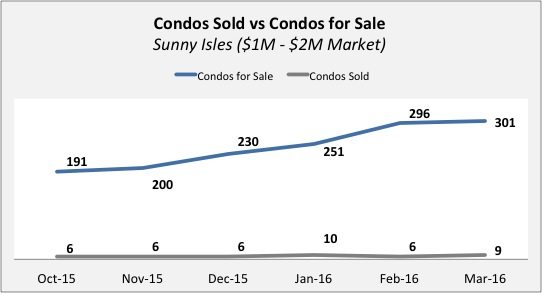
Sunny Isles Beach condos for sale vs Sunny Isles Beach condos sold
This overview provides you with the amount of condos that sold vs the amount of condos that were listed on the market. This says something about the supply and demand of the Sunny Isles Beach real estate market
Please note that there are three different graphs for three different price ranges in the gallery
Click on images to enlarge
FAQ
These are the most commonly asked Google Real Estate Related questions
1. What are the Current Best New Condos in Miami?
If you want to hear in more details our opinions on the best new Miami new construction condos. Please read this article:Best New Construction Condos 2022-2023.
2. What is the best New Construction Condo in Fort Lauderdale?
In our opinion, the Residences at Pier Sixty-six are certainly the most interesting and unique. Already well underway this 32 Acre project will be home to the first of its kind Marina where owners will be able to anchor up vessels up to a staggering 400 ft! For specifics of this project see our independent review of this project.
3. How can I compare the new luxury construction Condos to the best existing Luxury Condos in Miami?
Our Best Luxury Condos in Miami article will prove to be very useful to those looking to compare the existing to the new. You may also want to watch this video which shows the performance of the best Condos in Miami over the last 15 years!
Please fill in your details and David Siddons will contact you
- Get our Newsletter
- Subscribe
- No Thanks
Get the latest news from Miami Real Estate News
Edit Search
Recomend this to a friend, just enter their email below.
 COMPARE WITH CONDOGEEKS


