- Best of All
- Best Miami Luxury Condos
- Most popular
- Relocating to Miami
- Private Schools
- Investments
- Gated communities
- Waterfront information
- Luxury homes
- Luxury Condos
- New Construction Condos in South Florida
- Independent Pre-Construction condo reviews for Miami
- Independent Pre-Construction condo reviews for Fort Lauderdale
2025 Miami Real Estate Market Trends | What Buyers and Sellers Need to Know
Summary
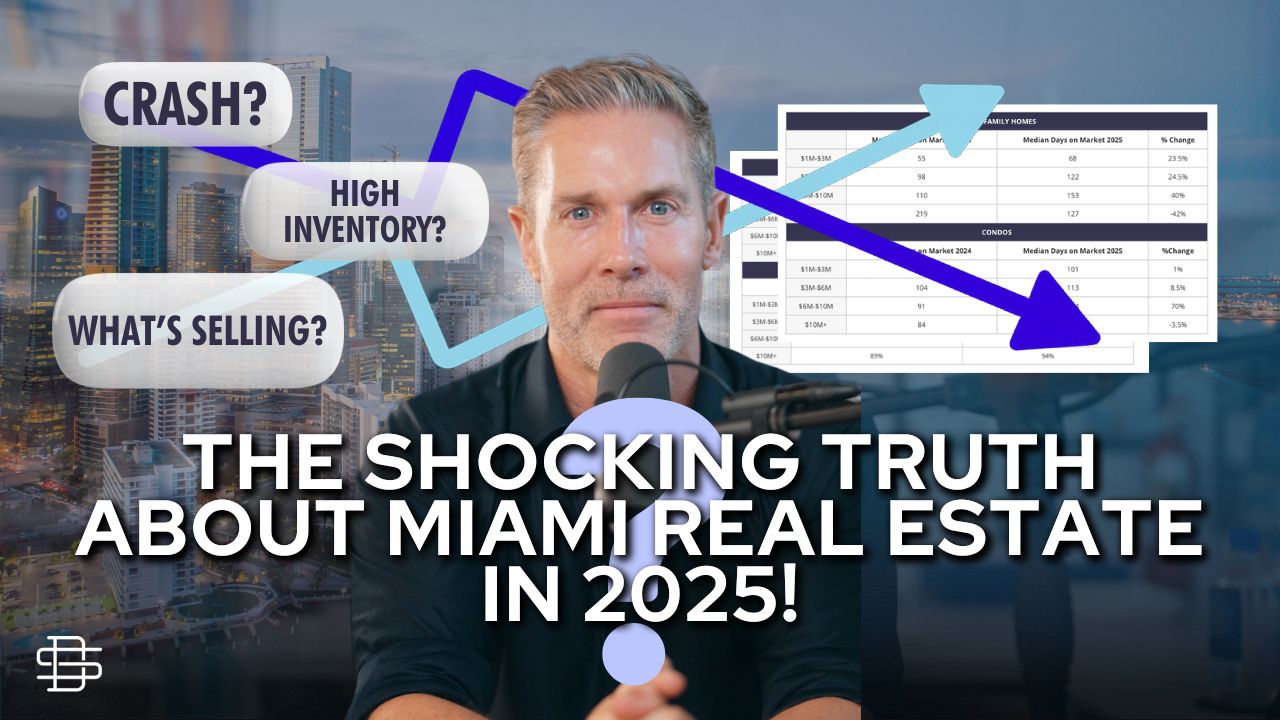
We just answered the top 10 most-Googled questions about the 2025 Miami real estate market— from inventory and pricing trends to rising HOA fees and who’s actually buying in Miami right now. Below, you’ll find a clear overview of the latest market shifts in both the housing and condo markets. We’ve also created dedicated sections that break things down by price point — and we’ll be rolling out neighborhood-specific reports to give you even deeper insight into what’s really happening on the ground.
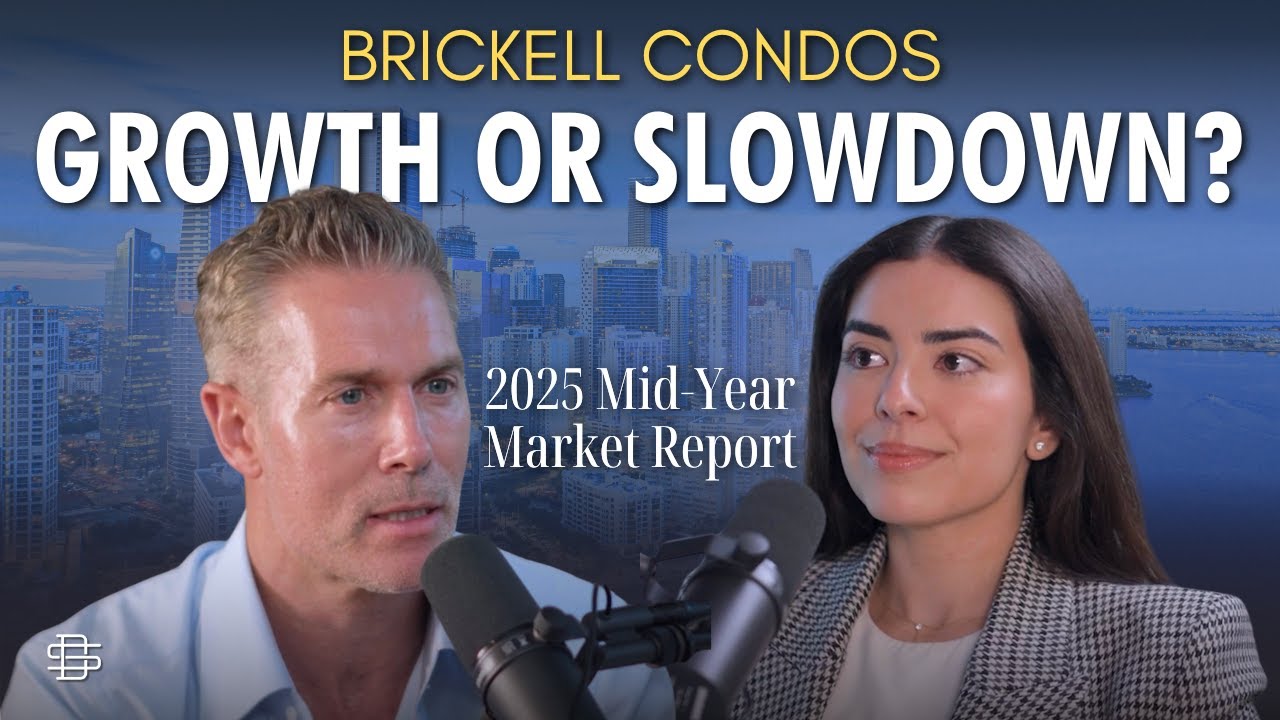
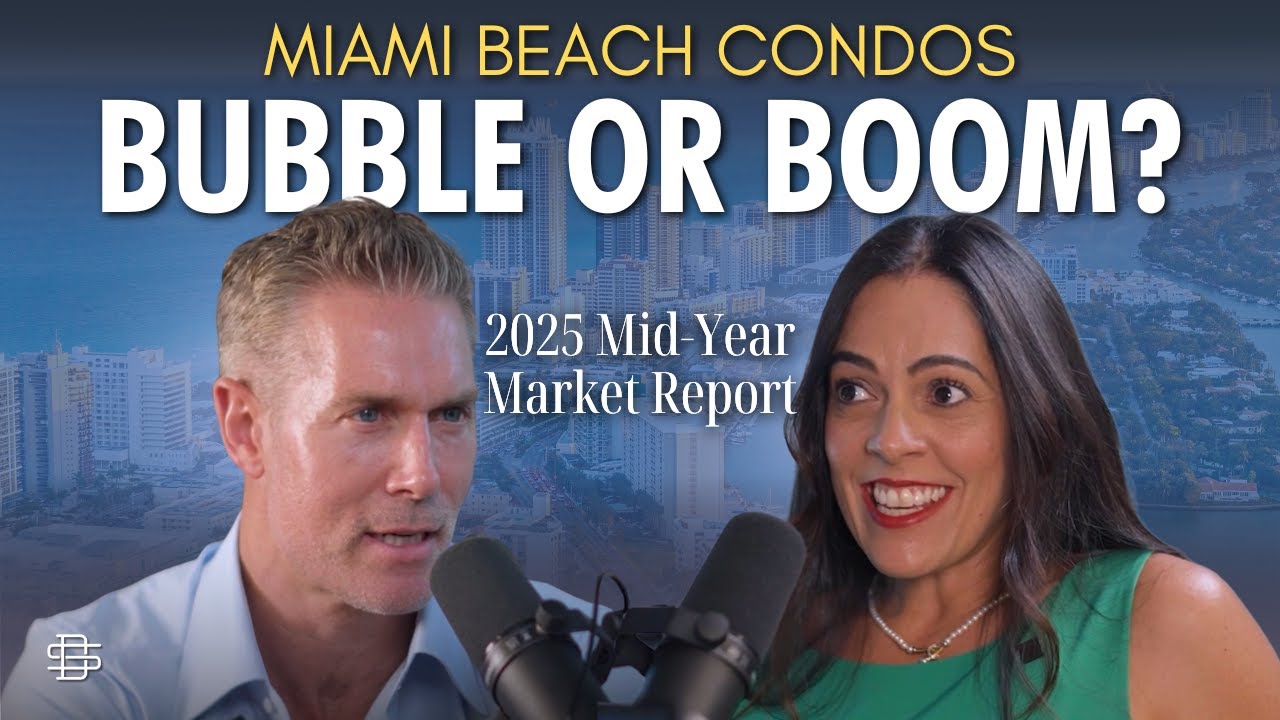
Please read our individual neighborhood reports for Coral Gables Homes, Coconut Grove Homes, Coconut Grove Condos, Pinecrest Homes, South Miami Homes, Miami Beach Homes, Miami Beach Condos, Brickell & Downtown Condos, Edgewater Condos, Aventura Condos, Sunny isles Condos, Surfside Condos.
Key Takeaways
- Ultra-Luxury Homes Are Leading. $10M+ single-family homes are outperforming the market with faster sales and rising prices, while $6M-$10M homes are sluggish with rising inventory and longer days on market
- Condos Are Softer, Especially Above $3M. Most condo segments are slowing, with rising inventory and selective buyers. Stagnation is most visible in aging or overpriced buildings, especially in Sunny Isles, Edgewater, and Downtown.
- Inventory Is Up—But Varies by Segment
Inventory has increased overall, but dropped in the $10M+ home segment. Meanwhile, $6M–$10M condos and homes have seen the largest spikes, indicating buyer leverage in those tiers. - It’s a Mixed Market: Buyer’s, Seller’s, or Neutral Depends on Price
-$10M+ homes = still seller-friendly.
-$6M–$10M = clear buyer’s market.
-Condos = buyer’s market across nearly all tiers, especially $3M+. - Days on Market Are Rising—Except at the Very Top. Most segments saw longer time to sell (especially $6M–$10M homes/condos), except the $10M+ tier, where demand and pricing are stronger and time on market actually fell.
- Price Cuts and Negotiability Are Widespread. Sellers are getting below asking in most segments. Discounting is most severe in the $6M–$10M tier and for condos over $10M. Buyers are waiting, watching, and negotiating hard.
- Only Top-Quality Product Moves Quickly. Turnkey, well-designed homes or condos are selling fast—often with backup offers. Dated, generic, or poorly finished inventory is sitting, inflating overall supply and days on market.
- Luxury Rentals Are Booming. High-end rentals ($30K+/month) are surging as luxury buyers wait for the right opportunity. Meanwhile, demand for $5K–$10K rentals—especially in condo-heavy areas—is cooling.
- Buyer Pool Is Still Strong and Global. New York, California, and Europe continue to drive demand. Many luxury buyers are now locals who rented first and are ready to buy. International interest remains steady despite macro uncertainty.
- Every Neighborhood Tells a Different Story. Market dynamics vary dramatically by area. Upcoming neighborhood-specific reports will clarify localized trends across Coral Gables, Coconut Grove, Pinecrest, Brickell, and others.
What Is the State of the Miami Real Estate Market in 2025?
Click here to view condos by price range, or here to view homes by price range.
1. How have home and condo prices changed In Jan-May 2024 vs Jan-May 2025?

SINGLE-FAMILY HOMES
The ultra-luxury segment—homes priced over $10 million—continues to outperform the rest of the market. This has always been the case: primary product consistently does better than secondary product, and that becomes even more noticeable when the market softens, as we’ve seen over the past six months. In this top tier, we’re seeing better-quality properties trading hands, and the price per square foot has remained strong. Properties in the $50M to $85M+ range are more active than ever, and they’re commanding some of the highest premiums we’ve seen.
In the $6M to $10M range, we’re noticing a softer market. The price per square foot has shifted, and while that might suggest weakening, the reality is more nuanced. Good product—homes that are well-designed, well-located, and ready to move into—are still selling at similar prices. It’s just that there’s less movement overall. We’re not seeing signs of a crash here; rather, it’s a flatter, quieter market. The inventory doesn’t suggest distress, and prices for quality homes are holding steady. What we are seeing is that buyers are more patient. They’re taking their time, looking for the right fit, and not settling for anything less than ideal.
In the $3M to $6M bracket, prices have actually gone up, but not necessarily because values are rising across the board. What’s happening is buyers are choosing newer, polished, turnkey homes—and those homes naturally come with higher price tags. Older inventory, especially homes that need updating or have functional flaws, are sitting on the market much longer. So while the segment appears to be rising, it’s more about what’s being bought, not a broader price increase.
That same dynamic applies to the lower end of the market as well. Even in sub-$3M properties, buyers are focusing on move-in-ready homes and letting the dated ones linger. Interest rates—now hovering around 8%—definitely play a role in buyer psychology, but what’s interesting is how stable the market still feels despite that. If the market is holding up this well with high rates, it’s worth imagining what could happen once rates begin to drop again.
CONDOS
Now, when we shift over to the condo market, the picture looks a little different. Condos often fall into the secondary home or investor category, so they behave differently. The $10M+ condo segment isn’t doing badly—but most of that inventory is in new construction, which doesn’t always show up in the MLS data. Buildings like Perigon, Rivage, and the Mandarin Oriental are selling very well during pre-construction, and those deals aren’t reflected in traditional reports. The softening in the condo space is really happening in specific buildings with certain condos that are seeing more inventory pile up, and buyers are far more selective. Unless the product is truly standout, it tends to sit.
Buildings that are seeing stagnating prices: Posche Design, Muse, Armani and Trump Royal in Sunny Isles, Oceana Key Biscayne, Paris Bayviews, One Thousand Museum in Edgewater, Grove at Grand Bay, Paramount and Epic in the Downtown Area, Faena Miami Beach and St Regis in Bal Harbour. Although some of these condos are really high quality condos that we would recommend, some units are just not hitting the market or are overpriced.
So overall, we’re in a complex but fairly healthy market. The headline is this: quality still sells, patient buyers are waiting for the right opportunities, and while some segments are slower, there’s no indication of a dramatic drop in value—just a more measured pace.
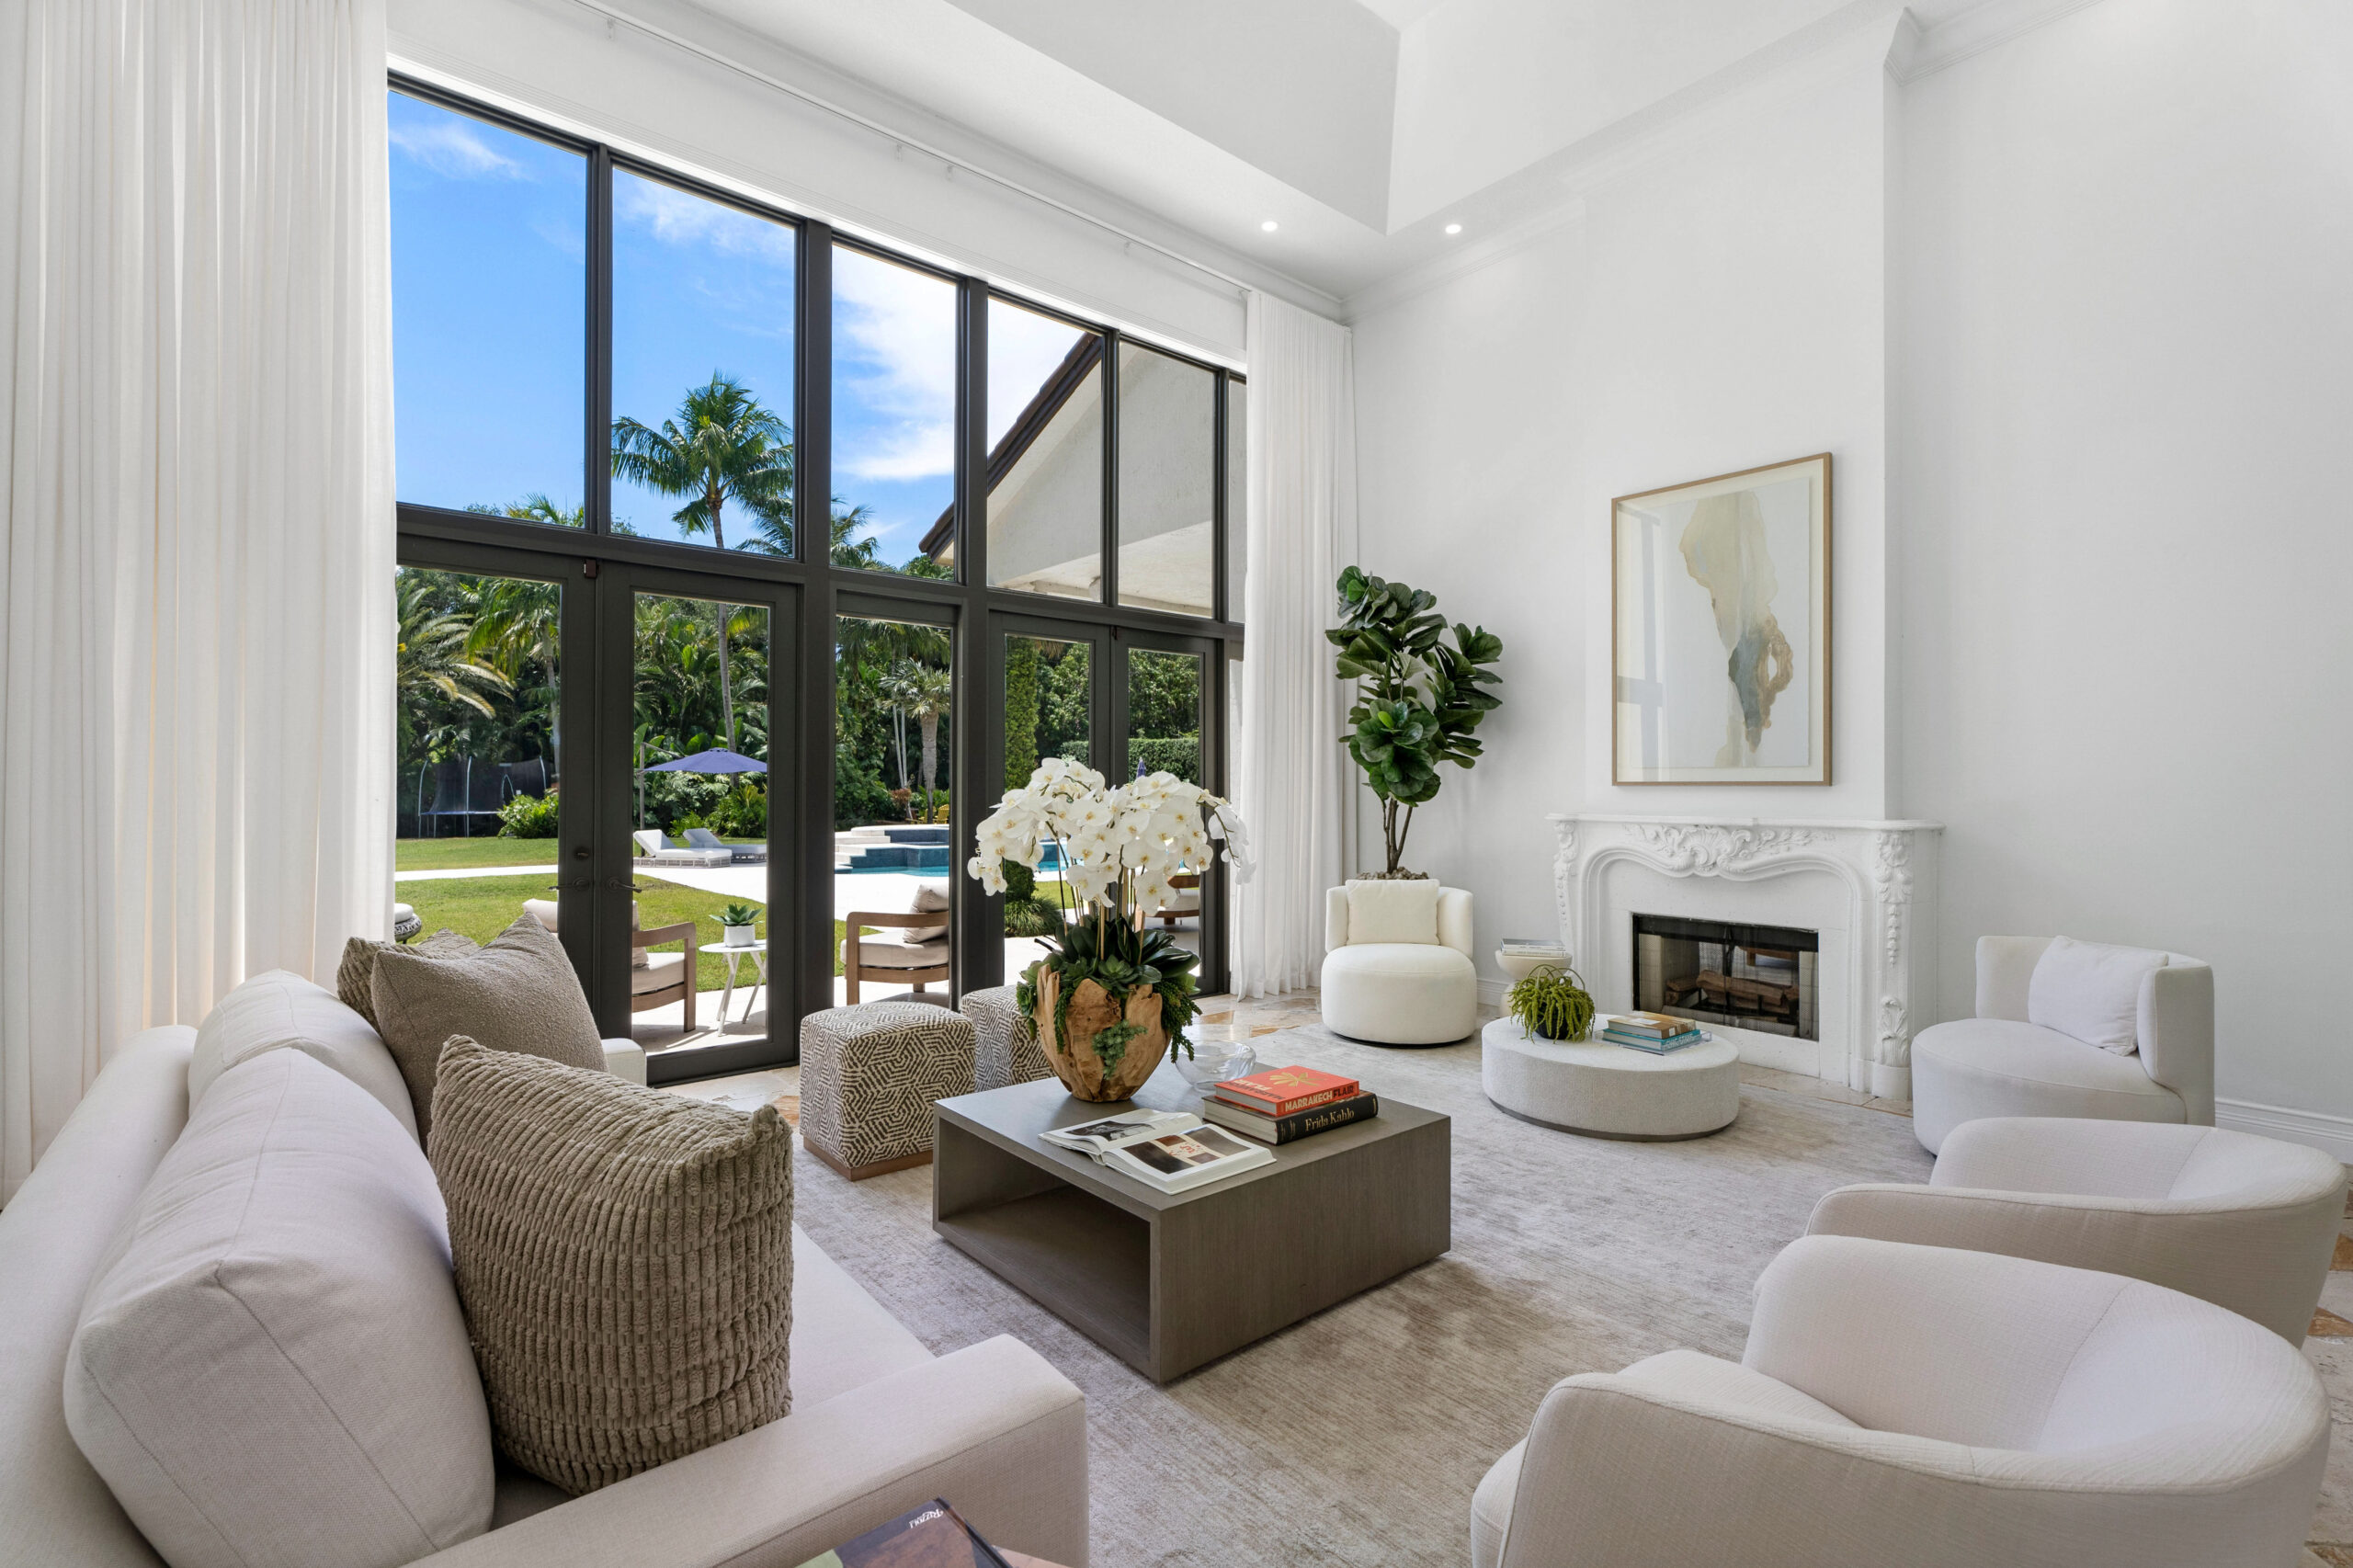
2025 Miami Real Estate Market: Check out our individual market reports for more in-depth insights into the specific neighborhoods.
2.How is the current inventory level compared to Last year?
The short answer? Yes, there’s more of it—but like everything in real estate, the truth is far more nuanced.
SINGLE-FAMILY HOMES
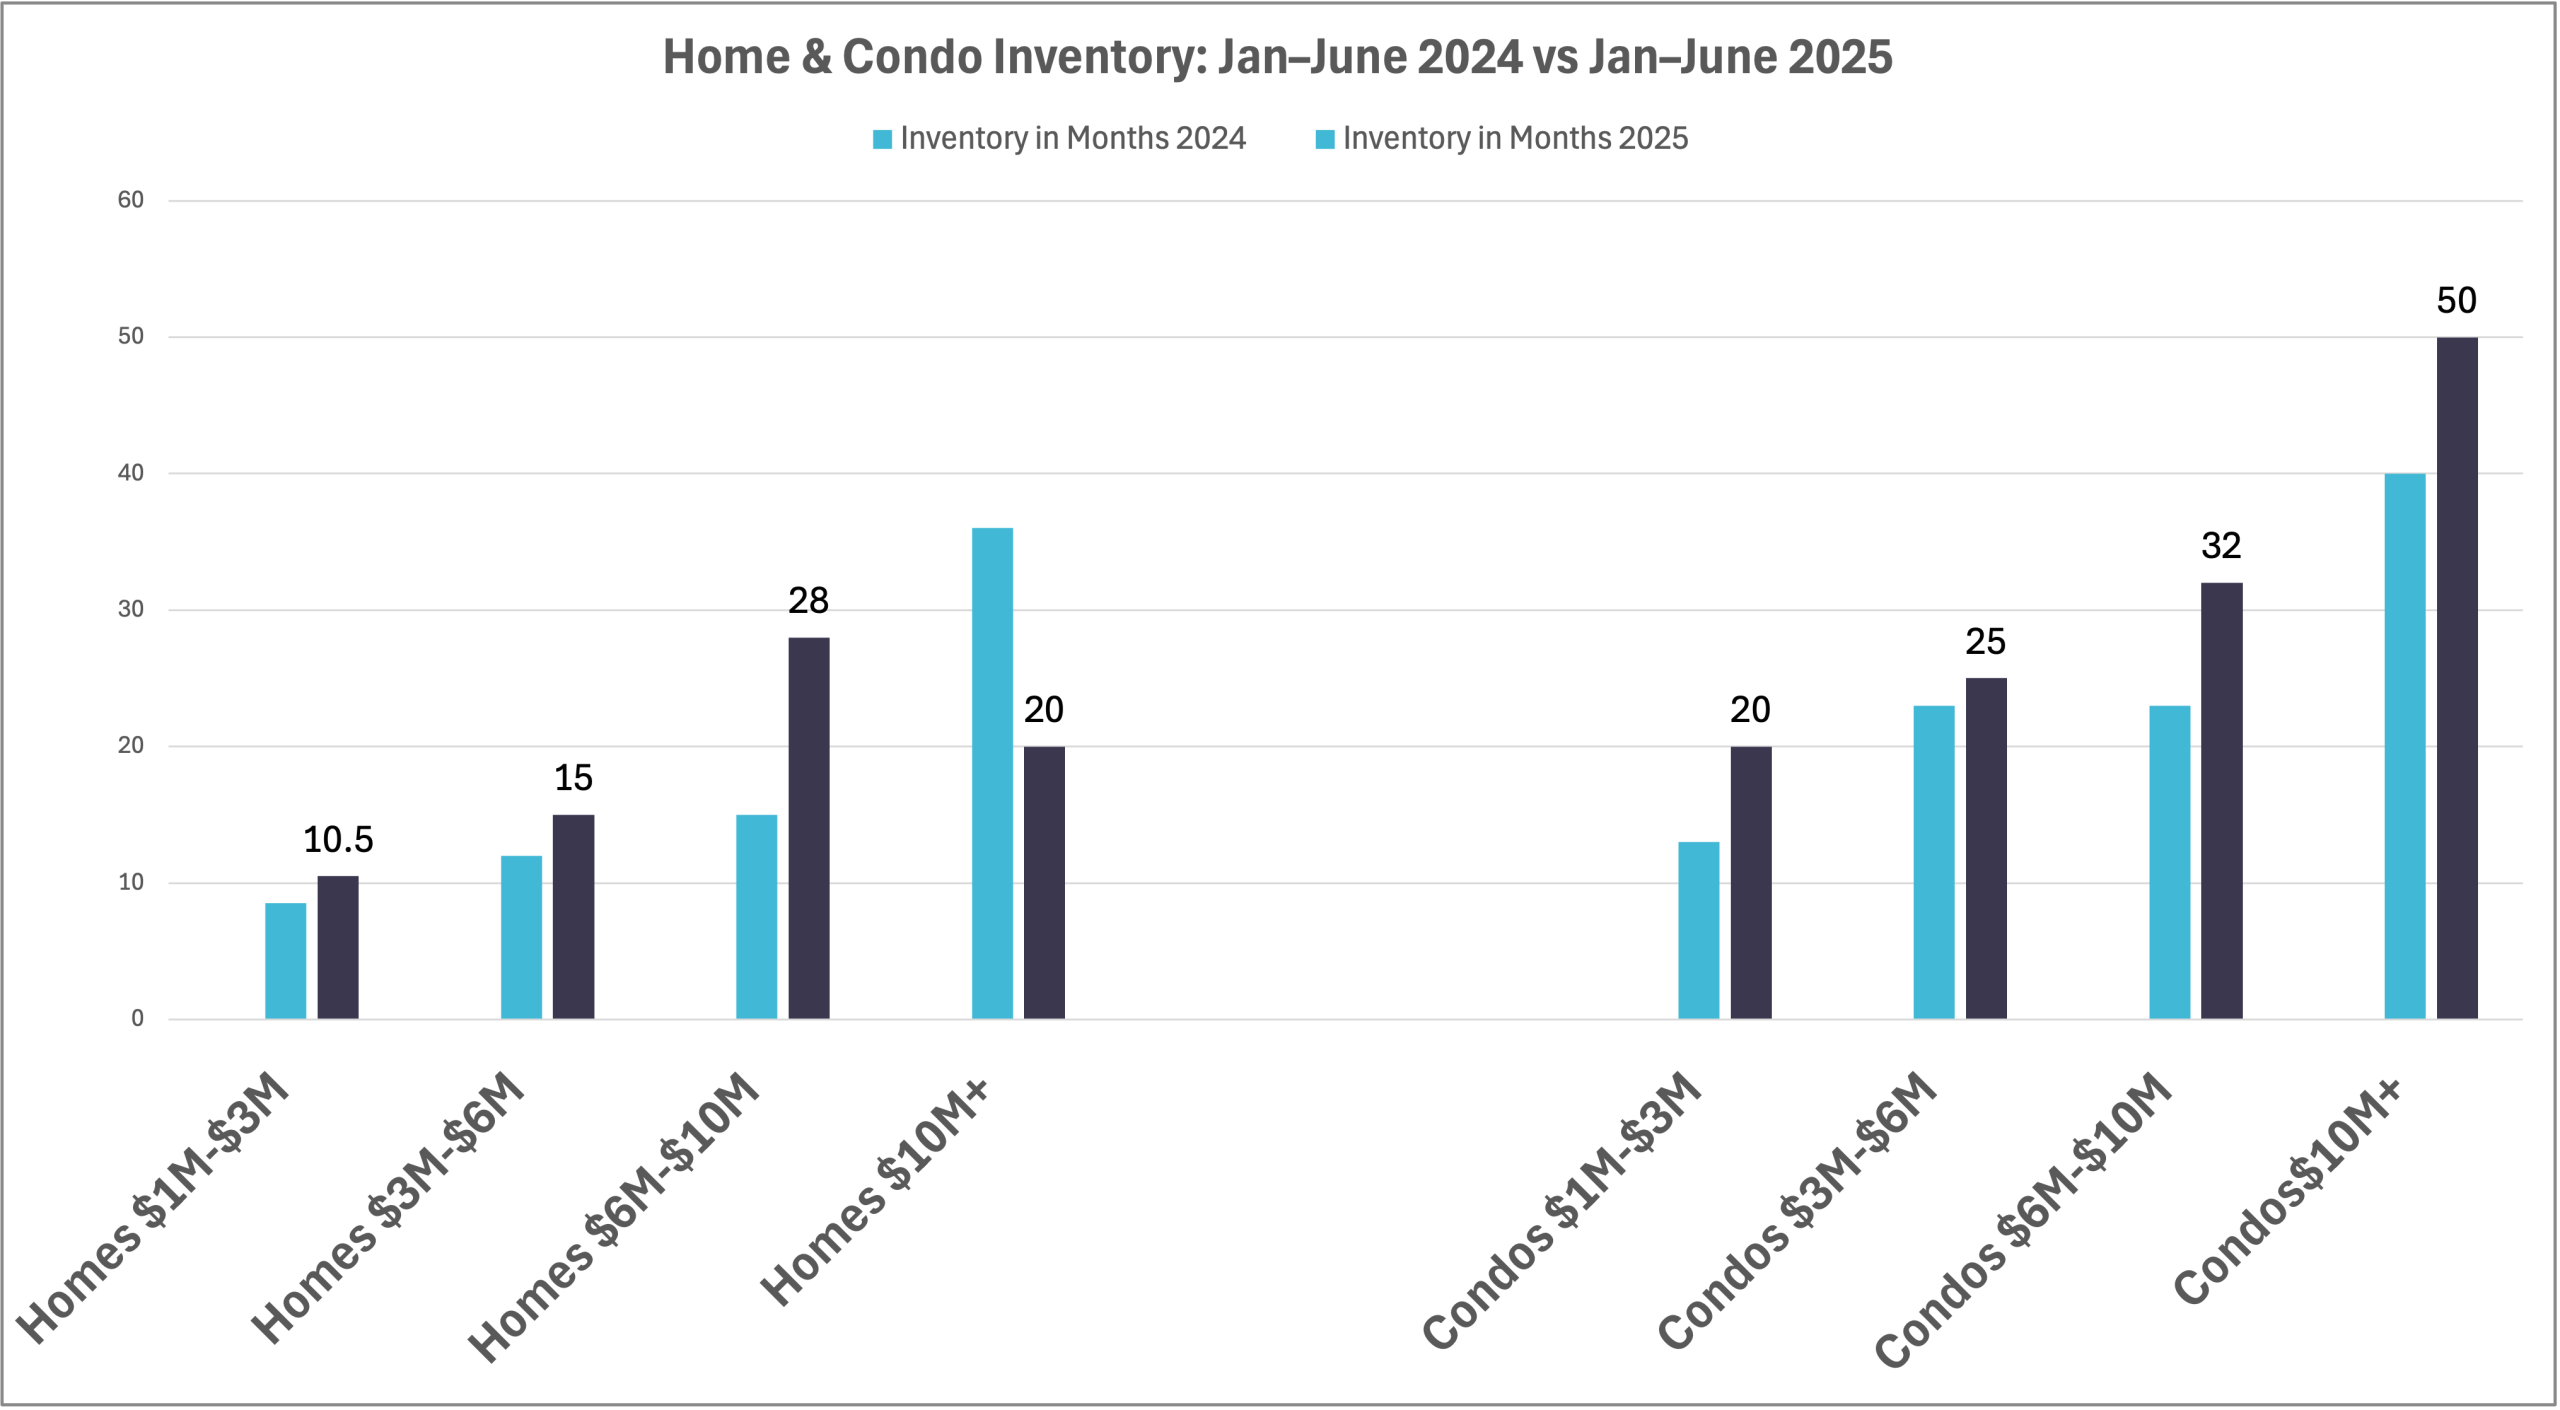
When people say, “I’m seeing more listings,” or “There are more expireds and fewer sales,” they’re not entirely wrong—but they’re not exactly right either. Let’s break it down. At the ultra-luxury level—$10 million and up—inventory has actually decreased significantly, dropping from 36 months to 20 months. So, if you think there’s more $10M+ product out there, think again. But the picture changes as we move down the ladder. In the $6–$10 million range, we’ve gone from 15 to 28 months of inventory. That’s a clear surge. Pinecrest and Miami Beach, for example, are seeing noticeable spikes in supply. In contrast, the mainland has remained tighter. Then we hit the $3–$6 million range, which has crept from 12 to 15 months—an increase, yes, but not a red flag.
Now, let’s be honest about what’s sitting. It’s mostly older, less desirable homes. Meanwhile, high-quality custom homes are flying off the market—at asking price, with backup buyers waiting. Why? Because there’s a finite supply of great custom product, and it’s only getting more expensive to build. Spec homes, on the other hand, often miss the mark. Too many builders are cutting corners, and buyers see right through it. They’re not paying Bentley prices for a Honda experience. At the $1–$3 million level, inventory remains low—about 10 months—still technically a seller’s market. But don’t get cocky. Buyers are cautious. They’re not overpaying, and they’re definitely not setting new records. Sellers: price realistically. Buyers: yes, interest rates are high, but that’s exactly why you can find better deals now—refinance later. Date the rate, marry the house.
CONDOS
That’s a different beast. In the $10M+ segment, inventory has jumped from 40 to 50 months. In the $6–$10M range, it surged 39%—from 23 to 32 months. Sellers in this segment: be realistic. Even in great buildings like Oceana, the Ritz, or Four Seasons, overpriced units just sit. No one wants to hear it, but this isn’t about feel-good advice. This is about helping you avoid wasting time. In the $3–$6 million condo market, supply ticked up slightly from 23 to 25 months. The $1–$3 million segment? That’s where things get really sensitive to interest rates. Inventory jumped from 13 to 20 months. A lot of this is investor-grade product, and with falling rents, the returns are shrinking—so is buyer appetite. Ultimately, cash is king right now. Many are sitting on the sidelines, ready to act when they see real opportunity. That’s the current state of inventory—and it’s why generalizations will lead you straight into poor decisions.
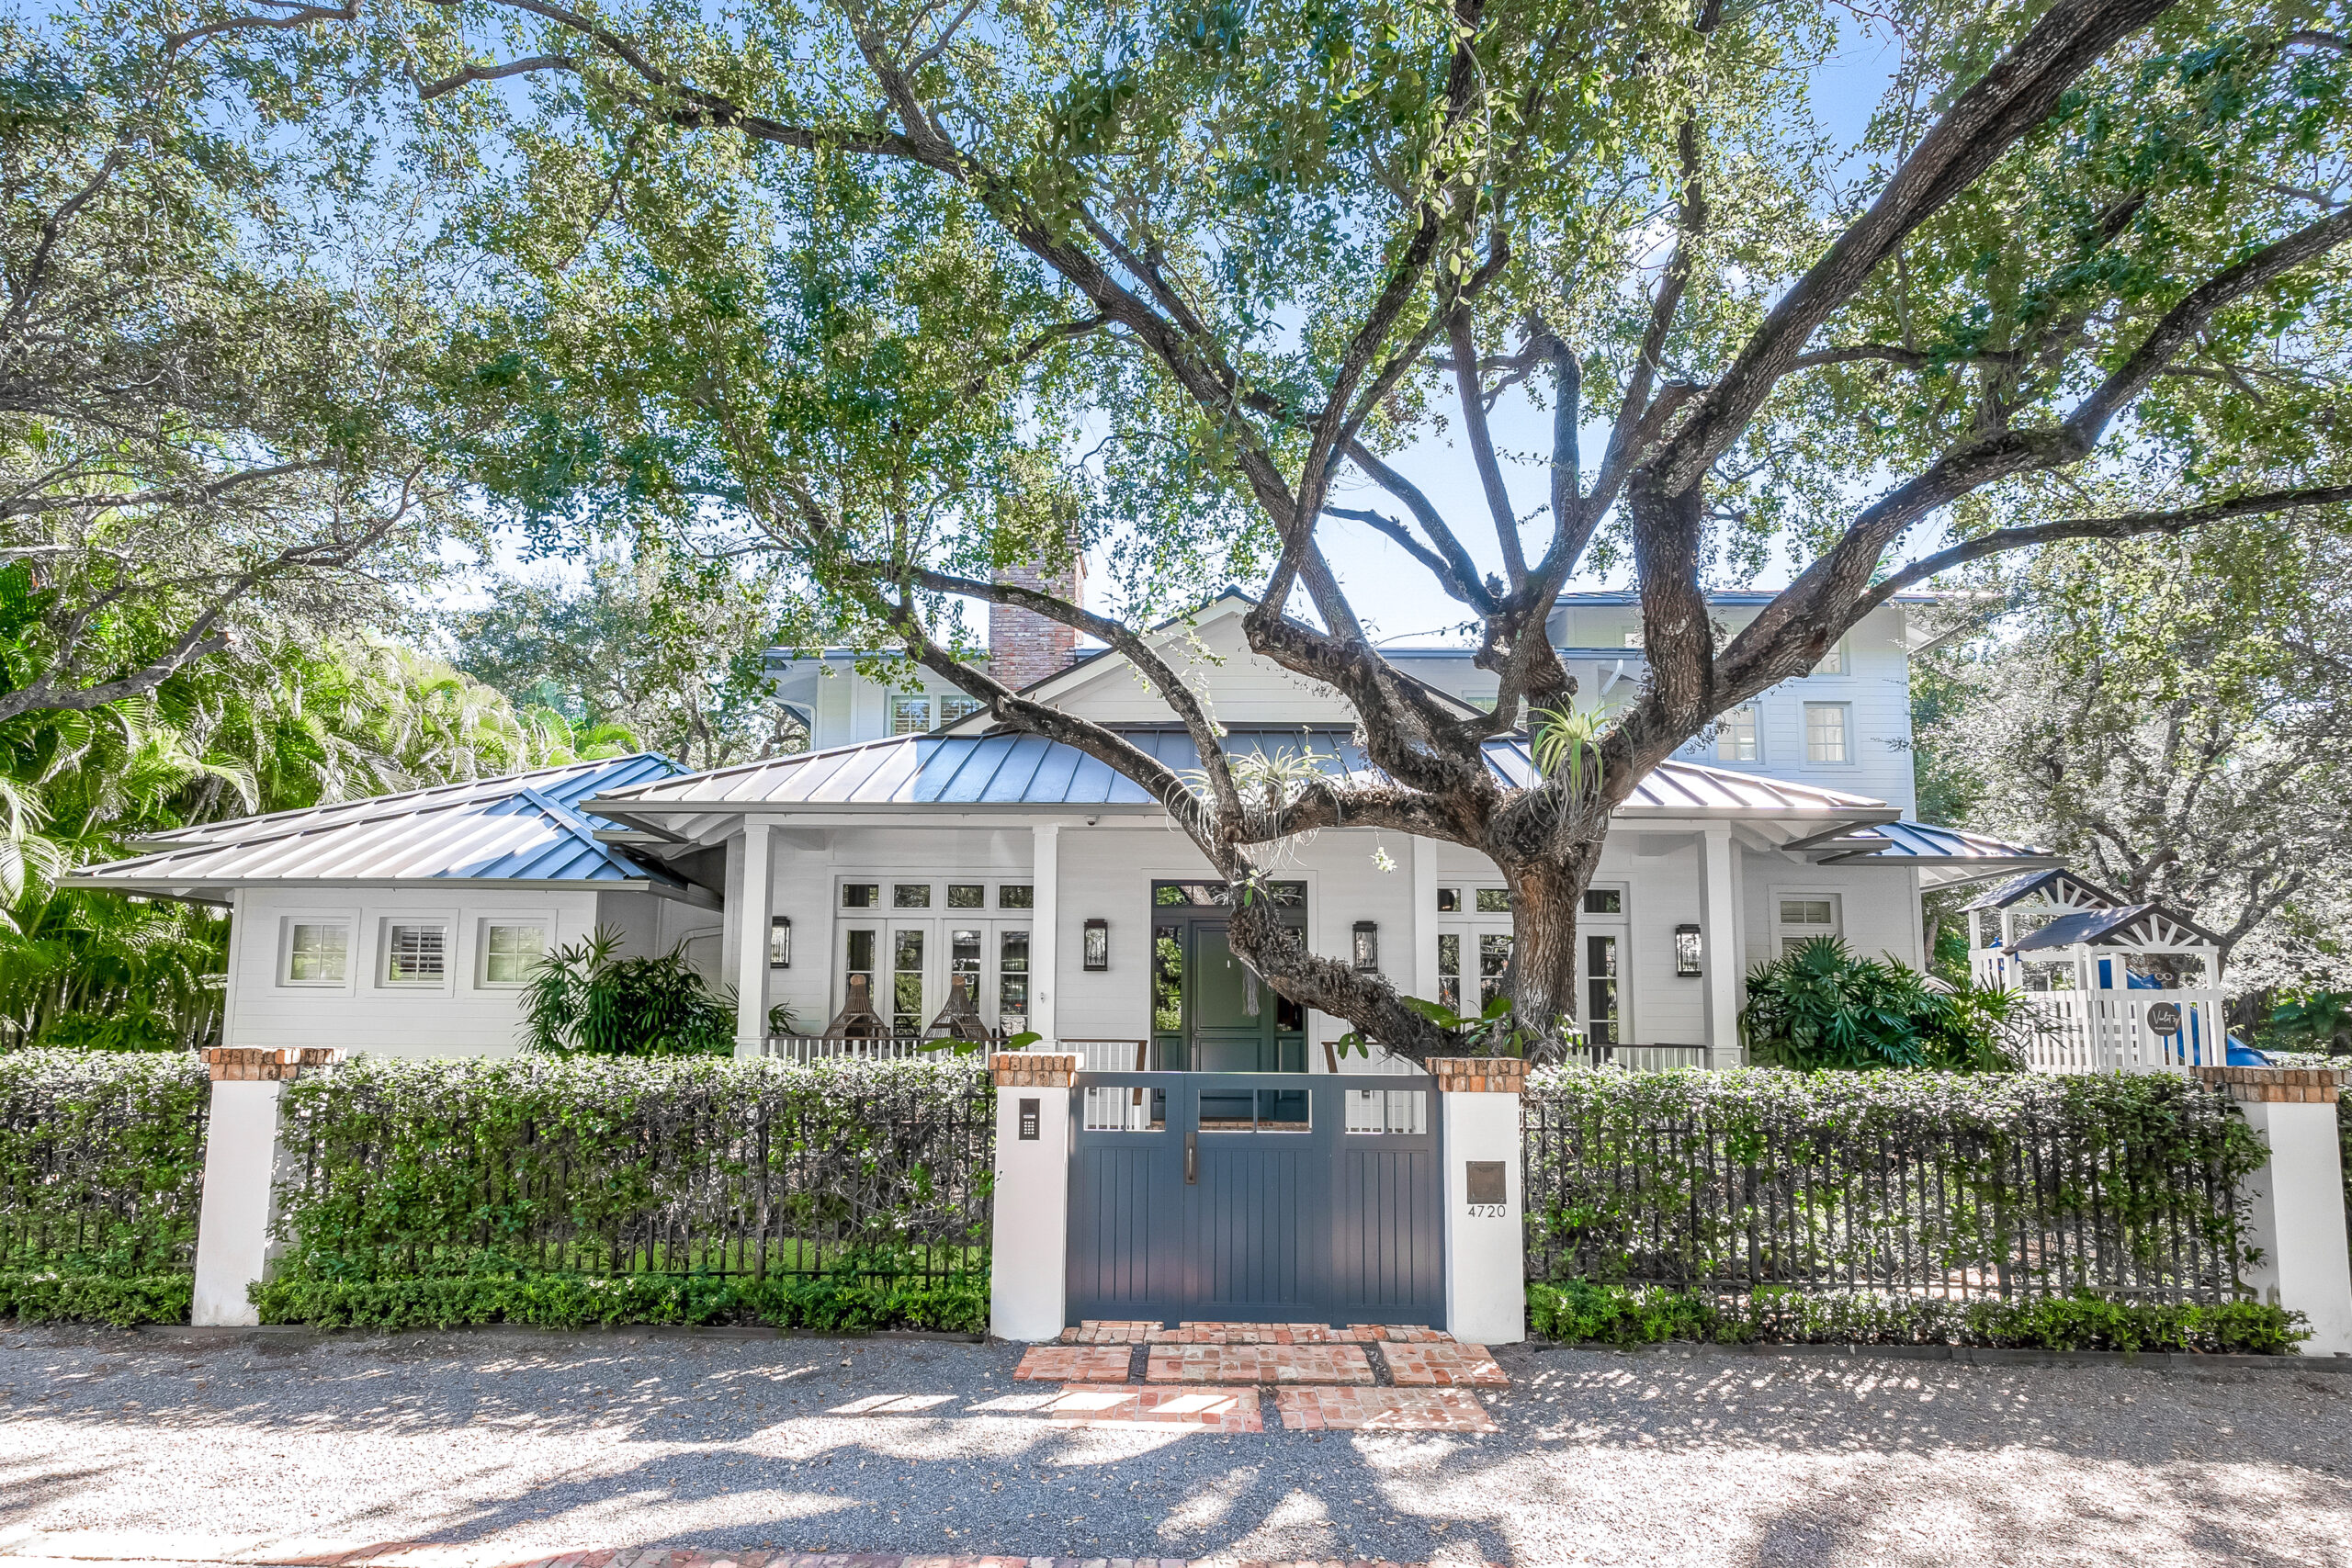
2025 Miami Real Estate Market: Buyers may have the luxury of waiting, but when a well-finished property hits the market—like our recent Ponce Davis listing—it tends to sell within a week
3. Is it a buyer’s or seller’s market right now — and is that shifting?
HOMES
- $10M+ homes: Leaning toward a seller’s market—good product moves fast with little negotiation. However, many listings are overpriced by aspirational sellers. If it’s truly exceptional, it still commands attention.
- $6M–$10M homes: Clearly a buyer’s market. Lots of inventory, more negotiation power. If a seller won’t deal, move on—there’s more coming.
- $1M–$6M homes: Statistically closer to neutral, but many neighborhoods still favor buyers.
CONDOS
- $10M+ condos: Inventory is rising—shifting to a buyer’s market.
- $3M–$10M condos: Already a buyer’s market. Longer days on market, more price drops.
- $1M–$3M condos: Demand is softening, especially in Brickell, Downtown, and Edgewater. If you’re selling, be aggressive on price or risk sitting.
Key advice:
Don’t wait for a crash—it’s unlikely. But do be selective. Some buildings face steep HOA hikes, special assessments, or are even blacklisted by lenders. And remember: overpriced homes don’t sell. We focus on realistic pricing, which is why we’ve had one of our best years in sales.
4. How quickly are homes selling compared to late 2024
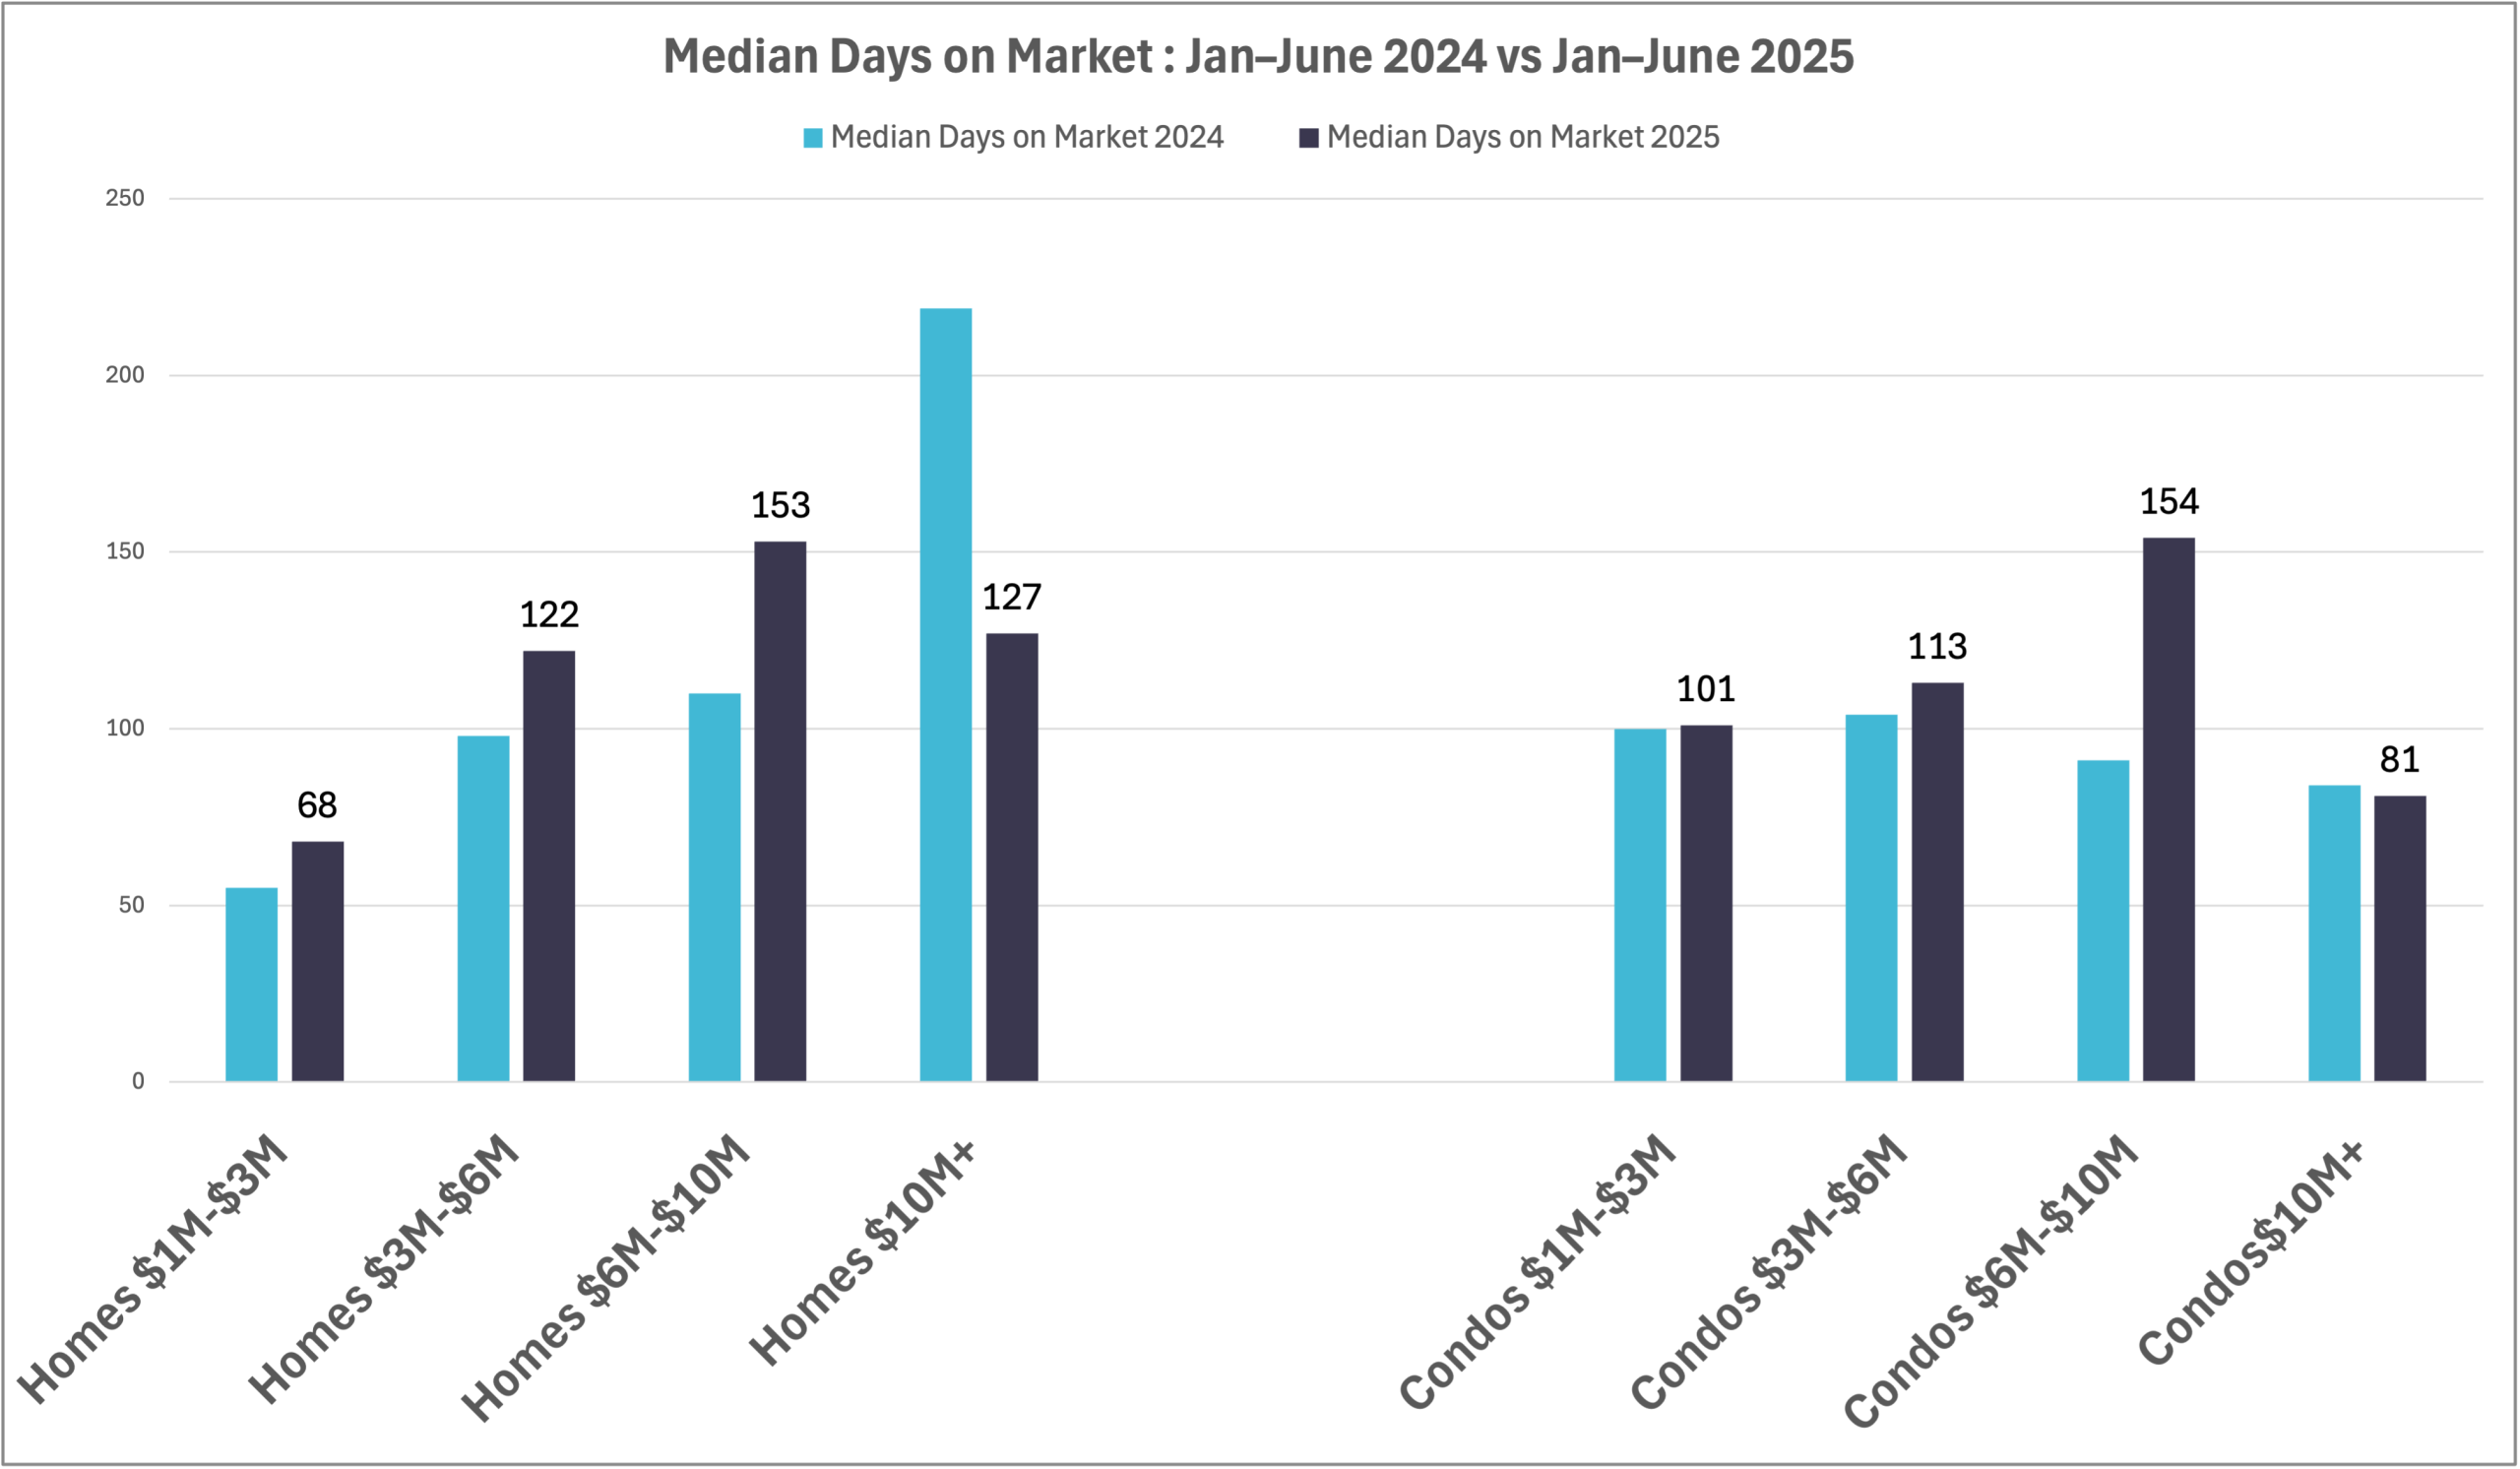
It all comes down to pricing. Right now, the market is still saturated with overpriced listings. Many sellers aren’t pricing their homes correctly—or aren’t being advised properly—and as a result, days on the market are growing across most segments. The exception? The $10M+ market, where days on the market have actually dropped—from 219 to 127 for homes, and from 84 to 81 for condos. This is surprising, given how niche that buyer pool is. By contrast, days on the market are climbing in all other price brackets with the $6M–$10M segment being the weakest segment, with housing days on market rising from 110 to 153 (a 40% increase).
The takeaway: the $10M+ segment is outperforming, while most other markets are slowing down. If you’re thinking of selling, understanding your price point—and how it impacts your days on market—is critical.
5. Are we seeing longer listing periods?
HOMES
The market is showing a clear divide. The $10M+ ultra-luxury segment is the strongest performer, with renewed demand, quicker sales, and minimal discounting. But below that, activity slows. In the $6M–$10M range, many homes sit over five months, and sellers are making deeper cuts under pressure. From $3M–$6M, rising inventory and a drop in the close-to-list ratio point to growing buyer leverage and longer timelines. The $1M–$3M segment is also loosening, though more gradually.
CONDOS
In condos, the picture is similar: the $10M+ tier is seeing a sharp 80% surge in expired listings, suggesting overpricing. The $6M–$10M condo range saw a 27% increase in expirations and frequent price reductions, while $3M–$6M condos are staying on market longer and adjusting downward. Even the $1M–$3M condo segment, despite some price increases, is seeing slower absorption and reduced efficiency overall.
6. How aligned are list prices with what’s actually selling or are we seeing increased price reductions
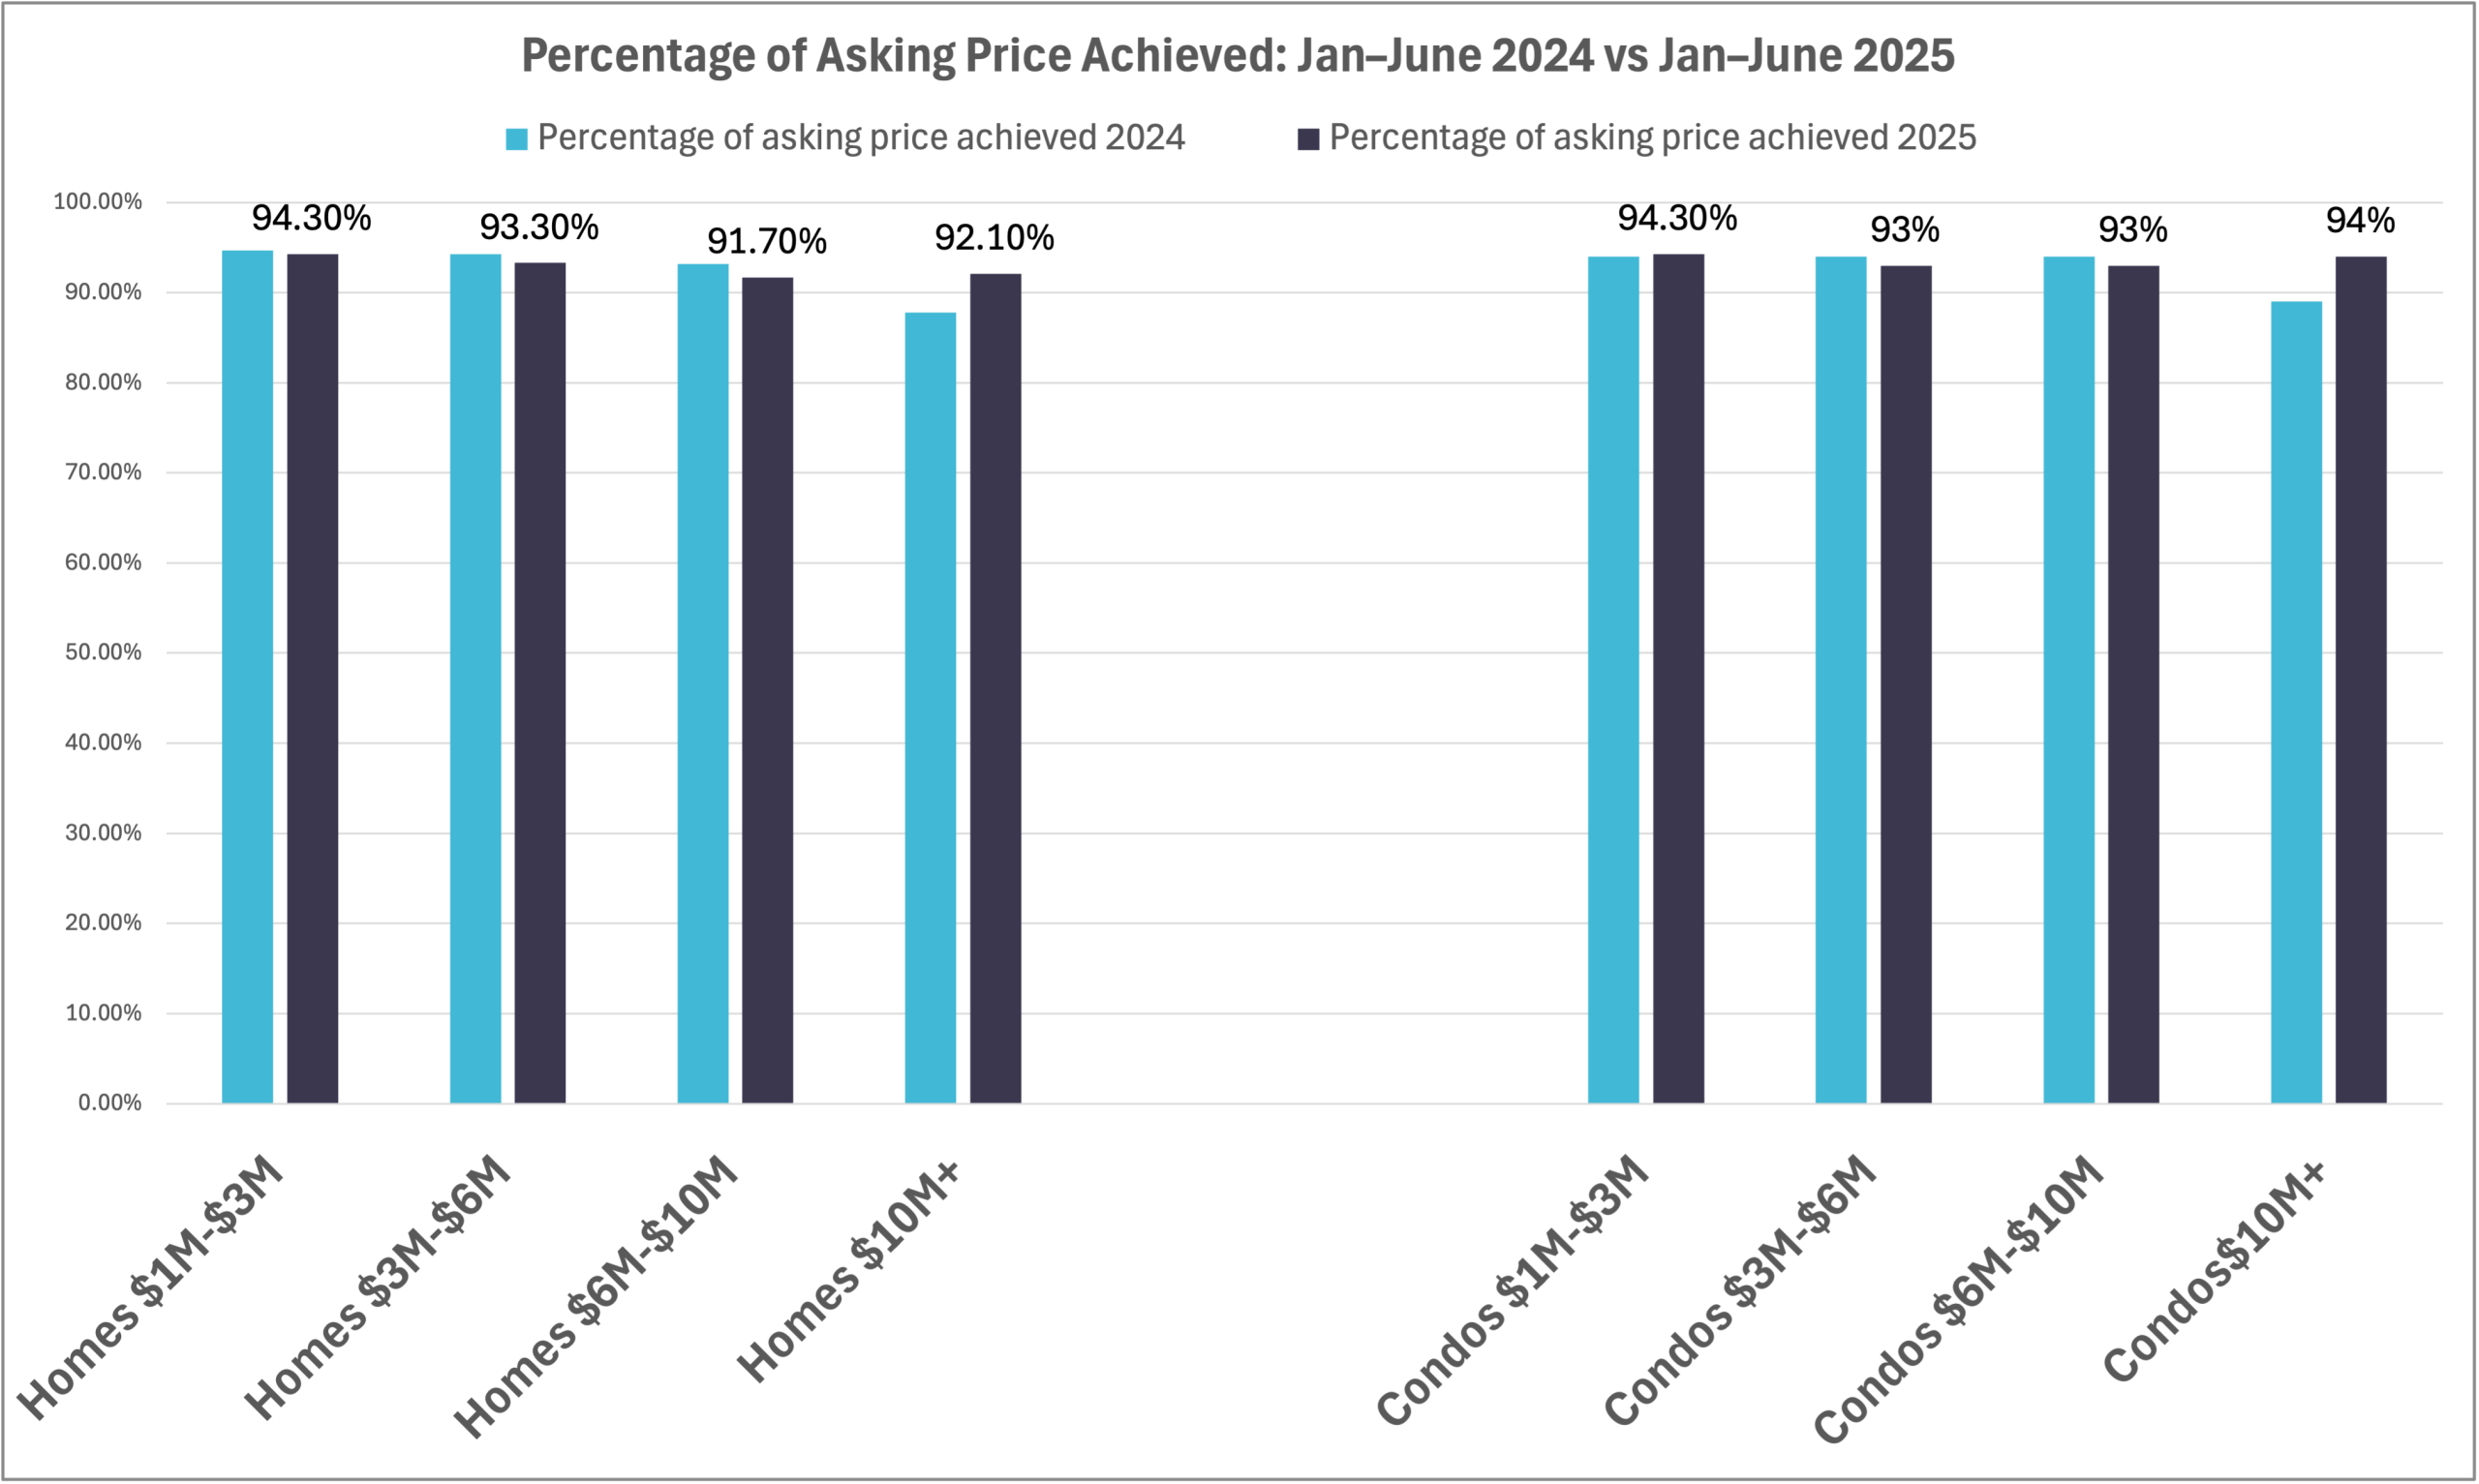
List prices are increasingly out of sync with what’s actually selling. When you see wide gaps between list and sale prices and longer days on market, it’s clear that many sellers are pricing aspirationally, not realistically. While high-quality, custom, well-finished homes are still selling at last year’s price points, much of the market is misaligned—otherwise, those homes would be moving. Buyers are circling but hesitant, watching the economy, stock market, and inventory levels. April’s market shakeup, triggered by tariff news and a stock dip, added to the uncertainty. The result? More listings are sitting, more sellers are reducing prices, and buyer psychology has shifted to wait-and-see. Still, the ultra-luxury segment is performing well, with fast sales and strong demand. Below that, many homes are sitting for 5+ months and seeing deeper discounts. Expired listings are also surging, particularly in the $10M+ condo market, where many listings are overpriced and sellers are unrealistic.
THE HARD TRUTH: serious buyers waiting too long often miss out. While some think prices will crash, sellers aren’t slashing—they’re adjusting to meet the market. Summer will bring real opportunities as motivated sellers make concessions, especially while others are away. Behind the scenes, negotiability is higher than it appears. If you’re ready to act, this could be your moment.

7. What types of properties are moving fastest — and which are stagnant?
The fastest-moving properties are high-quality, custom homes and condos—especially those meant as primary residences. Buyers want well-designed, well-finished, unique spaces. What’s sitting? Generic, outdated, poorly finished, or cheap properties—particularly in undesirable locations. These are clogging the pipeline and skewing the data. Don’t let clickbait headlines about rising inventory or foreclosures mislead you—they often focus on low-end product that was never in demand to begin with.
To make smart decisions, ignore the noise. Focus on real, granular data that reflects the specific type of property you’re buying or selling.
8. 2025 Miami Real Estate Market | How is the Rental Market Performing?
| SINGLE FAMILY HOMES | ||||||
| Average Price per SF 2024 | Average Price per SF 2025 | % Change | Rental Volume 2024 | Rental Volume 2025 | % Change | |
| $5K-$10K | $3.02 | $3.02 | - | 352 | 367 | +4.26% |
| $10K-$15K | $4.37 | 4.43 | 1.5% | 61 | 65 | +6.5% |
| $15K-$20K | $5.19 | 5.18 | - | 40 | 39 | -2.5% |
| $20K-$30K | $6.29 | $6.06 | -3.5% | 25 | 26 | +4% |
| $30K+ | $12.13 | $13.75 | +13.5% | 19 | 26 | +37% |
| CONDOS | ||||||
| Average Price per SF 2024 | Average Price per SF 2025 | % Change | Rental Volume 2024 | Rental Volume 2025 | % Change | |
| $5K-$10K | $4.67 | $4.75 | +1.7% | 898 | 860 | -4.2% |
| $10K-$15K | $6.27 | $6.00 | -4.3% | 104 | 144 | +38.5% |
| $15K-$20K | $7.56 | $7.95 | +5.2% | 53 | 49 | -7.5% |
| $20K-$30K | $10 | $10.75 | +7.5% | 40 | 52 | +30% |
| $30K+ | $17 | $18 | +5.9% | 36 | 39 | +8.3% |
The rental market is strong at the high and mid-high end. Buyers in the $3M–$10M range are renting luxury homes ($15K–$35K/month) while waiting for the right deal or product. Ultra-luxury rentals ($30K+/month) are booming, driven by high-net-worth buyers who aren’t leaving town but aren’t rushing to overpay either.
The lower end of the market is cooling. Renters in the $5K–$10K/month range—especially in urban cores like Brickell—are pulling back, likely due to inflation and affordability concerns. This softening is also impacting investor returns and pricing in rental-heavy condo markets.
9. Who’s Buying in Miami — And Where Are They Coming From?
While this isn’t a pure data-driven answer, my boots-on-the-ground experience reveals clear trends. The most active buyers today are still coming from New York and California, with many flying in to view properties — but increasingly, they’re already here, having rented and now ready to buy. In the luxury markets I specialize in — Coconut Grove, Coral Gables, Pinecrest — we’re also seeing steady demand from migratory buyers relocating from other U.S. states. At the ultra-high end, international demand is strong, especially from Europe. Exchange rates play a key role here, and global buyers continue to see Miami as a lifestyle upgrade and sound investment. Calls come in daily from Argentina, Brazil, England, France, and Germany, along with steady inquiries from affluent domestic markets. Miami remains a global city — one of the most desirable in America — and the diversity of its buyer pool reflects that. If you’re a seller, this matters. It’s not just about listing a property — it’s about knowing who your buyer is and how to reach them. That’s why we geo-target and tailor our strategy to capture the right eyes in the right markets. For deeper buyer profiles per area, check our individual neighborhood reports where our territory managers break it all down.
10. How does this market compare to nearby competing neighborhoods?
While this 2025 Miami Real Estate Market focuses on the Miami market as a whole, a more accurate comparison will come from our individual neighborhood reports, which will be released in early June. Those will dive into the specific dynamics of each area. The Miami real estate market can’t be understood as a single, unified trend because each neighborhood behaves differently. While this report gives a broad view, the upcoming individual neighborhood reports—set to release in early June—will provide more specific insights. Within the David Siddons Group, 13 territory managers are constantly in communication, sharing what they’re seeing across areas. This creates a unique advantage because no market operates in isolation—Brickell affects Downtown and Edgewater, just as Coconut Grove influences Coral Gables and Pinecrest. There’s a constant flow of people and demand between neighborhoods, with buyers migrating from the beach to the mainland, from condos to houses and vice versa, or moving based on lifestyle changes like growing families or retirement. This interconnectedness creates a dynamic, living system where shifts in one area impact others. The report avoids dumping raw data and instead focuses on explaining what’s actually happening and why, showing how all the pieces of the Miami market fit together.
Ready to Make Sense of It All? Let’s Talk about the 2025 Miami Real Estate Market
The 2025 Miami real estate market is many things—but simple isn’t one of them. Whether you’re buying or selling, what you do next depends on understanding your exact price point, product type, and neighborhood. That’s why we’ve created individual, hyper-local reports for key areas like Coconut Grove, Coral Gables, Miami Beach, Edgewater, and beyond—so you can see what’s really happening where it matters most.
If you’re serious about making a smart move in this market—whether it’s trading up, downsizing, investing, or cashing out—your next step is a conversation. Call, text, or email us directly. We’ll walk you through the trends that apply to you, not just the headlines. Call me at 305.508.0899 or schedule a meeting via the app below.
FAQ
These are the most commonly asked Google Real Estate Related questions
1. What are the Current Best New Condos in Miami?
If you want to hear in more details our opinions on the best new Miami new construction condos. Please read this article:Best New Construction Condos 2022-2023.
2. What is the best New Construction Condo in Fort Lauderdale?
In our opinion, the Residences at Pier Sixty-six are certainly the most interesting and unique. Already well underway this 32 Acre project will be home to the first of its kind Marina where owners will be able to anchor up vessels up to a staggering 400 ft! For specifics of this project see our independent review of this project.
3. How can I compare the new luxury construction Condos to the best existing Luxury Condos in Miami?
Our Best Luxury Condos in Miami article will prove to be very useful to those looking to compare the existing to the new. You may also want to watch this video which shows the performance of the best Condos in Miami over the last 15 years!
Please fill in your details and David Siddons will contact you
- Get our Newsletter
- Subscribe
- No Thanks
Get the latest news from Miami Real Estate News
Edit Search
Recomend this to a friend, just enter their email below.
 COMPARE WITH CONDOGEEKS


