- Best of All
- Best Miami Luxury Condos
- Most popular
- Relocating to Miami
- Private Schools
- Investments
- Gated communities
- Waterfront information
- Luxury homes
- Luxury Condos
- New Construction Condos in South Florida
- Independent Pre-Construction condo reviews for Miami
- Independent Pre-Construction condo reviews for Fort Lauderdale
The Pinecrest Real Estate Market Report 2019
The Pinecrest Real Estate Market Report 2019 – The Last 6 Months (April till October 2019)
David Siddons and our Pinecrest real estate expert Cristiane Buzolin spent the week analyzing the Pinecrest real estate market to provide our readers with a clear overview of what has happened in the last 6 months, what trends we are seeing and what we expect from this market in the months to come.
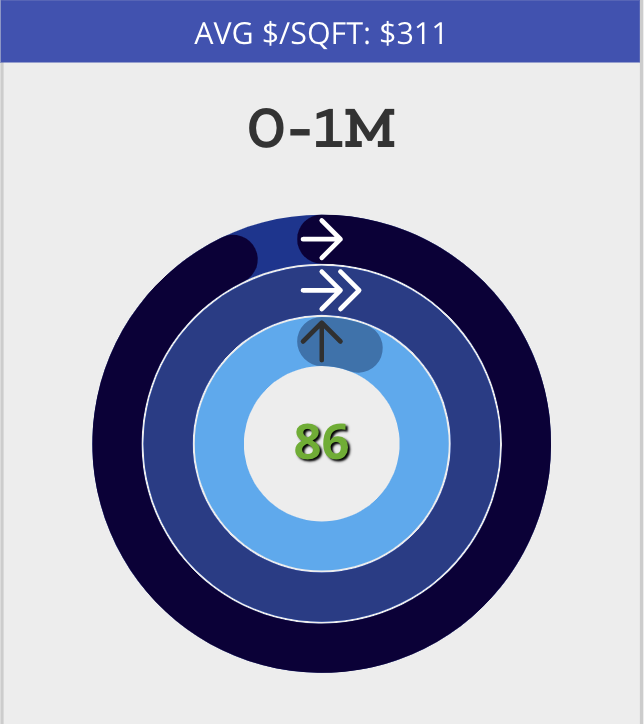
Observations in the Pinecrest Real Estate Market below $1M
Fast Data
- 56 Active properties
- 54 Sales
- 6 months of inventory
What is happening in this market?
The entry point for Pinecrest has a very fast absorption rate and it is a total seller’s market. One very good example of a home that was absorbed very fast is 12120 SW 70th Ct which was under contract in only 11 days (Please refer to the working example below)
The majority of the products that sells up to a million dollar are under $330 per SF and the difference in Pinecrest is that you can get a considerably big lot under $1M. We saw properties with almost 1 acre of lot being traded for around $700,000 in South Pinecrest.
On average, 50% of the properties will get sold in 60 days, which definitely indicates a strong market.
Usually the houses that are getting a higher price per SF are very small houses on bigger lots where there is a demand from buyers to renovate; so basically a land deal, or small renovated homes that sell really fast.
Why is this market so desired?
One important reason here is that you get double the lot size of what you can get in Coconut Grove and Coral Gables for a lot less money and a considerably lower price per SF. Also important to notice is that the public schools in the area are highly rated so families with 3 or more kids that need more space will find their perfect home here.
Advice for Buyers: Be conscious that you are dealing with a hot market and don’t wait too long to put in offers as product sells really fast. Do not expect heavy reductions as the average reduction is merely 10% of the asking price. As a buyer be prepared and have your pre-approval letter ready to go when you need it.
Advice for Sellers: Take advantage of the hot market, but don’t overprice your property as nowadays buyers are a lot more educated and they will not overpay.
Working Example
12120 Sw 70th CT got under contract in only 11 days is. This house has about 3,500 adjusted SF on a nearly 16,000 SF ot.
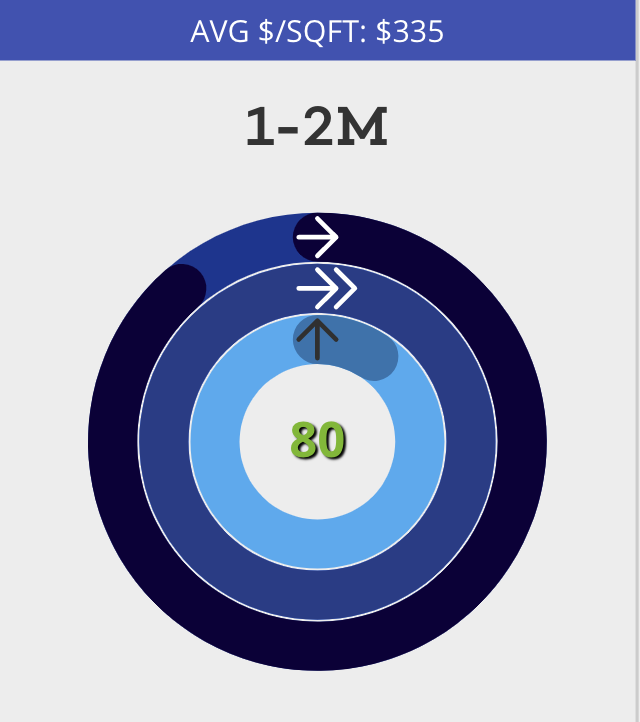
Observations in the Pinecrest Real Estate Market between $1M and $2M
Fast Data
- 93 Active properties
- 65 Sales
- 8.6 month of inventory
- 40% Of the current inventory is on the market for more than 6 months (Well finished homes)
We observed that old Spanish homes need to be priced aggressively or they will take longer to sell. This is exactly what happened to our own listing on 6061 Sw 102nd that was sold with 17% discount of the original asking price. Also, 10040 Sw 60th Ct sold for almost 44% less than its original list price and sold in 136 days. Generally, the average percentage of sales price to list price is 86%.
The highest dollar per SF achieved in the neighborhood was $510 per SF for the property on 10025 Sw 58th Av; this is a nicely done – completely renovated custom home in North Pinecrest.
Why is this happening?
Again, families that need more space or want to be closer to the best schools will have more choices here than in Coral Gables and Coconut Grove and the price per SF is relatively lower than in those areas, between $400 to $460 per SF
Advice for Buyers: The product is out there, but be smart on your choice, pay attention to the location, quality of finishes and don’t overpay just because it is a modern or newer home.
Advice for Sellers: In this balanced market is very important to price the property correctly to not lose momentum.
Working Examples
Our listing on 6061 Sw 102nd was sold in 132 days with a 17% discount of the original asking price.
10040 Sw 60th Ct reflects how those big homes are not selling close to the original asking price. This particular property sold for $1,614,000 almost 44% less than the original list price which was $2,900,000. The property stayed on the market for 136 days.
The highest dollar per SF achieved in the neighborhood was $51o per SF for the property on 10025 Sw 58th Av; this is a nicely done – completely renovated custom home in North Pinecrest.
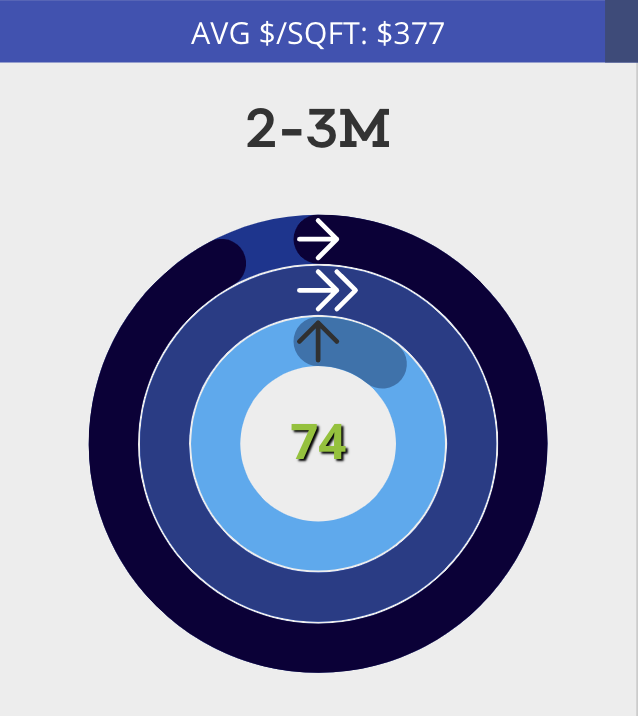
Observations in the Pinecrest Real Estate Market between $2M and $3M
Fast Data
- 35 Active properties
- 19 Sales / 3.1 sales per month
- 11.2 month of inventory
- 60% Of the current inventory stays for more than 100 days on the market
- 25% Of the current inventory stays on the market for more than 6 months
73% Of the properties that closed in this price range offer 5+ bedrooms and are located on a 20,000 SF+ lot. This indicates the size of properties that Pinecrest has to offer.
We recorded an average discount on the list price of 10%. The highest drop between listing and sales price was seen at 5825 Sw 128th. This property sold for 22% less than asking price. The home was sold in less than 30 days even though it is not the most desired architectural style with buyers at this moment.
The average sales price per SF is $390, while the highest dollar per SF achieved was $513 on a total new construction and prime location in North Pinecrest
Advice for buyers: If you want a large (¾ to a full acre) lot and a house between 5,000 to 8,000 SF, there is product that has been on the market for a long period of time and sellers tend to be more willing to negotiate. Be aware to pay significantly less for a home on a busy street.
Advice for sellers: The market isn’t terribly weak, but it is not strong either so be realistic on your price and be careful if you are asking more than $400 per SF for an older construction.
5825 Sw 128th was the most discounted property (Sold for 22% less than the asking price). Even though buyers prefer contemporary style homes these days, this property got sold in less than 30 days.
This total new construction home on 10625 SW 73rd Ave was sold for $513 per SF. The homes offers 4,000 SF on a 25,000 SF
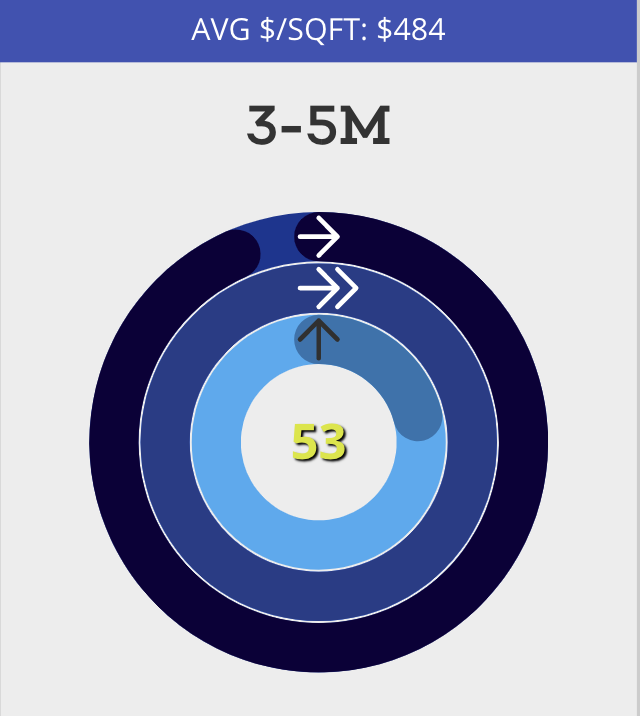
Observations in the Pinecrest Real Estate Market between $3M and $5M
Fast Data
- 42 Active Properties
- 13 Sales
- 20 Months of inventory
What is happening in this market?
This segment of the market definitely slowed down and there have been some heavy price reductions, one example is 6080 Sw 104th St that was originally listed in 2015 for $5,299,999 and sold in 2019 for $3,399,000 ($397 perSF)
The highest dollar per SF achieved was $589 on a contemporary home (6801 Sw 92nd St) from 2017. This 7,600 SF property was extremely well done and sitting on an almost 1 acre lot in North Pinecrest.
Why is this happening?
Most of the inventory are Old Spanish and Mediterranean homes that are most definitely out of vogue and at this price range the competition with gated communities in desired areas like the Gables and the Grove is massive.
Advice for buyers: This is definitely a ‘back-end heavy market’, which essentially means there is a lot of overpriced product that is not moving. Do not be sucked into paying a high price per SF and appreciate that sellers will be hurting to sell more often than not. We expect to see further reductions and an ‘ awakening ’ to the market’s reality as we move into 2020.
Advice for sellers: Price your home according to our guided price per SF or suffer from this soft market. We cannot stress enough that in times of high inventory and low sales buyers want fair market price or better. Make sure your house presents well and never sell an empty, un-staged home! Finally, unless your home is superbly finished it is statistically far more difficult to sell in South Pinecrest (below 112th St) than in North Pinecrest.
The highest dollar per square foot achieved was $589 for this contemporary home on 6801 Sw 92nd St. This 7,600 SF property was extremely well done and sitting on an almost 1 acre lot in North Pinecrest
6080 Sw 104th st was originally listed in 2015 for $5,299,999 and sold in 2019 for $3,399,000 ($397 per SF)
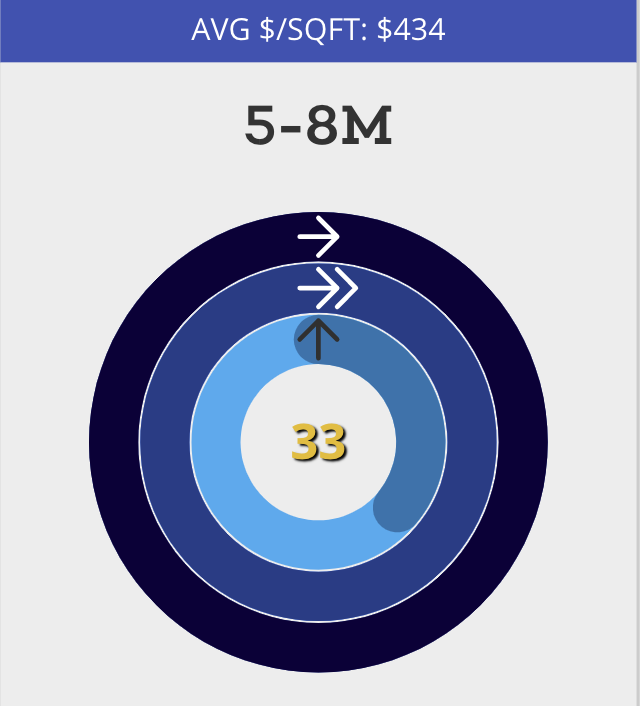
Observations in the Pinecrest Real Estate Market of $5M+
Fast Data
- 12 Active properties
- 1 Closed sales
- 72 Months of inventory
What is happening in this market?
The only sale was 9121 Sw 62nd Ct, a ultra modern, new construction in North Pinecrest with 14,989 SF of living space on a 1 acre+ lot that came to the market in December 2017 for $7,500,000 ($500 per SF). It did not get sold the first time around and was rented for $35,000 per month almost one year later. This property came back to the market in march 2019, listed for $6,750,000 and sold 6 months later for $6,499,000 ($433 per SF).
Why is this happening?
It is very hard to sell homes with over 7,000 Sf of living area as the modern lifestyle does not require all these formal spaces anymore. Also at this price range we are competing with waterfront homes, specially in Coral Gables where in the last 6 months 19 sales were recorded in this price range of which 17 were waterfront homes.
Advice for buyers: This is a total buyer’s market, expect huge reductions and be aware of not overpaying for homes over 7,000SF as for these massive homes, the price per SF drops drastically.
Advice for sellers: Get super aggressive! This is a hard market to compete in, given that you have a lot of product in exclusive Coral Gables communities such as Cocoplum, Snapper Creek, Ponce Davis, Journey’s End and Gables States.
9121 Sw 62nd Ct listed for $6,750,000 and sold 6 months later for $6,499,000 ($433 per SF).
FAQ
These are the most commonly asked Google Real Estate Related questions
1. What are the Current Best New Condos in Miami?
If you want to hear in more details our opinions on the best new Miami new construction condos. Please read this article:Best New Construction Condos 2022-2023.
2. What is the best New Construction Condo in Fort Lauderdale?
In our opinion, the Residences at Pier Sixty-six are certainly the most interesting and unique. Already well underway this 32 Acre project will be home to the first of its kind Marina where owners will be able to anchor up vessels up to a staggering 400 ft! For specifics of this project see our independent review of this project.
3. How can I compare the new luxury construction Condos to the best existing Luxury Condos in Miami?
Our Best Luxury Condos in Miami article will prove to be very useful to those looking to compare the existing to the new. You may also want to watch this video which shows the performance of the best Condos in Miami over the last 15 years!
Please fill in your details and David Siddons will contact you
- Get our Newsletter
- Subscribe
- No Thanks
Get the latest news from Miami Real Estate News
Edit Search
Recomend this to a friend, just enter their email below.
 COMPARE WITH CONDOGEEKS


