


- Best of All
- Best Miami Luxury Condos
- Most popular
- Relocating to Miami
- Private Schools
- Investments
- Gated communities
- Waterfront information
- Luxury homes
- Luxury Condos
- New Construction Condos in South Florida
- Independent Pre-Construction condo reviews for Miami
- Independent Pre-Construction condo reviews for Fort Lauderdale
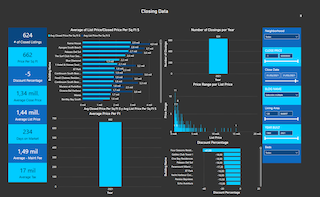
The Miami Neighborhood Economic Health Meter | An Exclusive New Tool to Measure Your Area’s Economic Health
What is the Neighborhood Economic Health Meter?
The David Siddons Group developed this tool as an index to measure a neighborhood’s economic health. Using the human body as the perfect metaphor, you can measure a person’s health, but you cannot guarantee someone will always stay healthy. This neighborhood health score indicates the current economic health of an area and its likelihood to fall ill or to be susceptible to illnesses. So this score does not predict the future, it merely provides the current status of a market and provides you with an indication of the market’s defense mechanism aka: its strength to process future hits. It is not about bear or bull markets. It’s about the market’s elasticity; about robustness and resilience of the market against economic change. A low score can present a world of opportunities at the right offer.
We used the below real estate indicators to measure the Neighborhood’s Economic Health Score:

Real Estate Indicators Explained
Below we explain for each indicator why that indicator /category is important for the health score and how me measure the category

Months of Inventory
The months of inventory is a very important indicator in real estate. It shows the relationship between supply and demand and therewith it indicates how fast a market can digest or absorb product. This is basically the market’s metabolism. If a market cannot absorb new listings for sale, this would be equal to a slow metabolism in the human body. The more bloated we get, the less we can burn, which adds to one’s decreasing metabolism.
Months of Inventory are calculated by dividing the current amount of listings by the average amount of sales per month (Based on the last 12 months). The final amount of months of inventory was then given a score on a metric scale between 0 and 100

Changes in Sales Prices per SF
Prices can go up and down, just like your hear beat. Small price changes, just like changes in your heart rate, will not impact a market. If other market conditions are optimal, these changes will correct itself. If the rest of the market is not in equilibrium, the prices are less likely to correct themselves easily. An increased heart beat can be handled easily by your body, but if your heartbeat goes up a lot and you are obese (High inventory levels in a market), then this might lead you to collapse or get a heart attack. There is a optimum range for everything and extreme high or low price levels, supported by other healthy variables, will be able to correct themselves. Miami is known for its dynamic cycles, with booms and bursts. Some markets go hard, reach the top and they explode.
Moral of this story: It is ok to have an extreme high heart rate or price increases as long as you have a fast metabolism (low inventory levels). Increasing prices and no demand or high supply are a deadly combination.
This category is measured by looking at the price changes between 2018 and 2017. The percentage of change is then given a score to be included to the health score
On another note: Exploding markets also provide us with the opportunity to step in low!

Ratio of Owners to Renters
The ratio of owners to renters is important as this is like your body’s immune system. Neighborhoods occupied mostly by home owners (primary markets) tend to be healthier than markets occupied by renters. Imagine an economic crisis, would you sell your primary property, where you live with your family? Or would you first sell your investment property? Investment-based markets tend to suffer most from economic turmoil and therefore it is important to know the owner to renter ratio in order to establish a health score. Primary markets have a better immune system than investors-based markets.
This number is calculated by dividing the amount of active sales by the amount of active rentals.

Months of Inventory for Rentals
The months of inventory is a very important indicator in real estate. It shows the relationship between supply and demand and therewith it indicates how fast a market can digest or absorb product. It is important for the sales market but also for the rental market. This is basically the market’s metabolism. If a market cannot absorb new listings for rent, this would be equal to a slow metabolism in the human body. The more bloated we get, the less we can burn, which adds to one’s decreasing metabolism.
Months of Inventory are calculated by dividing the current amount of listings by the average amount of rentals per month (Based on the last 12 months). The final amount of months of inventory was then given a score on a metric scale between 0 and 100
The Final Score; The Neighborhood’s Economic Health
The score card goes from 1 till 100. 100 Will be an impossible number, this will never happen and the market is too good. A market with score 75 is a really good market worth buying into. In less healthy markets we still have healthy product and it all depends on the price. For many investors, these markets offer excellent opportunities to get top product for a discounted price.


The score provided here is an average of all the different scores within a neighborhood. We gave each of the 5 price ranges per neighborhood a score and took the average from these 5 scores. The different price ranges might vary significantly in score. Furthermore, each score comes with an explanation to put things into perspective. Please sign up for our 2019 Miami Real Estate Forecast to receive all the details on these different health scores.
FAQ
These are the most commonly Miami Real Estate Related questions
What should relocation buyers know before buying real estate in Miami?
HOME BUYERS
Relocation buyers looking at homes in Miami should understand that choosing the right house is less about the property itself and more about location, schools, and long-term value. Many buyers make the mistake of focusing on price or finishes, while the real driver of value is the neighborhood and micro-location. Older homes often represent better value, but may also be part of a future redevelopment cycle. Newer homes command premiums, but don’t always sell faster if pricing is ahead of the market. Commute time, school access, and community dynamics are critical and often underestimated. The key is to evaluate homes not just as lifestyle purchases, but as long-term assets within a very localized market.
Sources:
https://luxlifemiamiblog.com/relocating-to-miami/
https://luxlifemiamiblog.com/relocating-to-miami-with-a-family/
CONDO BUYERS:
Relocation buyers should understand that Miami is a highly segmented, building-driven market, not a uniform one. Pricing can vary significantly between similar properties depending on building quality, layout, and financial health. Many buyers assume newer construction equals better investment, but that is often not the case. Factors like HOA fees, reserves, and rental policies can materially impact long-term value and liquidity. Negotiation opportunities often exist, especially in slower segments, but require precise market knowledge. The key is to evaluate micro-markets and individual buildings, not just neighborhoods or price per square foot.
Sources:
https://luxlifemiamiblog.com/miami-real-estate-market-report/
https://luxlifemiamiblog.com/new-construction-miami-guide/
What are the best areas for relocating families with children
For families relocating to Miami with young children, the most recommended neighborhoods are Coral Gables, Coconut Grove, and Pinecrest. Coral Gables offers the best balance of top schools, safety, and long-term value. Coconut Grove is ideal for younger families seeking walkability, greenery, and a lifestyle-driven environment. Pinecrest provides larger homes, excellent schools, and better value for space, making it ideal for growing families. The key driver across all three is access to strong schools and primary residential stability. Relocation decisions are less about new construction and more about long-term livability and resale strength.
Sources:
https://luxlifemiamiblog.com/best-neighborhoods-miami/
https://luxlifemiamiblog.com/what-are-the-best-family-neighborhoods-in-miami-in-2023/
Are new construction condos in Miami a good investment?
New construction condos in Miami can be a good investment—but only if you understand that not all buildings perform the same. According to the David Siddons Group, many buyers assume “new = better,” but in reality, performance depends on pricing, layout, building quality, and long-term demand. Some new developments set future price benchmarks and can drive long-term appreciation, especially in top-tier projects. However, many are priced aggressively at launch, and buyers relying on marketing instead of data often overpay.
The market is highly segmented, meaning two new buildings next to each other can perform very differently.
The best opportunities typically come from selecting the right building early or negotiating correctly in later phases.
In short: new construction is not automatically a good investment—it becomes one only with building-level analysis and disciplined entry pricing.
Sources:
https://luxlifemiamiblog.com/how-to-buy-a-luxury-condo-in-miami/
https://luxlifemiamiblog.com/category/independent-new-construction-condo-reviews/
https://luxlifemiamiblog.com/beyond-clickbait-real-insights-into-miamis-luxury-condo-market/
Why is buying a Miami condo riskier than buyers think?
Buying a Miami condo is often riskier than buyers expect because the true risks are at the building level—not visible in the listing price. Many buyers focus on finishes and views, while overlooking HOA reserves, insurance exposure, and potential special assessments. In reality, two identical units in different buildings can perform completely differently over time. Rising HOA fees and stricter regulations are also increasing the true cost of ownership, especially in older buildings. Liquidity can be affected by factors like financial health, rental policies, and ongoing repairs. The key risk is not the condo itself—but buying into the wrong building without proper due diligence.
Sources:
https://luxlifemiamiblog.com/how-to-buy-a-luxury-condo-in-miami/
https://luxlifemiamiblog.com/miami-condo-market-risks/
What are Miami's Safest Areas?
Which Miami Areas Still offer Great Value (Budget Friendly alternatives to Coral Gables and Pinecrest)
If you’re looking for better value than Coral Gables or Pinecrest, the answer (in true Siddons style) is not “go cheaper”—it’s go one layer outside the obvious markets.
The strongest value plays are:
- Schenley Park → closest substitute to Coral Gables at ~20% discount while maintaining similar character and location
- Biltmore Heights → almost identical feel to the Gables but ~25–30% cheaper on a $/SF basis
- Glenvar Heights → central location with larger lots and ~25% pricing advantage vs South Miami/Gables
- Baptist / Galloway (Kendall) → Pinecrest-style living (space, schools, land) at up to ~30% lower pricing
The pattern is consistent:
👉 Buyers are shifting west and slightly off-market to gain land, scale, and pricing efficiency. You don’t find value by going to a “cheaper neighborhood”—you find it by identifying adjacent micro-markets that offer the same lifestyle fundamentals without the brand premium.
Sources:
https://luxlifemiamiblog.com/best-value-neighborhoods-miami/
https://luxlifemiamiblog.com/category/miami-neighborhoods/
Is NOW a good time to buy in Miami?
Are Miami real estate prices going down in 2026?
No—but that’s the wrong way to look at it. Miami is not one market anymore, so prices are not moving in one direction. In 2026, the market is split into two: ultra-luxury, scarcity-driven areas (like waterfront and top-tier neighborhoods) are still holding or even rising, while mid-tier condos and oversupplied segments are flat or correcting. What we’re seeing is price divergence, not a crash—some properties are gaining value while others are quietly adjusting downward. Rising inventory and more selective buyers are putting pressure on pricing in certain segments, especially older condos or buildings with weaker fundamentals.
At the same time, global wealth and cash buyers continue to support pricing at the top end of the market. So the real answer: prices aren’t broadly dropping—they’re being repriced based on quality, location, and supply.
Should I buy a house or a condo when relocating to Miami?
The decision comes down to lifestyle first, investment second—and most relocation buyers get that backwards. If you want space, privacy, schools, and long-term family living, a single-family home in areas like Coral Gables or Coconut Grove is typically the stronger choice. If you prioritize walkability, low maintenance, and proximity to business districts, a condo in Brickell or waterfront markets makes more sense.
From an investment perspective, homes tend to be more stable, while condos are more building-dependent and cyclical. Most relocation clients underestimate how much building quality, HOA structure, and future costs impact condo performance. The right answer isn’t “house vs condo”—it’s which asset fits your lifestyle AND holds value within its micro-market.
How do I choose the right Miami neighborhood for my lifestyle?
Why are Miami condo prices so different between buildings?
Miami condo pricing varies widely because value is determined at the building level, not just by location. Two buildings next to each other can have major differences in financial health, reserves, HOA fees, and management quality. Buyers also pay premiums for better layouts, views, amenities, and newer construction—but not all “new” buildings perform equally. Factors like rental policies, upcoming assessments, and building reputation can significantly impact resale value. This is why price per square foot alone is misleading in Miami’s condo market. The real driver of value is how that specific building competes within its micro-market over time.
Sources:
https://luxlifemiamiblog.com/how-to-buy-a-luxury-condo-in-miami/
https://luxlifemiamiblog.com/category/independent-new-construction-condo-reviews/
WHY WORK WITH DAVID? THINGS YOU SHOULD KNOW...
For all our analytics we are agents driving some very unique and advanced tech. We Provide a granular and custom experience that empower our clients with the insight and tools to understand the most complex behaviors of any local markets.
-
Analytical
Over 100 reports produced to date
-
Knowledgeable
Over 1800 published articles and counting


Related Articles

The Past, Present, and Future of Brickell Key

Pier Sixty-Six Phase Two

Pagani Residences Lower Penthouse

The Miami Buyer Migration
Miami Zoning Laws Explained: What Every Buyer Must Know Before You Purchase

How much does Claude know about Miami Real Estate?

How We Set a Ponce Davis Record: $2,545 Per Square Foot — and the Playbook Behind It

Ombelle Residences Fort Lauderdale — Flagler Village New Construction Condos 2026
The 5 Best Condos in Bal Harbour & Surfside 2026 (And 2 Condos to Avoid)

The Best Condos in Fort Lauderdale for 2026 — And 3 Condos to Avoid
The 5 Best Condos in Aventura 2026 (And 3 Condos to Avoid)

The Ritz-Carlton Residences Fort Lauderdale Beach: Why This Project Deserves a Serious Look in 2026

The 5 Best Condos in Sunny Isles Beach 2026 (And 3 to Avoid)

Pinecrest vs Palmetto Bay luxury real estate: Why Luxury Buyers Are Moving South
Please fill in your details and David Siddons will contact you
Search related videos

Investing in Miami’s New Condo Construction Market Education
Insights on Miami Real Estate Trends: A Discussion with Eli Beracha Professor of Real Estate Education
Fort Lauderdale Real Estate Forecast | Market Predictions for 2024 Education
2024 Miami Real Estate: Top 10 Predictions & Trends to Watch! Education
Leveling Up in Real Estate with Alvaro Nuñez Education
Miami Real Estate 2024 Forecast! #BetterDecisions CondoMarket
Correct Miami Real Estate Predictions For 3 Years Straight! With Ana Bozovic Education
Miami’s Luxury Condo Market: Fact From Fiction! With Craig Studnicky #BetterDecisions CondoMarket
Miami Housing Market Crash 2023/2024: DEBUNKED! Education
Is The Miami Luxury Housing Market in Trouble? Forecasting The 2024 Real Estate Market! Education
Miami Real Estate Forecast | Miami Real Estate Market Predictions for 2023 Education
As the Miami Real Estate Markets Shifts, Who is Vulnerable? Education


- Get our Newsletter
- Subscribe
- No Thanks
Get the latest news from Miami Real Estate News
Close
Edit Search
Close
2 of 14
Share this property
Recomend this to a friend, just enter their email below.
Close
Your email was sent successfully
Close
 COMPARE WITH CONDOGEEKS