- Best of All
- Best Miami Luxury Condos
- Most popular
- Relocating to Miami
- Private Schools
- Investments
- Gated communities
- Waterfront information
- Luxury homes
- Luxury Condos
- New Construction Condos in South Florida
- Independent Pre-Construction condo reviews for Miami
- Independent Pre-Construction condo reviews for Fort Lauderdale
The Coral Gables Real Estate Market Report 2019
The Coral Gables Real Estate Market Report 2019 – The Last 6 Months (June till November 2019)
Observations in the Coral Gables Real Estate Market below $1M
Fast Facts
- 4.9 Months of Inventory
- An average of 119 Days on Market before being sold
- An average of 4.7% discount from sales price
- Average sales price is $382 per SF
- An average of 13 homes per month are sold
- The Overall Neighborhood Health Score: 92
The most digestible and fast moving part of the single-family home market, no surprises here. We are looking at just 4.9 months of inventory. Selling on average 13 homes per month.
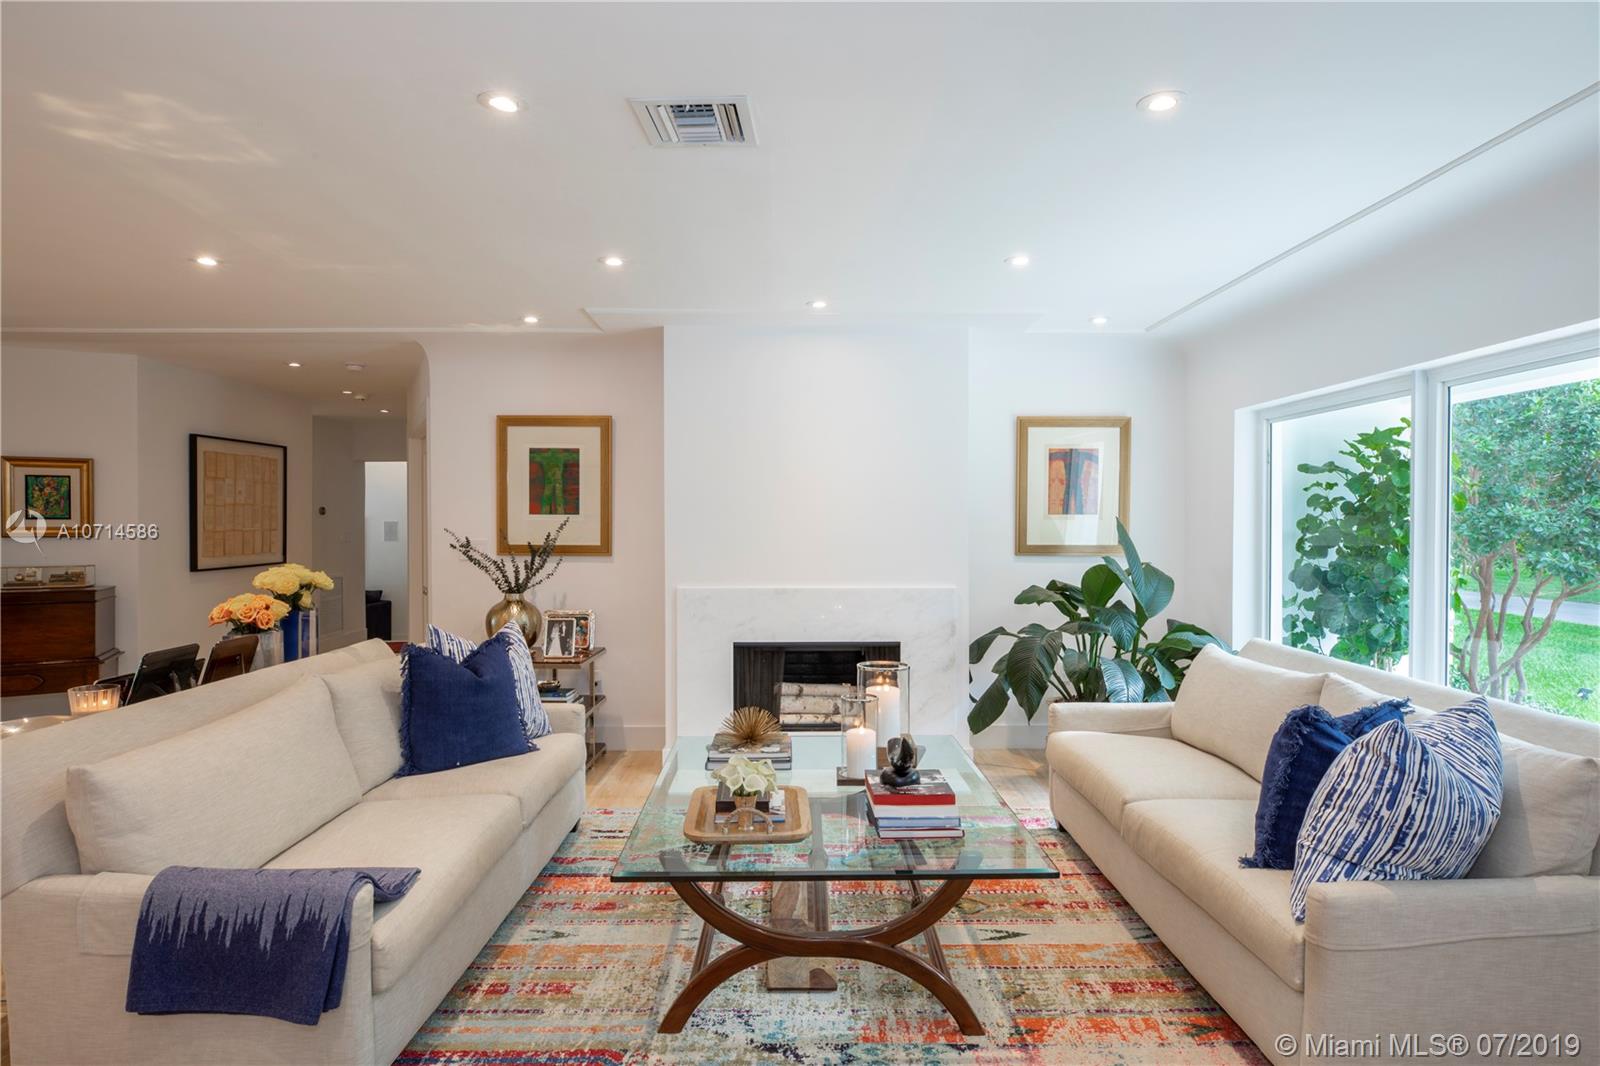
Characteristics: These are typically small 3 or 4 bedroom homes. Either small and well done ‘Old Spanish’ on small lots. Or larger (2,200 to 2,500 SF ranch style homes and in need of remodeling). As you would imagine about 66% of these homes are without a pool.
Strength of the market: This really is a pretty strong market. with such low inventory, product moves pretty well taking on average 70-80 days to get into contract (119 days on the market) and achieves 95% of asking price. This is the strongest market in the whole of Miami right now.

Working example
328 Manor Place got the record for the highest price per SF at a staggering $536 per sqft (taken over adjusted SF).
Observations in the Coral Gables Real Estate Market between $1M and $2M
Fast Facts
- 9.7 Months of Inventory
- An average of 158 Days on Market before being sold
- An average of 8% discount from sales price
- Average sales price is $434 per SF
- The Overall Neighborhood Health Score: 86
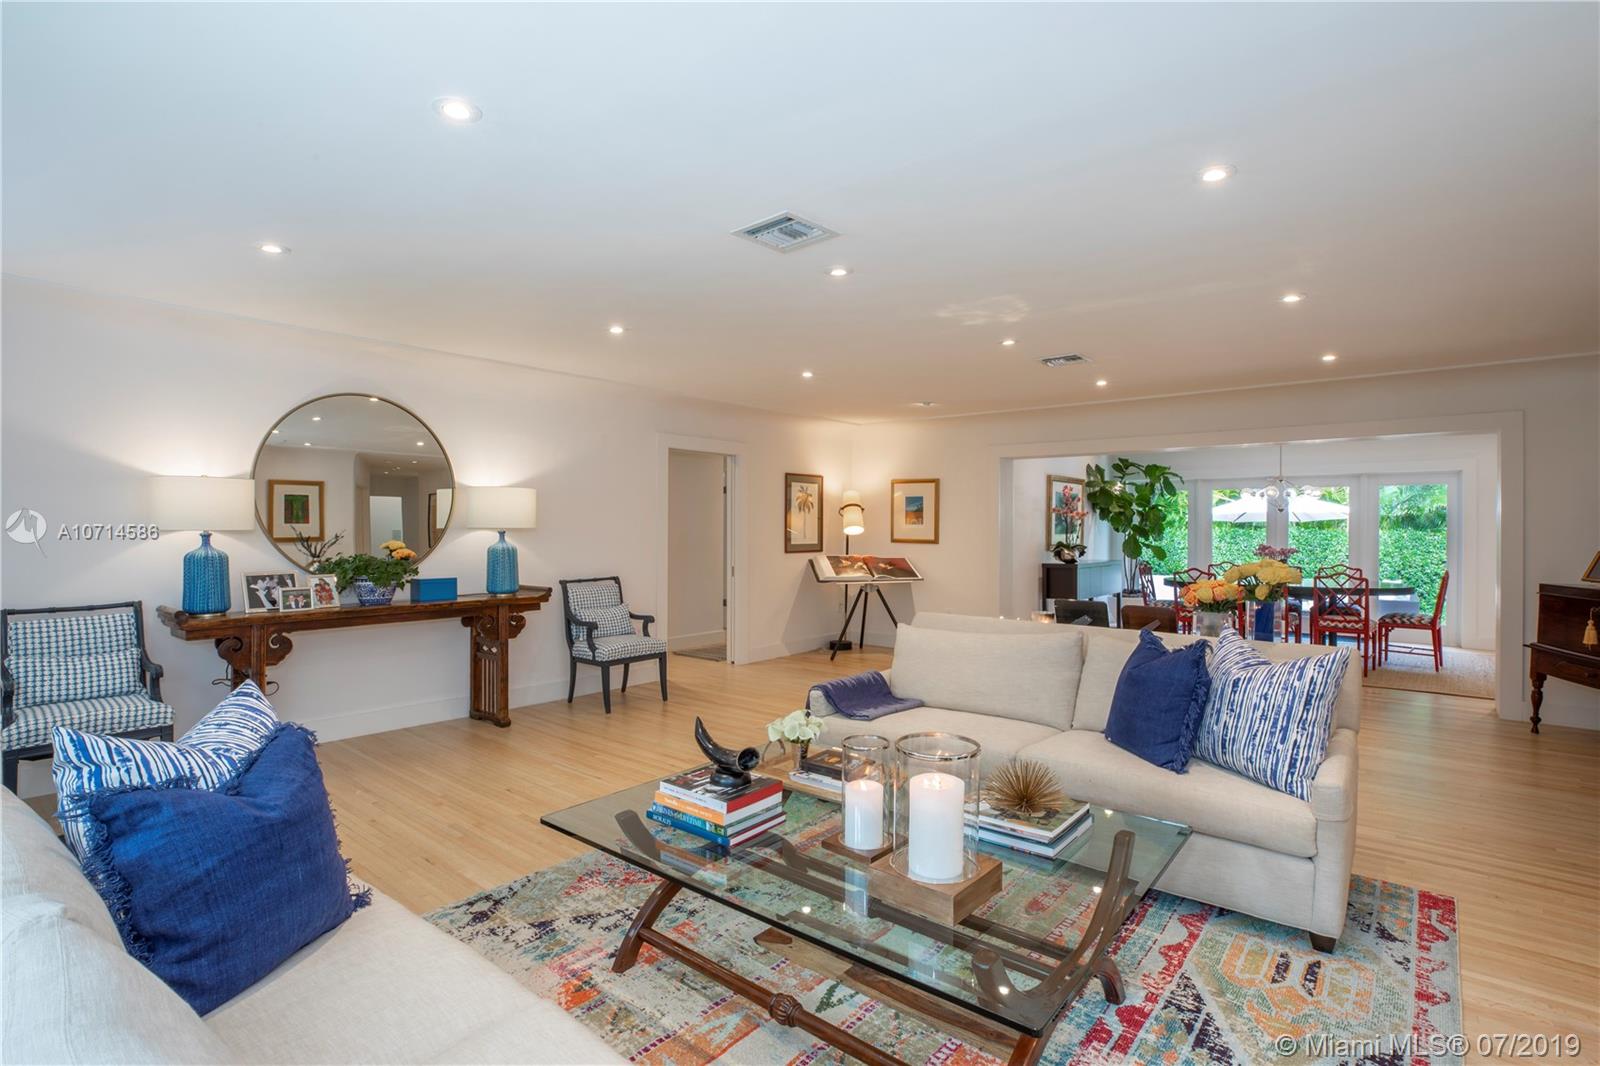
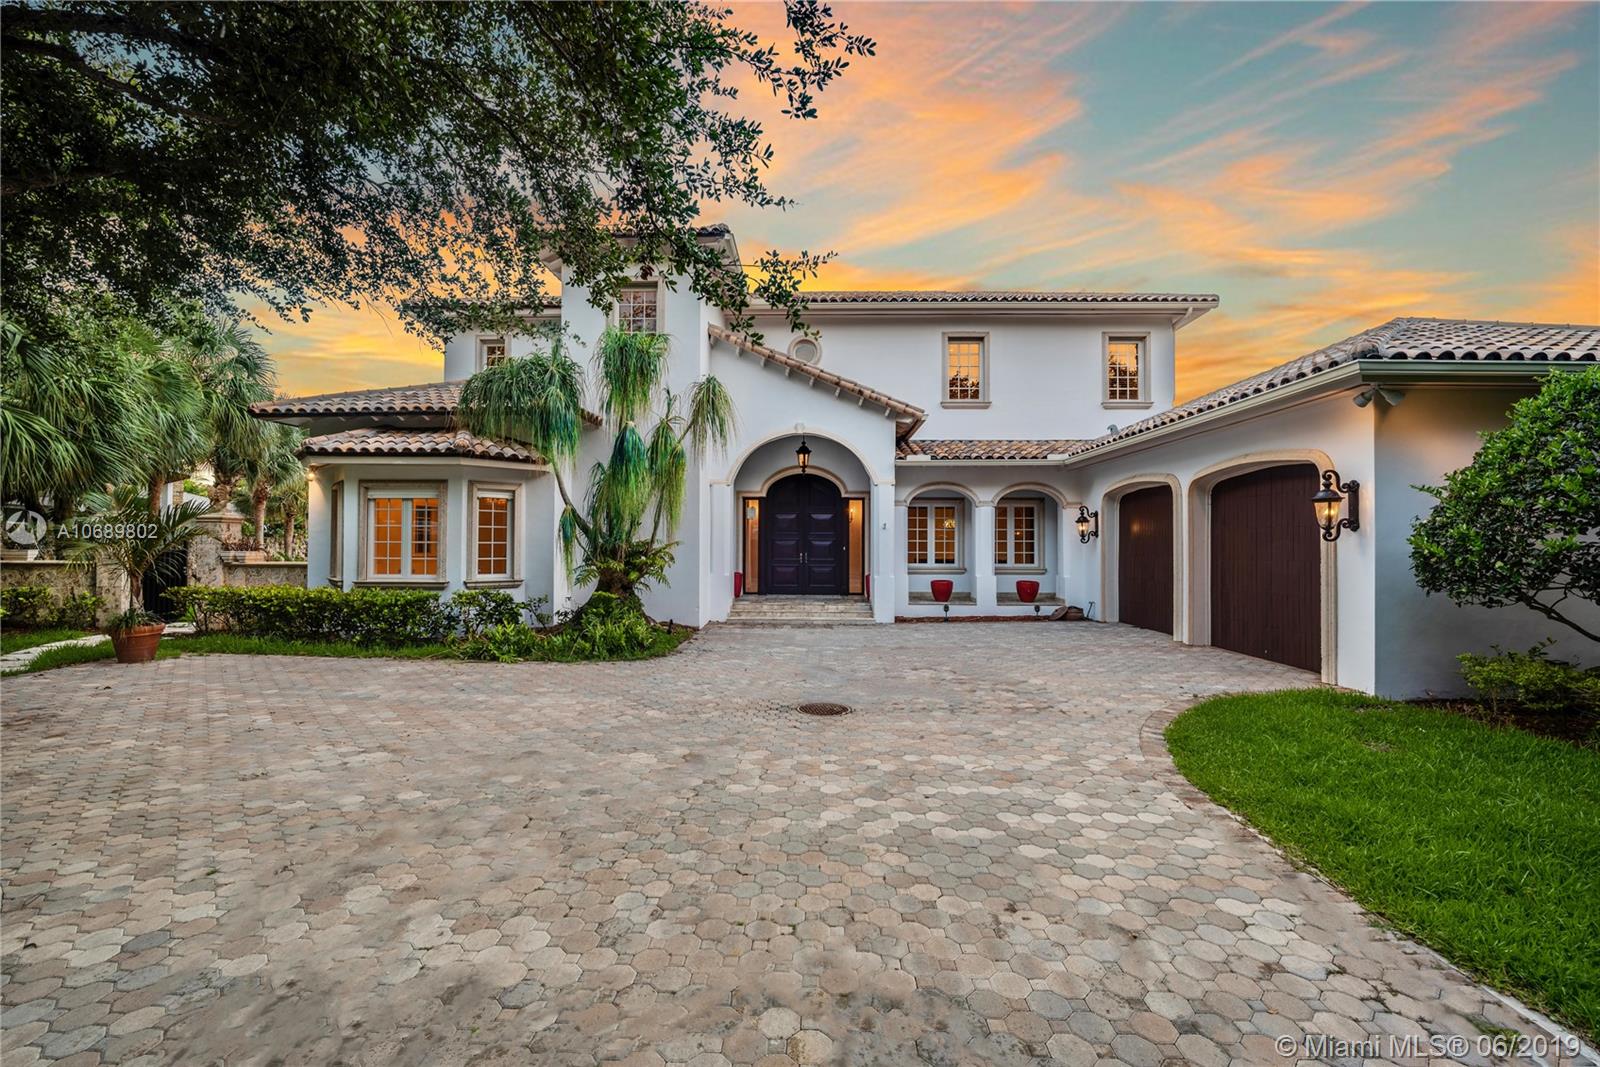
Characteristics: Within this market you are typically looking at a price tag of $430 – $530 per SF, with an average sales price of $434 per SF. If you get into a home below the $400 per SF range they are going to need updating. Expect to find lots of around 10,000 -12,000 SF . Type of homes in this price range vary between Old Spanish, Mediterranean and some ranch style homes. Sometimes a few modern ones (new with new contemporary design) are found, but unlikely to find anything new under $2M.
Strength of the Market: A score of 86 is a very good score and means the real estate market is resilient against economic change. This market is driven by primary home owners, families most often with kids going to the local private schools. You can find homes between $1M-$2M all across the Gables, even in some of the most exclusive gated communities.
Call me for the more specifics to this market.

Working example
7028 Mindello St is a typical example of a well-done home that sold in this price range. This 5 bedroom home offers 4,039 SF and sold for $1,872,600
Observations in the Coral Gables Real Estate Market between $2M and $3M
Fast Facts
- 15.1 Months of Inventory
- An average of 341 Days on Market before being sold
- An average of 8.2% discount from sales price
- Average sales price is $587 per SF
- The Overall Neighborhood Health Score: 64
29 Sales were registered and now the market changes considerably. Months of inventory rises to 15 months and the average price per SF is $587. One of the reasons there is a jump in the price per SF is because in this price range there is a solid number of brand new homes, very big lots and properties in gated communities. Cocoplum is a good example of comps you will see in this sector.
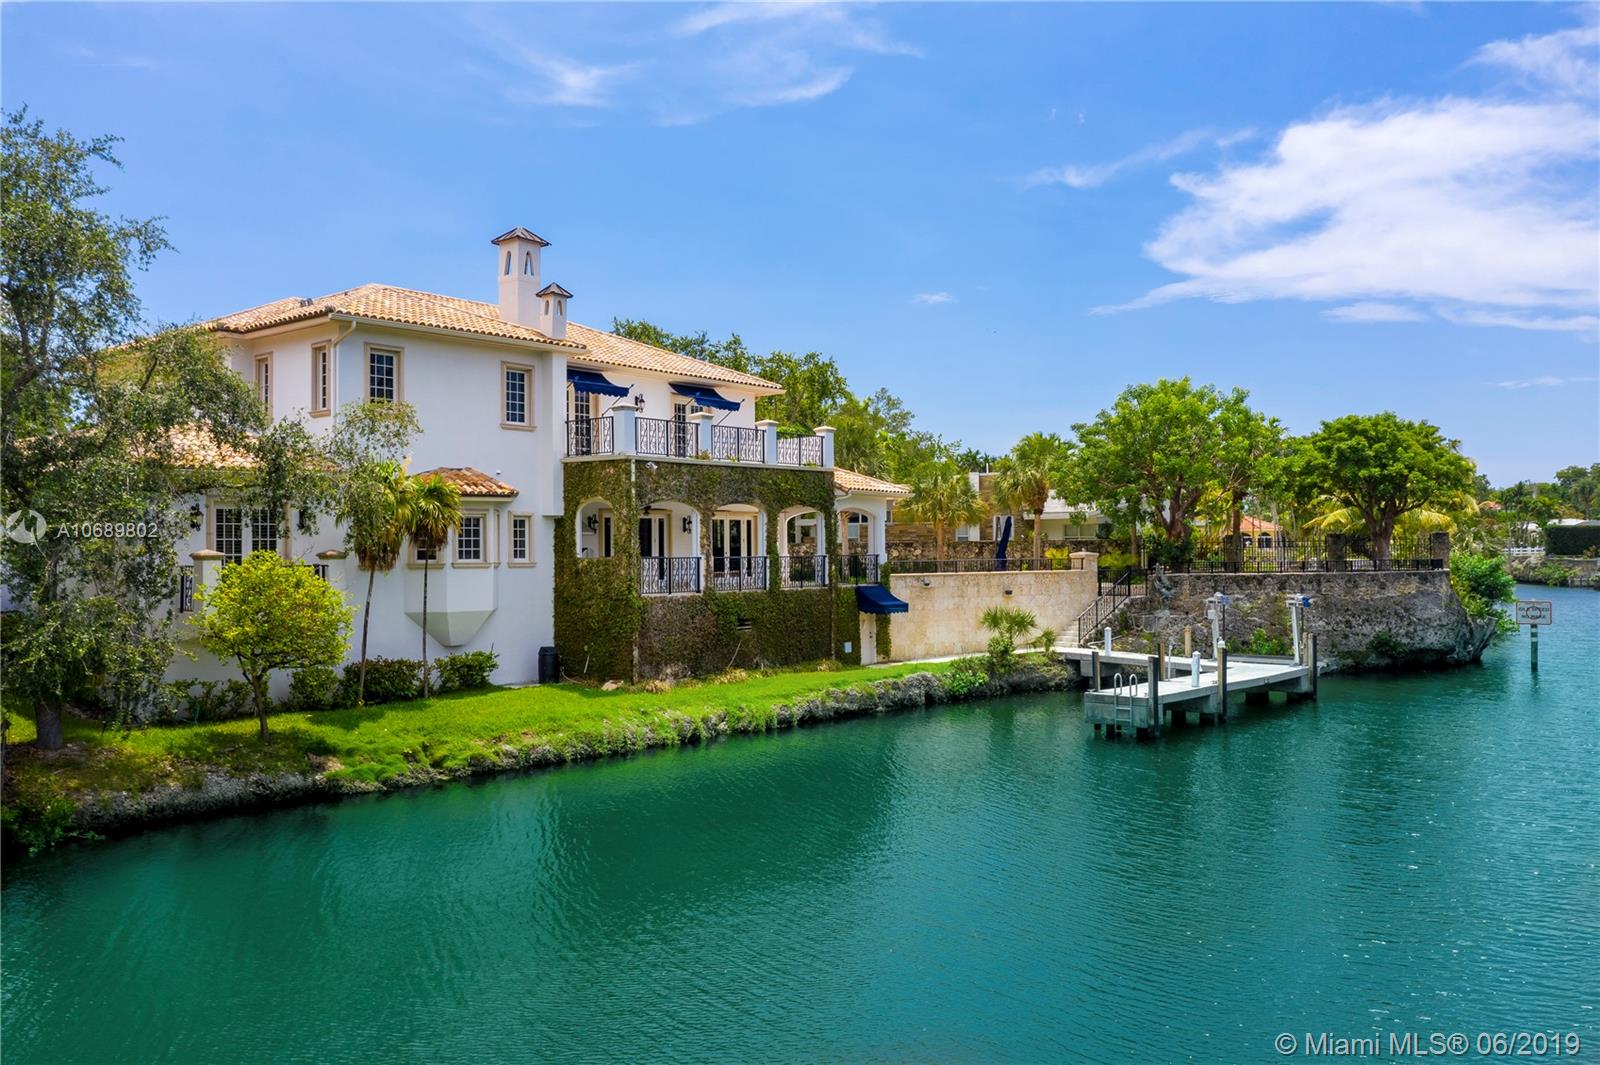
The number of waterfront home significantly rises now; 22 waterfront offerings currently exist at this price point. This is about a quarter of the product available on the market, but 13 sales in the last 6 months were waterfront, so in fact close to 50% of the sales were waterfront.

Working examples
Top Dollar per SF for a dry lot home was paid for 1549 San Rafael Ave. The David Siddons Group sold this property within 44 days for $661 per SF ($2.1M)
1228 Catalonia Ave, a more typical sale at this price point. This 5,200 SF (adjusted) home is a brand new construction on a 13,500 SF lot close to the Granada golf course and sold for $2,850,000 or $616 per SF
Observations in the Coral Gables Real Estate Market between $3M and $5M
Fast Facts
- 27.9 Months of Inventory
- An average of 244 Days on Market before being sold
- An average of 9.5% discount from sales price
- Average sales price is $690 per SF
- The Overall Neighborhood Health Score: 65
There were 17 sales in the $3M – $5M price range in the last 6 months; 12 of these 17 were waterfront homes. These homes focused mainly around Cocoplum and the Gables waterways East of Us1. You really get into gated communities at this price point. At this level we also notice that the Gables distinguishes itself from the Grove where homes are this level don’t really exist, because there really are not that many gated communities.
Market is softer than last year but not immeasurably so.

Working example
1224 Alfonso Ave is a good example of a sale at this price point: A 6,500 SF waterfront home on a 21,000 SF lot. This property sold for $3.9M or $653 per SF
Observations in the Coral Gables Real Estate Market of $5M+
Fast Facts
- $5M – $8M: 72 Months of Inventory
- $8M+: 39 Months of Inventory
- 5M – $8M: An average of 261 Days on Market before being sold
- 8M+: An average of 352 Days on Market before being sold
- 5M – $8M: An average of 14.3% discount from sales price
- 8M+: An average of 13.7% discount from sales price
- 5M – $8M: Average sales price is $859 per SF
- 8M+: Average sales price is $1,616 per SF
- The Overall Neighborhood Health Score: 44
In the $5M+ market we saw 7 sales in the last 6 months and 39 current active listings. That is a high amount of listings for few sales. Almost all of the sales were located on waterfront lots (6 of the 7 sales) and all sales were located in gated communities.


Working example
500 Marquesa Drive in the Gated Community of Old Cutler Bay sold for $8,075,000 or $1,248 per SF
FAQ
These are the most commonly asked Google Real Estate Related questions
1. What are the Current Best New Condos in Miami?
If you want to hear in more details our opinions on the best new Miami new construction condos. Please read this article:Best New Construction Condos 2022-2023.
2. What is the best New Construction Condo in Fort Lauderdale?
In our opinion, the Residences at Pier Sixty-six are certainly the most interesting and unique. Already well underway this 32 Acre project will be home to the first of its kind Marina where owners will be able to anchor up vessels up to a staggering 400 ft! For specifics of this project see our independent review of this project.
3. How can I compare the new luxury construction Condos to the best existing Luxury Condos in Miami?
Our Best Luxury Condos in Miami article will prove to be very useful to those looking to compare the existing to the new. You may also want to watch this video which shows the performance of the best Condos in Miami over the last 15 years!
Please fill in your details and David Siddons will contact you
- Get our Newsletter
- Subscribe
- No Thanks
Get the latest news from Miami Real Estate News
Edit Search
Recomend this to a friend, just enter their email below.
 COMPARE WITH CONDOGEEKS


