


- Best of All
- Best Miami Luxury Condos
- Most popular
- Relocating to Miami
- Private Schools
- Investments
- Gated communities
- Waterfront information
- Luxury homes
- Luxury Condos
- New Construction Condos in South Florida
- Independent Pre-Construction condo reviews for Miami
- Independent Pre-Construction condo reviews for Fort Lauderdale
The 2025 Pinecrest Real Estate Report | 5 Market Truths Every Buyer & Seller Should Know
Summary
The first half of 2025 presents a distinct shift in the Pinecrest single-family home market. While overall sales volume declined across all price brackets, the fundamentals of the Pinecrest market remain solid. Buyers now benefit from increased leverage due to longer days on market and more selective purchase behavior, while sellers with well-presented, realistically priced homes still see success.
This report analyzes each price bracket in depth—highlighting year-over-year performance, pricing trends, buyer psychology, and inventory movement. With new highs reached in 2024 and stable activity in 2025, Pinecrest remains one of Miami’s premier residential markets.
1. Buyers Have the Leverage Now
Longer days on market and rising inventory mean patient, selective buyers are firmly in control — especially above $3M.
2. Exceptional Still Sells
Turnkey, well-located, and design-forward homes are moving — everything else needs a price cut or a marketing reset.
3. $10M+ Is a Trophy Game
Sales rose, but only for best-in-class homes. Inventory exploded, and average listings are sitting unless repositioned.
4. $3M–$6M Shows Surprising Strength
Despite fewer sales, price per square foot rose — proving buyers will pay for quality and value in this middle tier.
5. The Era of Aspirational Pricing Is Over
Sellers who adapt — with sharp pricing and strong presentation — are the ones seeing success. The rest are being left behind.
$10M+: Luxury without Compromise

Despite slightly more sales in 2025 so far, inventory remains high, confirming a slow-moving, buyer-selective ultra-luxury market.
While sales rose from 2 to 3 (+50%), the data set is small and skewed by one listing that sat on the market for over 768 days. Median days on market (DOM) climbed from 359 to 431 days (+20.1%), and price per square foot fell slightly from $1,254 to $1,201 (-4.2%). Inventory exploded from 14 to 36 months (+157%). Much of this inventory surge can be traced back to a wave of speculative building. Developers rushed into Pinecrest, pushing out homes that were often spec-level in quality but priced like custom builds. That mismatch is now showing up in prolonged days on market and buyer hesitation. Today’s luxury buyers—many from New York and California—are more discerning and selective. When the product doesn’t match expectations in person, they wait. And with so much available inventory, the psychology shifts: more choice breeds more hesitation. Everyone’s talking, especially in tight-knit school and family circles, and that word-of-mouth further amplifies buyer caution. True custom homes are rare, maybe one in twenty. Yet even the good ones are being lumped into the broader perception that “everything is overpriced.” This is where pricing and presentation become critical. Sellers are often not motivated to adjust, but the reality is clear: you have to fight in your own weight class. If your home isn’t priced for the market—or doesn’t deliver exceptional quality—it simply won’t move.
Advice: Buyers should focus on high-quality, undervalued outliers. Sellers need to either stand out or step down—average product at a premium price will get left behind.

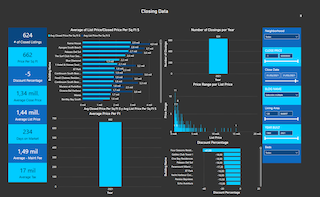
Click on the image and view the sold Pinecrest homes from the last 3 months in this price point. Listed from highest to lowest $ per sqft.

$6M–$10M: Oversupply Meets Hesitation

This segment experienced a drop in sales from 6 to 5 (-16.7%) and a surge in median days on market—from 182 to 350 days (+92.3%). Price per square foot fell from $1,067 to $1,024 (-4%), while inventory climbed from 26 to 31 months. In reality, on the ground, it feels even higher—some estimate inventory nearing three years. Much of this oversupply stems from a rush of new construction that entered the market around the $6M mark, with homes often built on large lots and priced like custom builds despite feeling more spec-level in execution. Buyers—especially from markets like New York and California—are highly cautious, value-driven, and hesitant to move on product that feels overpriced or underwhelming. Most homes in this range now require negotiation, and dated or boxy designs are being passed over. Sellers holding onto 2022–2023 pricing expectations are facing long listing periods and minimal traction. In this new market reality, if your home isn’t truly exceptional and priced right, it won’t move.
Advice: Buyers should target standout homes with long days on market for potential deals. Sellers must aggressively reposition with top-tier marketing and competitive pricing—average won’t cut it.

Click on the image and view the sold Pinecrest homes from the last 3 months in this price point. Listed from highest to lowest $ per sqft.
$3M–$6M Market: Value Holds, But Patience Reigns

Despite a dip in sales from 26 to 21 (-19.2%), this bracket showed pricing resilience, with price per square foot rising from $819 to $848 (+3.5%). While this signals continued appetite for quality homes, days on market increased from 132 to 182 (+38%), and inventory rose from 9 to 12 months—indicating a more patient, value-driven buyer pool. Several homes in this range have sold or gone pending, particularly well-finished, non-new builds on good streets. Pinecrest remains one of the few areas in Miami where buyers can still find larger homes with yards in this price point—something increasingly rare in Coral Gables or Coconut Grove. Buyers are showing up for standout product, but they’re taking their time and expecting value. Sellers are facing increased negotiation, with final sales averaging around 91% of original list price.
Advice: Buyers should remain selective and leverage extended days on market to negotiate stronger deals. Sellers must lead with quality, realistic pricing, and top-tier presentation—this segment rewards substance over hype.

Click on the image and view the sold Pinecrest homes from the last 3 months in this price point. Listed from highest to lowest $ per sqft.
$1M–$3M Market: Pinecrest’s Most Balanced Segment

In 2025, it sits at 91.4%, signaling that sellers must be more realistic to close deals. Because of this increased realization we also see the amount of expired listings decline creating a more balanced market.
The $1M–$3M price range remains Pinecrest’s most active and balanced market. While sales declined from 40 to 33 (-17.5%), homes in this bracket are still moving at a relatively healthy pace compared to higher price points. Median days on market increased modestly from 54 to 67, and average price per square foot dipped slightly from $822 to $786 (-4.4%). Inventory rose from 4.5 to 7.3 months—an increase, but still within the bounds of a balanced market. There are approximately 50 active listings in this range, mostly located west of 67th Avenue near US-1. Typical homes are 3-bedroom ranch-style properties on 15,000–20,000 sqft lots, often remodeled and offering strong value—especially when compared to Coral Gables or Coconut Grove, where entry at this price point is nearly impossible. Move-in-ready homes are trading around $800 per square foot, which is considered very reasonable for the quality of life Pinecrest delivers. Buyers are primarily young families looking for land, space, and access to top-rated schools. The appeal of Pinecrest lies in its family-friendly atmosphere and its proximity to the same lifestyle “ecosystem” shared with more expensive nearby neighborhoods. While buyers have more room to negotiate, competition remains healthy for turnkey homes with modern updates, good layouts, and quality outdoor space.
Takeaway:
Pinecrest’s $1M–$3M market offers strong value and remains one of the few price points where both buyers and sellers can win. Buyers should act decisively on well-located, move-in-ready homes. Sellers who price realistically and present their homes well will continue to find success.

Click on the image and view the sold Pinecrest homes from the last 3 months in this price point. Listed from highest to lowest $ per sqft.
Key Takeaways of our 2025 Pinecrest Real Estate Report by Metric:
- Sales Volume: Declining in all ranges except $10M+, but driven by limited data.
- Price per Square Foot: Stable overall; only the $3M–$6M range saw increases.
- Days on Market: Up across all brackets, especially $6M+.
- Inventory: Highest increases seen in $10M+, followed by $6M–$10M.
- Negotiation: Discounts are widening, especially in mid to high-luxury tiers.
Buyer and Seller Psychology
2025 Buyer Psychology Buyers across all segments are showing more discipline and patience. Many are taking a wait-and-see approach, influenced by interest rate fluctuations and broader economic signals. Turnkey homes with good design, layout, and lot value continue to draw strong demand. Negotiation is now expected.
2025 Seller Mindset The era of overpricing and waiting for the market to catch up is over. Sellers who lead with realism, invest in presentation, and understand the buyer mindset are the ones finding success. The rest risk stagnation.
Rental Market Snapshot
Rental activity was steady in the $5K–$10K range, with slight dips in price per square foot from $3.10 to $2.99. The higher-end rental market ($10K+) saw a decline in volume, particularly in the $15K+ range. However, an outlier rental at $34,000/mo in 2025 underscored the continued demand for extraordinary properties.
Advice: Investors and landlords should aim for quality, functional rentals in the $5K–$10K range. Higher-end properties need to offer exceptional value to stand out.
| Rental Bracket | Rentals (2024) | Avg $/SqFt (2024) | Rentals (2025) | Avg $/SqFt (2025) |
| $5,000– $10,000 | 21 | $3.10 | 22 | $2.99 |
| $10,000– $15,000 | 10 | $3.88 | 5 | $3.52 |
| $15,000– $20,000 | 3 | $3.86 | 1 | $3.71 |
| $20,000+ 0 - 1 $4.69 | 0 | - | 1 | $4.69 |
2025 Pinecrest Real Estate Report Closing Thoughts
While 2025 shows some market softening, Pinecrest continues to hold strong as a family-oriented neighborhood with top-tier schools and quality housing stock. This moment offers buyers more leverage and room to negotiate, while sellers who respond to current conditions can still achieve success. Design-forward, turnkey homes and strong land parcels remain in demand. Expect a potential pickup in activity if interest rates stabilize further into 2025.
Connect with the David Siddons Group
Questions about our 2025 Pinecrest Real Estate Report or the overall market? Call the David Siddons group at 305.508.0899 or schedule a meeting via the application below.
FAQ
These are the most commonly asked Google Real Estate Related questions
1. What are the Current Best New Condos in Miami?
If you want to hear in more details our opinions on the best new Miami new construction condos. Please read this article:Best New Construction Condos 2022-2023.
2. What is the best New Construction Condo in Fort Lauderdale?
In our opinion, the Residences at Pier Sixty-six are certainly the most interesting and unique. Already well underway this 32 Acre project will be home to the first of its kind Marina where owners will be able to anchor up vessels up to a staggering 400 ft! For specifics of this project see our independent review of this project.
3. How can I compare the new luxury construction Condos to the best existing Luxury Condos in Miami?
Our Best Luxury Condos in Miami article will prove to be very useful to those looking to compare the existing to the new. You may also want to watch this video which shows the performance of the best Condos in Miami over the last 15 years!
WHY WORK WITH DAVID? THINGS YOU SHOULD KNOW...
For all our analytics we are agents driving some very unique and advanced tech. We Provide a granular and custom experience that empower our clients with the insight and tools to understand the most complex behaviors of any local markets.
-
Analytical
Over 100 reports produced to date
-
Knowledgeable
Over 1800 published articles and counting


Related Articles

Sunny Isles Real Estate Market Q1 2026

Who Is the Best Real Estate Agent in Miami for New Construction Condos? (2026 Data-Driven Guide)

How to Buy a Luxury Condo in Miami (2026 Playbook for Smart Buyers)
Pinecrest Real Estate Market Update Q1 2026

Aventura Real Estate Market Report Q1 2026

Brickell Real Estate Market Report Q1 2026
Coconut Grove Real Estate Market Q1 2026

South of Fifth Real Estate Market Report Q1 2026
Fort Lauderdale Luxury Real Estate Update Q1 2026 | A Quiet Market Shift is Underway

Best Value Neighborhoods in Miami

Real Estate Investing in 2026: Why the Old Strategies No Longer Work
West Palm Beach Real Estate Market 2026: Luxury Prices Surge & New Developments Redefine the Market

Coconut Grove vs South of Fifth Condos: Which Miami Luxury Neighborhood Is Right for You?

Mandarin Oriental Residences launches in West Palm Beach
Please fill in your details and David Siddons will contact you
Search related videos

Are St. Regis Sunny Isles Residences Worth the Brand Premium?
Coral Gables Market Report 2025: What the Headlines Aren’t Telling You!
How David Siddons’ Power Team Drives Miami’s Luxury Market
Mid‑Year 2025 Coconut Grove Report: The Truth About What’s Selling Now
Brickell Mid‑Year Market Report 2025 | Is Brickell’s Luxury Market in Trouble?
Pinecrest Mid-Year Market Report 2025 | What’s Selling, What’s Sitting & Why
Miami Beach Condo Market Mid-Year Report 2025 | What Buyers & Sellers Need to Know
How to Lose $1M in The Miami Condo market | Top Mistakes That Cost Miami Condo Buyers Millions
The Well Project EXPOSED Coconut Grove’s Hottest Units
Miami Real Estate in 2025 Is NOT What You Think 😱 | Midyear Must Knows for Buyers & Sellers!
7 Things You Should Never Say to a Real Estate Agent in Miami!
Landmark Victoria Park Residence in Fort Lauderdale: Inside 420 NE 11th Ave 🌴✨
Luxury Living on 2355 S. Miami Ave | Fully Furnished 4-Bed Home w/ Resort-Style Pool 🏊
Is Mandarin Oriental Residences Miami a Smart Condo Investment? Prices, Floorplans, Views & Finishes


- Get our Newsletter
- Subscribe
- No Thanks
Get the latest news from Miami Real Estate News
Close
Edit Search
Close
2 of 14
Share this property
Recomend this to a friend, just enter their email below.
Close
Your email was sent successfully
Close
 COMPARE WITH CONDOGEEKS