- Best of All
- Best Miami Luxury Condos
- Most popular
- Relocating to Miami
- Private Schools
- Investments
- Gated communities
- Waterfront information
- Luxury homes
- Luxury Condos
- New Construction Condos in South Florida
- Independent Pre-Construction condo reviews for Miami
- Independent Pre-Construction condo reviews for Fort Lauderdale
The Best Miami Beach Condos in terms of Demand!
Which Miami Beach Condos are Moving?
As Miami Beach real estate experts we are constantly trying to get new insights into the market. While the Miami Beach condo market is seeing a moment of stagnation and price corrections (as can be seen in our 2017 Miami real estate report) we have seen a few of our listings sell extremely fast. This made us want to look inside the individual Miami Beach condos to see which condos are in demand and which condos are moving the most. The best ranking condos here are not the best condos or the best priced condos, they are merely the best moving condos or the condos with the most demand (Which might of course say something about the quality, location and price/value ratio).
We dissected the market on several criteria to see which Miami Beach condos are moving. We used 52 Miami Beach condos for our study and we provided you with the following data:
- Amount of units in the condo
- Total number of units sold in 2017
- Total number of units for sale as per Dec 2017
- Months of Inventory
- For condos <$1M: Below 6 months is a sellers market (more demand than supply)
- For condos >$1M: Below 12 months is a sellers market (more demand than supply)
- Percentage of building that sold in 2017
- Percentage of building listed at this moment
- Units for sale as a percentage of units sold in 2017

The Setai Residences in South Beach
The Best Miami Beach Condos: Demand vs Supply
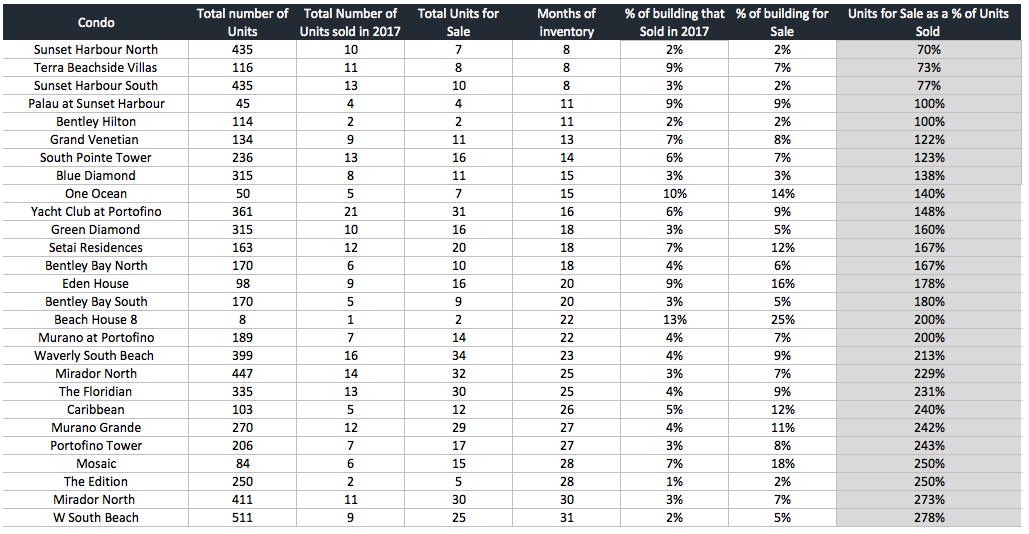
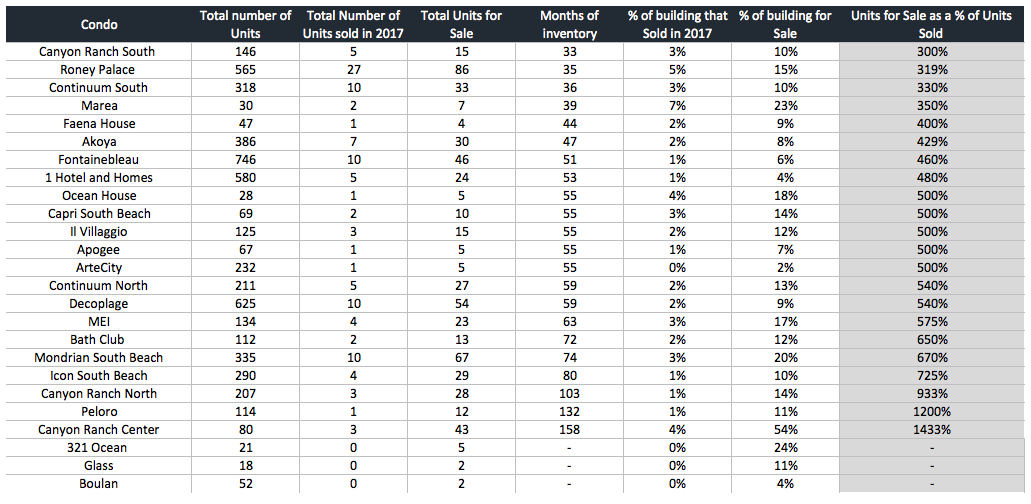
The table below is showing Miami Beach condos ranked by demand (See column “Units for Sale as a % of Units Sold”). As the column name describes; we ranked the condos by taking the amount of listings as a percentage of units sold in 2017. This provides you with an overview of the demand/supply curve of the specific condo.
The top 5 of best ranking condos all show 100% or less within this column, which means there are more (or an equal amount of) sales than listings in the building. For Sunset Harbour North for example the amount of listings is only 70% of the amount of units sold. This translates into the condo seeing more demand than supply. Comparing this to the buildings at the bottom of the list, we see high percentages meaning there are much more listings than actual sales (eg 500% means there is 5 times more listings than units sold). In this situation supply exceeds demand, which is likely to result in a decrease in prices to re-establish the market dynamic. This calculation shows you the same kind of information as the “Months of Inventory” indicator. As you can see from the tables, the most demanded condos also show the lowest amount of months of inventory.
Explanation of Months of Inventory
Condos below $1Million: Neutral Market between 6 and 9 Months, Sellers market below 6 months and buyers market above 9 months.
Condos above $1Million: Neutral Market between 12 and 18 Months, Sellers market below 12 months and buyers market above 18 months
A sellers market is a market in which there is more demand than supply, meaning the seller has an advantage and prices are likely to increase in order to balance the market
A buyers market is a market in which there is more supply than demand, meaning the buyer has an advantage and prices are likely to decrease in order to balance the market
Columns explained:
- Months of Inventory: Total amount of listings divided by average amount of units sold per month ( until Dec 1 2017 )
- For Sunset Harbour North: 10 units sold in 11 months so on average 0.909 units per month. With 7 listings that is 7 divided by 0.909 is 7,7 months of inventory (rounds up to 8)
- Percentage of building that sold in 2017: Total number of units that sold in 2017 divided by total amount of units in the building (Times 100 to get percentage)
- For Sunset Harbour North: 10 units sold divided by the in total 435 units is 0.02. Times 100 to get a percentage is 2% (rounded)
- Percentage of building listed at this moment: Total number of listings divided by total amount of units in the building (Times 100 to get percentage)
- For Sunset Harbour North: 7 units listed divided by the in total 435 units is 0.016. Times 100 to get a percentage is 2% (rounded)
- Units for sale as a percentage of units sold in 2017: Listings divided by total amount of units sold in 2017 (Times 100 to get percentage)
- For Sunset Harbour North: 7 Listings divided by 10 units that sold in 2017 is 0.7. Times 100 to get a percentage is 70%
The Best Miami Beach Condos: Condo Sales as a Percentage of Total Units
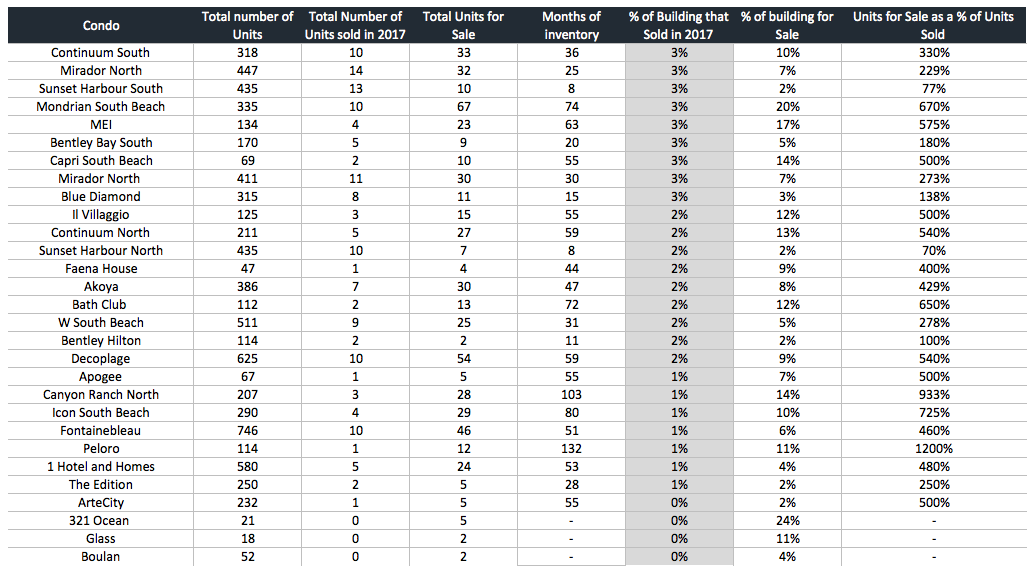
The table below ranks Miami Beach condos on their movement or with other words, which percentage of the building sold in 2017 (see column “% of building that sold in 2017). This is calculated by taking the number of units that sold as a percentage of total number of units that the building offers (listed and non listed).
- Months of Inventory: Total amount of listings divided by average amount of units sold per month ( until Dec 1 2017 )
- Percentage of building that sold in 2017: Total number of units that sold in 2017 divided by total amount of units in the building
- Percentage of building listed at this moment: Total number of listings divided by total amount of units in the building
- Units for sale as a percentage of units sold in 2017: Listings divided by total amount of units sold in 2017
FAQ
These are the most commonly asked Google Real Estate Related questions
1. What are the Current Best New Condos in Miami?
If you want to hear in more details our opinions on the best new Miami new construction condos. Please read this article:Best New Construction Condos 2022-2023.
2. What is the best New Construction Condo in Fort Lauderdale?
In our opinion, the Residences at Pier Sixty-six are certainly the most interesting and unique. Already well underway this 32 Acre project will be home to the first of its kind Marina where owners will be able to anchor up vessels up to a staggering 400 ft! For specifics of this project see our independent review of this project.
3. How can I compare the new luxury construction Condos to the best existing Luxury Condos in Miami?
Our Best Luxury Condos in Miami article will prove to be very useful to those looking to compare the existing to the new. You may also want to watch this video which shows the performance of the best Condos in Miami over the last 15 years!
Please fill in your details and David Siddons will contact you
- Get our Newsletter
- Subscribe
- No Thanks
Get the latest news from Miami Real Estate News
Edit Search
Recomend this to a friend, just enter their email below.
 COMPARE WITH CONDOGEEKS


