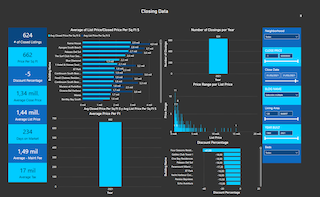
Welcome to our market statistics page for Downtown. Covering the key indices of months of inventory (MOI), $ per sqft, percentage discounts off asking price, and Sqft of properties. Choose between homes and Condos in five price ranges. The prices shown are the sold prices of the properties going back from 3-24 months.
Inventory levels (MOI) will help establish who has the upper hand and the likely market direction. Over 9 MOI – Buyer’s market with likely softening prices, or under 9 MOI – Seller’s market with likely appreciation. Historical $ per sqft will help gauge where the market is and the ranked specific sales which can be independently viewed will help weigh any subject property against the SOLD product. Wider historical and macro analysis of the neighborhood is achieved by visiting the Smart Geeks Tool. Look throughout the pages for the Smart Geeks Logo!
Search results
- Address
- Price
- % / $
- Beds
- Baths
- Living Size
- Price / Sq.Ft.
- Development / Subdivision


