- Map view
- Advanced Analytics
Lpsum dolor sit, amet consectetur adipisicing elit. Incidunt excepturi similique sunt soluta, iste architecto porro eos amet perspiciatis, eaque vitae ipsam quos omnis, doloribus perferendis distinctio laudantium laborum magnam?
| South Miami Real Estate |
67
UP TO 1M
Score 67
South Miami Real Estate
|
48
1M UP TO 2M
Score 48
South Miami Real Estate
|
52 | 16 | 16 | 16 | 16 |
|---|---|---|---|---|---|---|---|
| Pinecrest Real Estate | 67 | 48 | 52 | 16 | 16 | 16 | 16 |
| Palmetto Bay Real Estate | 67 | 48 | 52 | 16 | 16 | 16 | 16 |
| Miami Beach Real Estate | 67 | 48 | 52 | 16 | 16 | 16 | 16 |
| Key Biscayne Real Estate | 67 | 48 | 52 | 16 | 16 | 16 | 16 |
| Downtown Miami Real Estate | 67 | 48 | 52 | 16 | 16 | 16 | 16 |
| Coral Gables Real Estate | 24 | 117 | 150 | 19 | 19 | 19 | 19 |
| Coconut Grove Real Estate | 8 | 87 | 145 | 114 | 114 | 114 | 114 |
| Bal Harbour/Bay Harbor Islands Real Estate | 19 | 58 | 15 | 132 | 132 | 132 | 132 |
| Aventura Real Estate | 10 | 92 | 35 | 72 | 72 | 72 | 72 |
| UP TO 1M | 1M UP TO 2M | 2M UP TO 3M | 3M UP TO 5M | 5M UP TO 8M | 8M+ | AVG Neigh |
neighborhood economic health score (nehs)
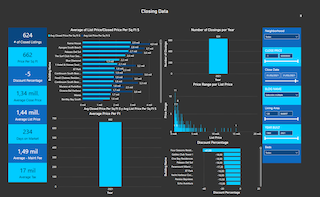
The Economic Health Score is the patented brainchild of DSG. It is fundamentally an easy way to gauge the real estate health of your chosen neighborhood and specific price point. Think of it like a ‘credit score’ for your neighborhood. A combined AND carefully weighted score of the following indexes: Months of inventory, Cumulative Days on the market (based off Sold properties) and the % difference of asking price to eventual sales price. As much as this is highly detailed and useful it is the ‘tip of the iceberg’. Our advanced registered users will be given access to much more. Regardless of whether you are a buyer or a seller call me for more information on how this can help you make a better decision!

homes area 1
- HOMES FOR SALE
- CONDOS FOR SALE
This is your actual Neighborhood Economic Health Score (NEHS) It is the best way to measure the strength of your neighborhood. Scored out of 100. The score combines:
1. Rate of absorption (months of Inventory)2. Average Days on the market to sell
3. Sales price to Asking Price as %.
Click the arrow on the ring to reveal the score
* High scores reflect a strong neighborhood property market. A seller market.
* Low scores reflect a weak neighborhood property market. A buyers market.
Please click any specific box to reveal the NEHS Dials with the 3 combined Index calculations for Months of Inventory score, Days on the Market score and % difference of asking price to Sales price score.