


Fisher Island Condos for Sale are the Highest Appreciating Condos in Miami!
April 16, 2024
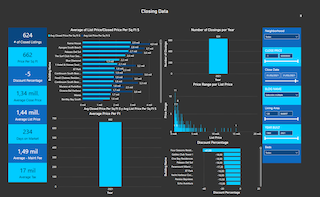
Fisher Island condos are among Miami's most sought-after properties. These residences offer exceptional privacy and exclusivity, making them highly desirable. They also boast some of the highest rates of value increase in Miami. Our recent study, which analyzed sales data from 100 Miami condos, revealed that 4 out of the top 12 condos with the greatest appreciation were situated on Fisher Island. The Highest Appreciating Condos in Miami in 2024 Ranking Condos 2024 2023 2018 Appreciation (2023 vs 2018) 1 Bayside Village $1,739 $1,643 $606 [...]