


- Best of All
- Best Miami Luxury Condos
- Most popular
- Relocating to Miami
- Private Schools
- Investments
- Gated communities
- Waterfront information
- Luxury homes
- Luxury Condos
- New Construction Condos in South Florida
- Independent Pre-Construction condo reviews for Miami
- Independent Pre-Construction condo reviews for Fort Lauderdale
Miami Beach Real Estate Update – Quarter 4 2015 | Quarter 1 of 2016
The Miami Beach Real Estate Market in a Nutshell
♦ Average prices ♦ Inventory levels ♦ Number of sales

Get a quick overview of the Miami Beach Real Estate Market in the first half year of 2016
Our quarterly real estate updates are excellent to gather a pulse on the Miami Beach real estate market as we provide the market’s key indicators. Although our real estate updates are refreshed each quarter they focus on the last half year of Miami Beach real estate data to provide you with a more complete overview of the market. All data are derived from the MLS South Florida
Data are given for Miami Beach homes in the price ranges of:
- $750,000 – $1,5M
- $1,5M – $3M
- $3M +
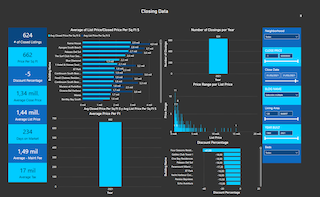
Summary of the Miami Beach Real Estate Market– Q4 2015 and Q1 2016
Please find all the data in the table below. For the more visual people, the graphs will follow hereafter.
Click on image to enlarge

The Average Sales Prices per Sq.Ft for Miami Beach homes
Have a look at the average sales prices per Sq.Ft for Miami Beach homes in the last 6 months
Please note that this graph provides the data for three different price ranges. The thicker, straight lines are trend lines and provide you with a better idea of to where the market is heading.
Click on image to enlarge

The Months of Inventory for Miami Beach Homes
The months of inventory is an important indicator in real estate. It indicates how many months it takes to sell all the current listings under the assumption that no new listings will enter the market.
Please note that this graph provides the data for three different price ranges. The thicker, straight lines are trend lines and provide you with a better idea of to where the market is heading.
Buyer’s market: more than 9 months of inventory based on closed sales
Seller’s market: less than 6 months of inventory based on closed sales
Neutral market: 6 – 9 months of inventory based on closed sales
Click on image to enlarge

Miami Beach homes for sale vs Miami Beach homes sold
This overview provides you with the amount of homes that sold vs the amount of homes that were listed on the market. This says something about the supply and demand of the Miami Beach home market
Please note that there are three different graphs for three different price ranges in the gallery
Click on images to enlarge
FAQ
These are the most commonly asked Google Real Estate Related questions
1. What are the Current Best New Condos in Miami?
If you want to hear in more details our opinions on the best new Miami new construction condos. Please read this article:Best New Construction Condos 2022-2023.
2. What is the best New Construction Condo in Fort Lauderdale?
In our opinion, the Residences at Pier Sixty-six are certainly the most interesting and unique. Already well underway this 32 Acre project will be home to the first of its kind Marina where owners will be able to anchor up vessels up to a staggering 400 ft! For specifics of this project see our independent review of this project.
3. How can I compare the new luxury construction Condos to the best existing Luxury Condos in Miami?
Our Best Luxury Condos in Miami article will prove to be very useful to those looking to compare the existing to the new. You may also want to watch this video which shows the performance of the best Condos in Miami over the last 15 years!
WHY WORK WITH DAVID? THINGS YOU SHOULD KNOW...
For all our analytics we are agents driving some very unique and advanced tech. We Provide a granular and custom experience that empower our clients with the insight and tools to understand the most complex behaviors of any local markets.
-
Analytical
Over 100 reports produced to date
-
Knowledgeable
Over 1800 published articles and counting


Related Articles

2024 Market Outlook with Eli Beracha (FIU) - Forecasting the 2024 Miami Real Estate Market

2024 Miami Real Estate Predictions and Forecast

The Raleigh Rosewood Residences Miami Beach

The Best Miami Beach Neighborhoods that are Non-Waterfront

The 2024 Miami Real Estate Market Forecast

Five Park Miami Beach | The Investment Value of the Park Residences

Miami Real Estate Predictions for 2024

Our Q1 & Q2 2023 Miami Real Estate Market Reports

The 5 Reasons to Buy a Waterfront Home on Allison Island, Miami Beach

2023 Miami Luxury Condo Report - Market Records new highs for 2023! | Q1/Q2 2023 Analysis
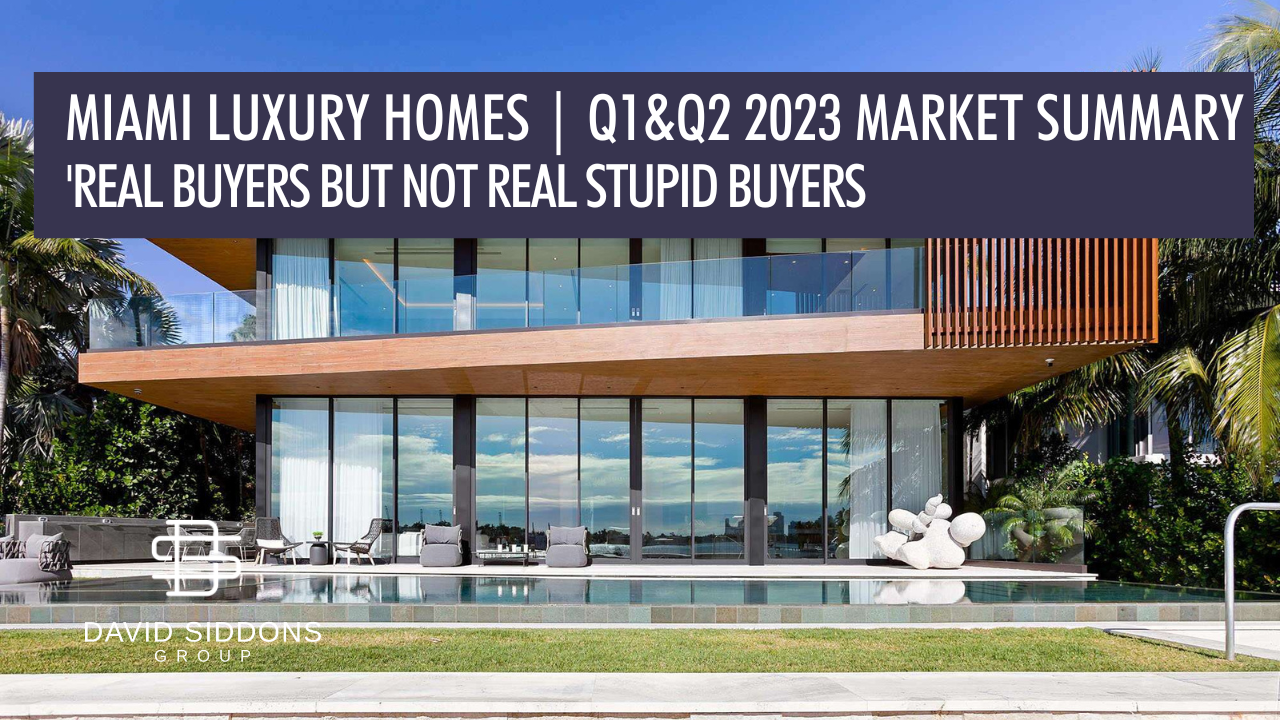
'Real Buyers but not real Stupid Buyers!' The 2023 Market Report for Luxury Homes in Miami (Q1/Q2)

Buyers are Targeting New Condos | Miami Beach Q1 and Q2 2023 Market Report

Stunningly Scarce Inventory Sparks Market Impasse | Kendall Q1 and Q2 2023 Real Estate Report

Rock Solid Condo Market Fueled by Cash | Surfside and Bal Harbour Q1 and Q2 2023 Market Report
Please fill in your details and David Siddons will contact you
Search related videos

South Flagler House | New Luxury Condos in West Palm Beach 🌴 🏙️ PalmBeach
Insights on Miami Real Estate Trends: A Discussion with Eli Beracha Professor of Real Estate Education
The Residences at Mandarin Oriental Miami | The Team's Vision NewCondosMiami
West Palm Beach Waterfront Condos | Olara Residences *Exclusive First Look* PalmBeach
Vita Grove Isle | Watch how this Brand New Miami Condo in Taking Shape NewCondosMiami
Fort Lauderdale Real Estate Forecast | Market Predictions for 2024 Education
Jupiter Luxury Residences Independent Review: Forté Luxe 🛥️✨ PalmBeach
2024 Miami Real Estate: Top 10 Predictions & Trends to Watch! Education
Leveling Up in Real Estate with Alvaro Nuñez Education
Inside Coconut Grove's Hidden Gem: The Elegant 3350 Ah We Wa St Residence CoconutGrove
Solemar Pompano Beach: Luxurious 3 Bedroom New Construction Condo Overlooking the Beach fort lauderdale
Custom Home in The Roads, Miami! *EXCLUSIVE TOUR* Listing
Cocoplum Miami Mansion Tour | Inside 285 Costanera Rd, Coral Gables Cocoplum
Mandarin Oriental Residences Miami Brickell | Is It Worth Your Investment? Unveil the Truth Now! Brickell
Unbiased Insight: Independent Review of La Mare Bay Harbor Islands, Florida Bay harbor Islands


- Get our Newsletter
- Subscribe
- No Thanks
Get the latest news from Miami Real Estate News
Close
Edit Search
Close
2 of 14
Email to a Friend
Recomend this to a friend, just enter their email below.
Close
Your email was sent successfully
Close
 COMPARE WITH CONDOGEEKS